Geothermal energy prospectivity of the Torrens Hinge Zone: evidence from new heat flow data
Chris MatthewsTorrens Energy Ltd, 12 Eton Road, Keswick, SA 5035, Australia and School of Geosciences, Monash University, Vic. 3800, Australia. Email: cmatthews70@yahoo.com.au
Exploration Geophysics 40(3) 288-300 https://doi.org/10.1071/EG09022
Submitted: 21 April 2009 Accepted: 15 July 2009 Published: 21 September 2009
Abstract
The Torrens Hinge Zone is a long but narrow (up to 40 km wide) geological transition zone between the relatively stable Eastern Gawler Craton ‘Olympic Domain’ to the west, and the sedimentary basin known as the Adelaide Geosyncline to the east. The author hypothesised from first principles that the Torrens Hinge Zone should be prospective for high geothermal gradients due to the likely presence of high heat flow and insulating cover rocks. A method to test this hypothesis was devised, which involved the determination of surface heat flow on a pattern grid using purpose-drilled wells, precision temperature logging and detailed thermal conductivity measurements. The results of this structured test have validated the hypothesis, with heat flow values over 90 mW/m2 recorded in five of six wells drilled. With several kilometres thickness of moderate conductivity sediments overlying the crystalline basement in this region, predicted temperature at 5000 m ranges between 200 and 300°C.
Key words: Adelaide Geosyncline, Australia, Curnamona Craton, Delamerian Fold Belt, Engineered Geothermal Systems, Gawler Craton, Heat Flow, Thermal Conductivity, Thermal Gradient, Torrens Hinge Zone.
Acknowledgements
The author wishes to acknowledge several people. Dr Graeme Beardsmore provided teaching and guidance on the measurement and modelling of thermal gradient, thermal conductivity and heat flow in the study. Alex Musson and Andrew Alesci carried out thermal conductivity measurements on existing rock samples, and Professor Mike Sandiford imparted valuable knowledge on the nature and distribution of heat flow and temperature in Australian Proterozoic terranes. The helpful reviewers’ comments and suggestions provided by Prame Chopra, Doone Wyborn and one anonymous reviewer are greatly appreciated as well. Last but not least, the staff and directors of Torrens Energy Limited (especially John Canaris, Dennis Gee, Christine Sealing and Bruce Godsmark) are thanked for collaborating to facilitate the heat flow study and also allowing the results to be published here.
Allen, S. R., Simpson, C. J., McPhie, J., and Daly, S. J., 2003, Stratigraphy, distribution and geochemistry of widespread felsic volcanic units in the Mesoproterozoic Gawler Range Volcanics, South Australia: Australian Journal of Earth Sciences 50, 97–112.
| Crossref | GoogleScholarGoogle Scholar | CAS |
Belousova, E. A., Preiss, W. V., Schwarz, M. P., and Griffin, W. L., 2006, Tectonic affinities of the Houghton Inlier, South Australia: U-Pb and Hf isotope data from zircons in modern stream sediments: Australian Journal of Earth Sciences 53, 971–989.
| Crossref | GoogleScholarGoogle Scholar | CAS |
Cull, J. P., 1982, An appraisal of Australian heat-flow data: BMR Journal of Australian Geology and Geophysics 7, 11–21.
Foden, J., Barovich, K., Jane, M., and O’Halloran, G., 2001, Sr-isotopic evidence for Late Neoproterozoic rifting in the Adelaide Geosyncline at 586 Ma: implications for a Cu ore forming fluid flux: Precambrian Research 106, 291–308.
| Crossref | GoogleScholarGoogle Scholar | CAS |
Houseman, G. A., Cull, J. P., Muir, P. M., and Paterson, H. L., 1989, Geothermal signatures and uranium ore deposits on the Stuart Shelf of South Australia: Geophysics 54, 158–170.
| Crossref | GoogleScholarGoogle Scholar |
Matthews, C. G., and Beardsmore, G. R., 2007, New heat flow data from south-eastern South Australia: Exploration Geophysics 38, 260–269.
| Crossref | GoogleScholarGoogle Scholar |
Neumann, N., Sandiford, M., and Foden, J., 2000, Regional geochemistry and continental heat flow; implications for the origin of the South Australian heat flow anomaly: Earth and Planetary Science Letters 183, 107–120.
| Crossref | GoogleScholarGoogle Scholar | CAS |
Pollack, H. N., Hurter, S. J., and Johnson, J. R., 1993, Heat flow from the Earth’s interior: Analysis of the global data set: Reviews of Geophysics 31, 267–280.
| Crossref | GoogleScholarGoogle Scholar |
Preiss, W. V., 2000, The Adelaide Geosyncline of South Australia and its significance in Neoproterozoic continental reconstruction: Precambrian Research 100, 21–63.
| Crossref | GoogleScholarGoogle Scholar | CAS |
Roy, R. F., Blackwell, D. D., and Birch, F., 1968, Heat generation of plutonic rocks and continental heat-flow provinces: Earth and Planetary Science Letters 5, 1–12.
| Crossref | GoogleScholarGoogle Scholar |
Appendix 1
Modelling of thermal gradient and thermal conductivity data for the purpose of estimating heat flow in the wells from this study.
Modelled versus measured thermal gradient in well Balrog 1. The partitioned line on the left hand graph shows a modelled gradient from a conductive heat flow 110 mW/m2 and thermal conductivities measured every 7 m, with the solid line being the measured geotherm in the well. The right hand graph shows the full geotherm in the well with the modelled geotherm overlain.
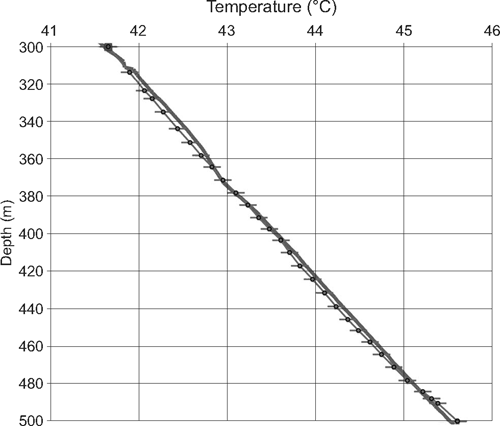
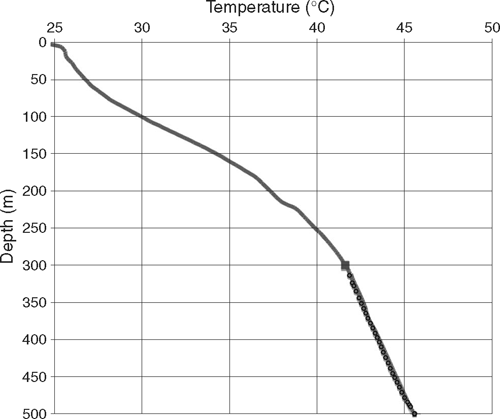
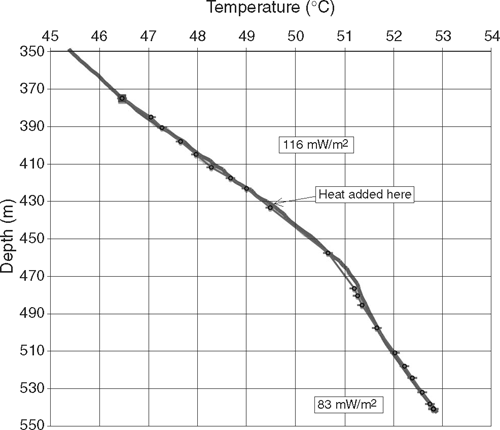
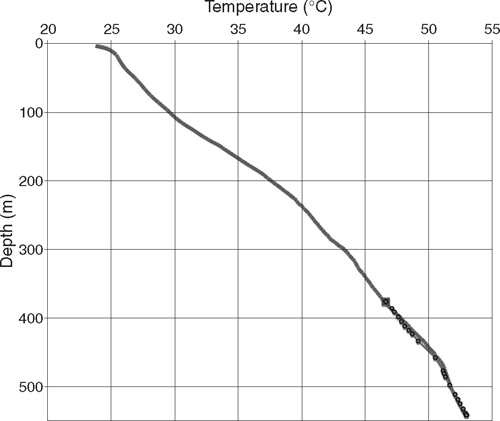
Modelled versus measured thermal gradient in well Gandalf 1. The partitioned line on the right hand graph shows a modelled gradient from a conductive heat flow of 95 mW/m2 and thermal conductivities measured every 7 m, with the solid line being the measured geotherm in the well. Gandalf 1 displayed a departure from the conductive heat flow inversion model. The best fit conductive model can be found by applying a heat flow of 116 mW/m2 in the interval 375–433 m depth, and 83 mW/m2 in the interval 433–545 m. The left hand graph shows the alternative interpretation where heat is added by advection at ~430 m depth.
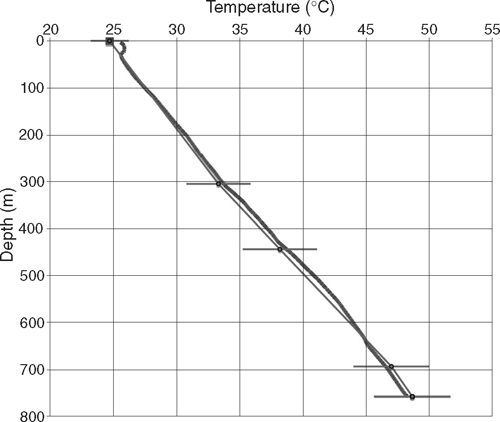
Modelled versus measured thermal gradient in well Edeowie 1. The partitioned line shows a modelled gradient from a conductive heat flow 74 mW/m2 and thermal conductivities measured on available core samples, with the solid line being the measured geotherm in the well.
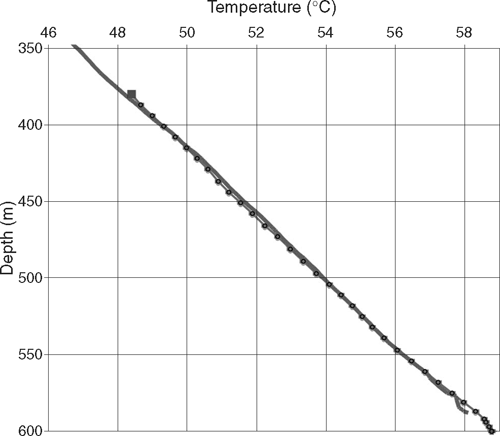
Modelled versus measured thermal gradient in well Nazgul 1. The partitioned line on the left hand graph shows a modelled gradient from a conductive heat flow 120 mW/m2 and thermal conductivities measured every 7 m, with the solid line being the measured geotherm in the well. The right hand graph shows the full geotherm in the well with the modelled geotherm overlain.
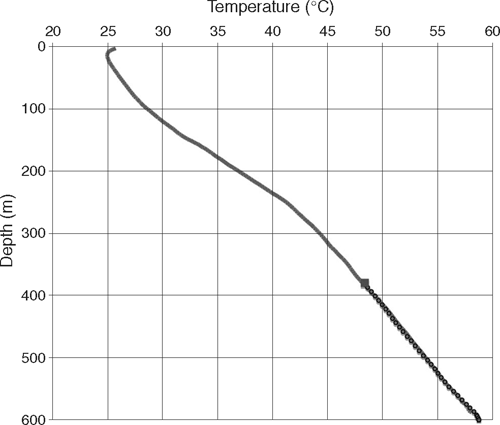
Modelled versus measured thermal gradient in well Sauron 1. The partitioned line shows a modelled gradient from a conductive heat flow 120 mW/m2 and equivalent modelled thermal conductivity profile as that in Nazgul 1, with the solid line being the measured geotherm in the well.
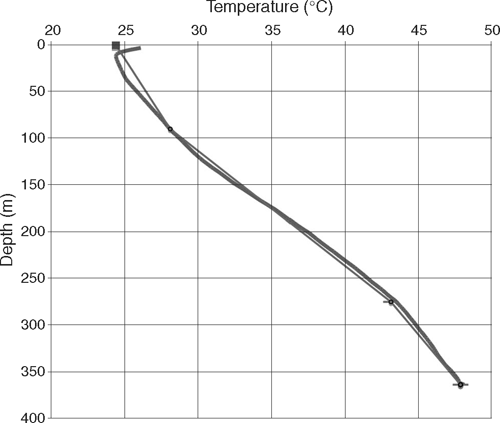
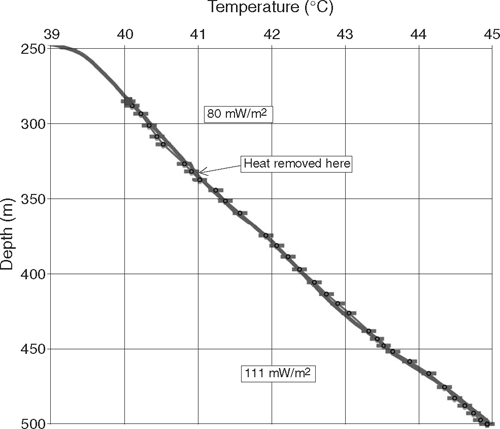
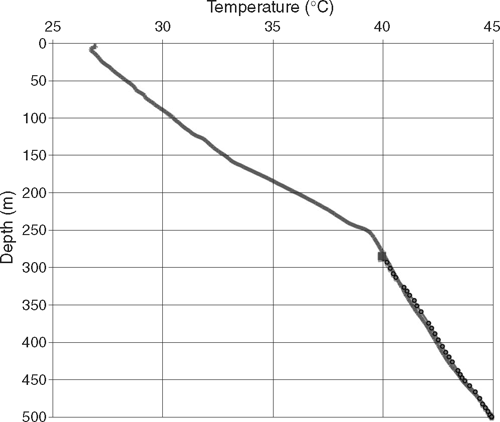
Modelled versus measured thermal gradient in well Gollum 1. The partitioned line on the right hand graph shows a modelled gradient from a conductive heat flow of 106 mW/m2 and thermal conductivities measured every 7 m, with the solid line being the measured geotherm in the well. Gollum 1 displayed a departure from the conductive heat flow inversion model. The best fit conductive model can be found by applying a heat flow of 80 mW/m2 in the interval 250–340 m depth, and 111 mW/m2 in the interval 340–500 m. The left hand graph shows this alternative interpretation where heat is removed by advection at ~340 m depth.
