

Prospects for improving savanna biophysical models by using multiple-constraints model-data assimilation methods
Damian J. Barrett A B I , Michael J. Hill B C , Lindsay B. Hutley D E , Jason Beringer E F , Johnny H. Xu A B , Garry D. Cook E H , John O. Carter B G and Richard J. Williams E HA CSIRO Land and Water, GPO Box 1666, Canberra, ACT 2601, Australia.
B Cooperative Research Centre for Greenhouse Accounting, GPO Box 475, Canberra, ACT 2601, Australia.
C Bureau of Rural Sciences, PO Box 858, Canberra, ACT 2601, Australia.
D Faculty of Education, Health and Science, Charles Darwin University, Darwin, NT 0909, Australia.
E Cooperative Research Centre for Tropical Savanna Management, Charles Darwin University, Darwin, NT 0909, Australia.
F School of Geography and Environmental Science, Monash University, PO Box 11A, Clayton, Vic. 3800, Australia.
G Queensland Department of Natural Resource Management, Mines and Energy, GPO Box 2545, Brisbane, Qld 4001, Australia.
H CSIRO Sustainable Ecosystems, PMB 44 Winnellie, NT 0822, Australia.
I Corresponding author. Email: damian.barrett@csiro.au
Australian Journal of Botany 53(7) 689-714 https://doi.org/10.1071/BT04139
Submitted: 10 September 2004 Accepted: 6 May 2005 Published: 29 November 2005
Abstract
A ‘multiple-constraints’ model-data assimilation scheme using a diverse range of data types offers the prospect of improved predictions of carbon and water budgets at regional scales. Global savannas, occupying more than 12% of total land area, are an economically and ecologically important biome but are relatively poorly covered by observations. In Australia, savannas are particularly poorly sampled across their extent, despite their amenity to ground-based measurement (largely intact vegetation, low relief and accessible canopies). In this paper, we describe the theoretical and practical requirements of integrating three types of data (ground-based observations, measurements of CO2/H2O fluxes and remote-sensing data) into a terrestrial carbon, water and energy budget model by using simulated observations for a hypothetical site of given climatic and vegetation conditions. The simulated data mimic specific errors, biases and uncertainties inherent in real data. Retrieval of model parameters and initial conditions by the assimilation scheme, using only one data type, led to poor representation of modelled plant-canopy production and ecosystem respiration fluxes because of errors and bias inherent in the underlying data. By combining two or more types of data, parameter retrieval was improved; however, the full compliment of data types was necessary before all measurement errors and biases in data were minimised. This demonstration illustrates the potential of these techniques to improve the performance of ecosystem biophysical models by examining consistency among datasets and thereby reducing uncertainty in model parameters and predictions. Furthermore, by using existing available data, it is possible to design field campaigns with a specified network design for sampling to maximise uncertainty reduction, given available funding. Application of these techniques will not only help fill knowledge gaps in the carbon and water dynamics of savannas but will result in better information for decision support systems to solve natural-resource management problems in this biome worldwide.
Acknowledgments
The authors thank Ying Ping Wang and Stephen Roxburgh for helpful comments and suggestions on an earlier version of this manuscript and are grateful to Michael Raupach and Peter Rayner for important and stimulating discussions on the ideas contained herein. This work was funded by the Australian Government to the Cooperative Research Centre for Greenhouse Accounting, the Cooperative Research Centre for Tropical Savanna Management and by NASA’s Office of Earth Science Carbon Cycle Science research program.
Aires F,
Prigent C,
Rossow WB, Rothstein M
(2001) A new neural network approach including first guess for retrieval of atmospheric water vapour, cloud liquid water path, surface temperature and emissivities over land from satellite microwave observations. Journal of Geophysical Research 106(D14), 14887–14907.
| Crossref | GoogleScholarGoogle Scholar |
and Giering 2000 review the use of adjoints in parameter estimation, model sensitivity analysis and error analysis in meteorology and atmospheric physics.
The form that J may take will depend on the objective of the analysis (Fig. 2). A quadratic objective function is the most usual form (e.g. in the least-squares case) applied to either raw observations or some transformation of observations (e.g. log or power transformations). Alternatively, J may measure differences between model and observed statistical properties of the system such as averages, moments of frequency distributions, spectral characteristics or principal components. It may measure absolute deviations in situations where outliers must be de-emphasised (such as with noisy or sparse datasets having a few extreme values). The objective function may alternatively be formulated to emphasise some particular features of a time series (such as deviations in peak or baseline fluxes) by changing the averaging period over which observed variables are aggregated. In this way, the assimilation scheme can be used to match a model to specific processes operating at a time or space scale of interest.
The weights, λ i , applied to each of the partial objectives in Eqn 11 of the main text have a dual role. First, they are used to incorporate into the analysis information about the relative certainty among different data types. That is they trade-off poor-quality, biased or relatively error-prone data in favour of less noisy, higher-quality observations. To rationally determine λ i requires, first, that information exists on which of the various sources of data are most reliable and, second, that the information contained in each partial objective is commensurate (i.e. partial objectives are physically related in some way). Second, the weights may be used to scale variables expressed in units that reflect the physical system into units that have desirable properties for the determination of parameters (Gill et al. 2000). For example, where observations differ by more than an order of magnitude, the solution for x , a or x 0 will be dominated by the larger-magnitude observations and variation in the smaller-magnitude observations will have negligible effect on the optimisation unless these variables are scaled or normalised.
Prior knowledge on physical constants or constraints on parameter values can also be introduced to the assimilation scheme through the penalty function, J C (see Eqn 13 of main text). Penalty functions specify prior information on parameter values, boundary values for parameters and initial conditions and are required to assist parameter retrieval for ill-posed inverse problems (e.g. Combal et al. 2002). Penalty functions also reduce computational costs by preventing the algorithm from searching non-feasible regions of parameter space for x , a or x 0 or from contravening known physical laws. A survey of current techniques for using penalty functions as constraints in optimisation problems is provided by Coello Coello (2002).
Appendix 2. Auxiliary models of energy balance, canopy light interception and soil water balance
Energy balance
The surface energy balance of the savanna system for each cover type was calculated as
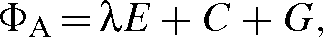
where λE is latent heat loss through evapotranspiration of water from the tree, grass or soil surfaces, C is the sensible heat flux from each cover type and G the storage of heat by soil. The energy available for evaporation from tree and grass canopies and the bare soil was (Raupach 2001)

where α is albedo, ΦS is downward shortwave radiation, ΦL is downward longwave radiation, σ the Stefan–Boltzmann constant (5.67 × 10⁻⁸ W m–2 °K–4), T k is surface temperature (°K) and ϵk is emissivity of the surface. Actual evapotranspiration followed the Priestley–Taylor formulation with a term, m, to limit transpiration as the soil dried
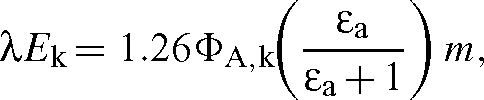
where ϵ a is the ratio of increase in latent heat to increase in sensible heat of saturated air. The moisture modifier, m, is a convex function and increases asymptotically to a maximum value of 1.0 based on the sensitivity of canopy conductance to relative soil moisture content, ω. The moisture limiting function has the form
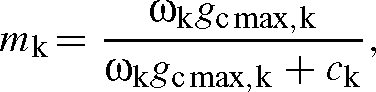
where gc max is the maximum surface conductance to water vapour for the kth cover class, and c k is a sensitivity parameter of canopy conductance to relative soil moisture content, ω (see Soil water balance below). The value of c k was chosen so that g c max was insensitive to ω, which allowed bare soil to dry quickly and then rapidly increase resistance to water vapour transfer to the atmosphere as ω approached zero. Canopy conductance of trees and grass was more sensitive to changes in ω near field capacity with resistance to water vapour transfer increasing steadily as soil dried.
The surface temperature of each cover type was obtained by rearranging the following sensible heat-flux equation:

where C p is the specific heat of air (1010 J kg–1 °K–1), ρa is the density of dry air (1.204 kg m–3) and T a is air temperature. We assumed that the canopy was well ventilated so that conductance to sensible heat for each cover type was approximated by the conductance to water vapour, i.e. g H = g c max.
Canopy light interception
Canopy leaf area index, Λ, of each cover type was an asymptotic function of the C mass of the fast-turnover pool:
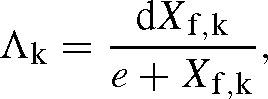
where X F is the C-mass density, d is a preset parameter which defines the upper limit of LAI for each variable and e is the value of X F at half maximum LAI. This form of the LAI function implies an increasing investment in carbon in structural material (e.g. petioles and fine twigs) as the leaf carbon pool increases. Radiation intercepted by the canopy in photosynthetic wavelengths followed a Beer’s law formulation as a function of LAI:
Error: Incorrect filename or format (Bt04139_E21.gif). Please check out
where the factor of 0.5 on the RHS converts energy in short-wave to PAR wavebands and the exponent of 0.5 is the ‘decay’ coefficient of light for a canopy with randomly distributed leaves (Russell et al. 1990).
Soil water balance
The soil moisture content under each cover class was calculated as a function of rainfall, evaporation and drainage terms. The soil moisture content (W, mm) for each vegetation type in the ith daily time step was

where P is daily precipitation (Appendix 3), E is actual evapotranspiration (mass units) and D is combined runoff and drainage. Drainage occurred when rainfall plus stored soil water less evapotranspiration exceeded maximum soil water storage capacity, W max. The daily drainage for each cover type was determined as

and relative soil moisture content available for plant uptake each day (unitless) was
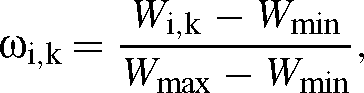
where W min is the minimum available plant water content of the soil (mm).
Appendix 3. Simulated driver data
Rainfall, air temperature, and downward short-wave and long-wave radiation data were calculated for each day over a 5-year period. Rainfall events were randomly distributed throughout the year, but with a periodic wet and dry season. Annual average rainfall was 600 mm per year and daily rainfall was calculated as
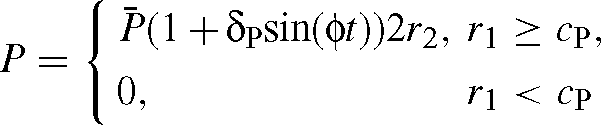
where P¯ is mean annual precipitation expressed on a daily basis (mm day–1), δP is the ratio of seasonal amplitude in rainfall to annual mean, φ is a frequency parameter (one cycle per year) and r i are independent uniform random numbers from U[0, 1]. The second term on the RHS determines the proportion of rain days per wet season by the number of times in which r exceeds the preset constant, c, between 0 and 1.
Air temperature and radiation also followed an annual periodic cycle but with temperature lagging radiation by 14 days. Day-to-day variation in temperature and radiation was added to each periodic cycle by using a (non-correlated) random term. The temperature and radiation drivers were calculated as
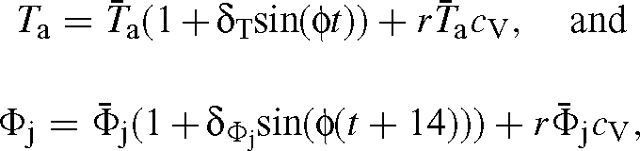
where c V is the coefficient of variation in day to day variation, T¯ is mean annual temperature, φ is mean annual irradiance (W m–2) for short-wave (j = S) or long-wave (j = L) downward radiation and r is defined above. Maximum and minimum average air temperature throughout the year ranged between 30 and 35°C, downward short-wave radiation varied between 277 and 241 W m–2 and downward long-wave radiation ranged from 407 to 425 W m–2. These values are typical for savannas of northern Australia around the middle of the rainfall gradient for this biome.
Appendix 4. Simulated observations
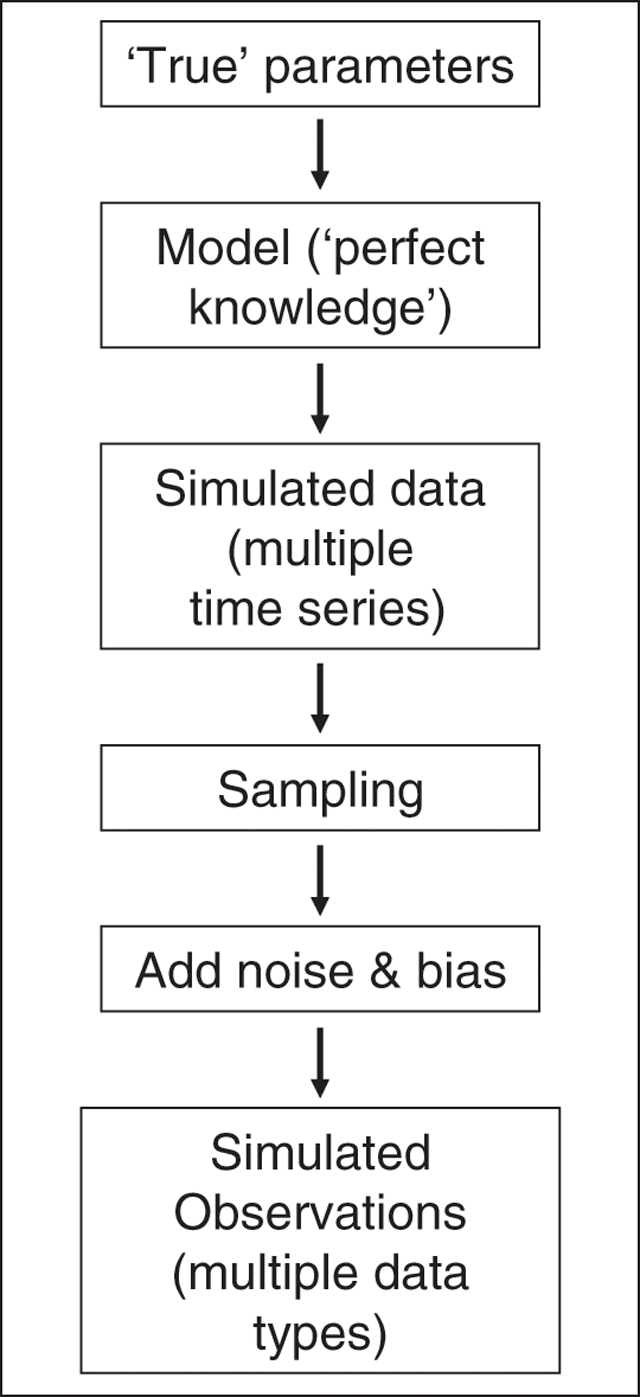
Because of the absence of any operational system for the coordinated collection of data in Australian savannas, it is not possible at present to demonstrate the application of model-data assimilation methods by using existing observations. To circumvent this problem, we simulated observations with appropriate errors and biases, using the methodology outlined in Fig. A4.1, with specifications as summarised in Table 4. These simulated observations were used in the assimilation scheme to retrieve model parameters and initial conditions. It should be noted that biases added in the simulation were constant in time when, in reality, they may vary (e.g. instrument drift).
To generate simulated observations, a representative set of ‘true’ parameters was established and used to simulate a time series of water, energy and carbon fluxes by using the model outlined in Appendix 2 and driver data from Appendix 3. Observations were generated by selecting points along the time series at predetermined frequencies and adding Gaussian noise on the basis of the relative magnitudes of observation measurement error from Raupach et al. (2005) as a guide (see Table 4). Each simulated observation, Y′, was calculated as
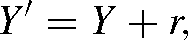
where Y is the simulated time series and r a random normal deviate from N(0, σ Y 2). The standard deviation, σ Y , was calculated as

where c V is the coefficient of variation of measurement error. Simulated observations of leaf area index, climate data, C-mass density, litterfall, soil respiration and eddy-flux observations were sampled ‘instantaneously’ (i.e. no averaging period); whereas simulated NDVI and brightness temperature were processed as maximum value composites based on a threshold cloud detection algorithm. Note that soil respiration ‘observations’ were drawn only from the second term on the RHS of Eqn 6 (main text), simulating measurements taken at the soil surface without including respired CO2 from litter and above-ground biomass components. ‘Cloud’ was added to raw simulated remote-sensing NDVI and brightness-temperature data (ν and ΦB) by randomly selecting days in the time series and reducing the value of ν and ΦB by an equivalent proportion. Then measurement error was added, as above. The remote-sensing observations used in the assimilation were extracted from the raw data by using a maximum value compositing algorithm to recover the underlying NDVI and brightness temperature and to attempt to eliminate the simulated cloud contamination (but note that the algorithm itself also adds bias into the observation of canopy greenness or surface temperature). The maximum value compositing algorithm selected the maximum NDVI of all observations over a 10-day period, and this value was regarded as the cloud-free value for ‘greenness’ of the vegetation canopy. On the day of maximum NDVI, the value of ΦB was also selected as the cloud-free land-surface brightness temperature. This approach mimics the essential features of satellite observation of reflectances in visible and thermal wavebands by sensors such as MODIS, AVHRR and SPOT-VEGETATION and their subsequent processing into NDVI, land-surface temperature and soil-moisture products (e.g James and Kalluri 1994; Wagner et al. 1999), but does not consider other artefacts such as change in time of satellite overpass, seasonal variation in sun zenith angle or atmospheric water-vapour concentration which introduce further biases into observations. Omitting these effects here is not important for demonstrating the model-data assimilation method. Simulated soil-moisture index was calculated as an average per month and flux-tower observations were obtained during a single campaign comprising daily aggregated fluxes for a single year.
|