

The efficient price: an opportunity for funding reform
Jonathan Karnon A G , David I. Ben-Tovim B , Clarabelle T. Pham A , Orla Caffrey C , Paul H. Hakendorf B , Maria Crotty D and Paddy A. Phillips E FA University of Adelaide, Discipline of Public Health, University of Adelaide, Adelaide, SA 5005, Australia. Email: clarabelle.pham@adelaide.edu.au
B Flinders Medical Centre, Adelaide Health Service and Flinders University, Flinders Medical Centre, Bedford Park, SA 5042, Australia. Email: david.ben-tovim@health.sa.gov.au; paul.hakendorf@health.sa.gov.au
C University of Birmingham, Health Economics Unit, College of Medical and Dental Sciences, Edgbaston, Birmingham, B15 2TT, UK. Email: o.caffrey@bham.ac.uk
D Flinders University, Repatriation General Hospital, Daws Road, Daw Park, SA 5041, Australia. Email: maria.crotty@health.sa.gov.au
E SA Health, Adelaide, SA 5000, Australia. Email: paddy.phillips@health.sa.gov.au
F Department of Medicine, Flinders University, Hindmarsh Square, Bedford Park, SA 5042, Australia.
G Corresponding author. Email: jonathan.karnon@adelaide.edu.au
Australian Health Review 35(4) 501-506 https://doi.org/10.1071/AH10966
Submitted: 8 September 2010 Accepted: 17 March 2011 Published: 9 November 2011
Journal Compilation © AHHA 2011
Abstract
Objective. Proposed Australian healthcare reforms describe a move towards partial Commonwealth funding of public hospitals, whereby hospitals will be paid an ‘efficient price’ for each separation, incorporating both the costs and benefits of services. This paper describes a potential approach to setting the efficient price using risk adjusted cost-effectiveness (RAC-E) analysis.
Methods. RAC-E analysis uses a decision analytic framework to estimate lifetime costs and survival for individual patients, which are standardised by comparing observed and expected values. Analysis of standardised costs and effects at different hospitals identifies efficient hospitals, from which efficient prices can be defined.
Results. A RAC-E analysis of services for stroke patients at the four main public hospitals in South Australia demonstrates the need to account for costs and benefits in identifying efficient hospitals. The hospital with the best patient outcomes incurred additional costs relative to less effective hospitals. If an investment of AU$14 760 to gain an additional life year in stroke patients is deemed to be a cost-effective use of resources, then the most effective hospital is also the most efficient hospital.
Conclusions. The applied RAC-E analysis demonstrates a framework for comparing the economic efficiency of care provided at different hospitals, which provides a basis for defining the efficient price and appropriate funding incentives to achieve better patient outcomes.
What is known about the topic? The efficient price is a recently introduced concept used in the context of the recent healthcare reforms produced by the Australian government. The stated objective in setting nationally efficient prices for public hospital services is to ‘strike an appropriate balance between reasonable access, clinical safety, efficiency and fiscal considerations’. There has been no explicit discussion to date about specific processes for estimating the efficient price.
What does this paper add? This paper introduces risk adjusted cost-effectiveness (RAC-E) analysis as a framework for identifying hospitals that achieve the best balance between costs and outcomes in the provision of services for specific diagnostic groups, and hence provides the basis for estimating efficient prices.
What are the implications for practitioners? The efficient price will determine a significant proportion of funding for public hospitals. Practitioners need to be aware of the rationale and potential consequences of the efficient price, and to be sure that the method used to estimate the efficient price is robust and transparent.
Introduction
In the redesigned health system currently proposed by the Commonwealth government and agreed in outline at the Council of Australian Governments (COAG) meeting in April 2010,1 the concept of an efficient price for each patient separation looms large. It is proposed that funding for hospital care moves to an activity basis, where funds received by local hospital networks will be the sum of the price paid for each patient separation. As the COAG communiqué states ‘Local Hospital Networks will be paid on the basis of a national efficient price for each public hospital service they provide to public patients under Local Hospital Network Service Agreements with the States [and Territories]’. With the re-affirmation of these principles following a further round of discussions between the Commonwealth and State and Territory governments, it seems likely that these reforms will proceed, and the issue of what constitutes an ‘efficient price’ for a service will become a matter of considerable interest.
Australia has invested heavily in the creation of the current Casemix system,2,3 and is continuing to do so.4 In the current Australian healthcare Casemix system, efficiency equates to the average cost of production of usual or current practice for any one particular Diagnostic Related Group. In economics, efficiency requires consideration of both the costs and benefits of a particular process or action. As an example, if the average costs for condition X are $5000 per separation in Hospital A, and $7000 in Hospital B, economics requires us to consider not only the price difference, but whether the more expensive care results in better health outcomes for patients treated at Hospital B, and whether the quantum of health benefit gained is worth the extra investment? To date, architects of Casemix systems have not attempted to introduce an independent measure of health outcomes into the Casemix funding system.
This paper introduces the concept of risk adjusted cost-effectiveness (RAC-E) as a framework for identifying hospitals that achieve the best balance between costs and outcomes (health gains) in the provision of services for specific diagnostic groups. RAC-E provides a methodology for moving towards estimating efficient prices, where the concept of efficiency takes investment in better health outcomes into account.
RAC-E uses the increasing availability of linked, routinely collected data to inform the long-term costs and benefits of services provided at different hospitals. This paper describes the data requirements and analytical framework for the general RAC-E methodology, followed by a discussion of the relevance of RAC-E as a tool for informing the efficient price. The methodology is illustrated with reference to an applied RAC-E analysis, which compared lifetime costs and survival for patients admitted to the four main public hospitals in South Australia with a diagnosis of stroke, in the year to 30 June 2006.
Data requirements
The minimum data requirement for the RAC-E method is a dataset containing linked hospital separations data and population mortality records. The applied stroke analysis briefly presented here used routinely collected hospital separations data (via the Integrated South Australian Activity Collection), patient-based separation cost data submitted to the National costing study, and mortality data from the Register for Births, Deaths and Marriages. Census-derived Socioeconomic Indices for Areas variables were mapped to individual records on the basis of recorded postcode.
Methods
There are two broad analytical stages in the RAC-E methodology. The first stage involves the estimation of long-term costs and outcomes for each separated patient with the diagnosis of interest. A decision analytic framework is used, whereby lifetime costs and survival are extrapolated from a set of observed intermediate endpoints.
Fig. 1 describes the analytical framework in the form of a decision tree. On the right-hand side of the tree, observed intermediate endpoints (hospital admission for a non-fatal recurrent stroke event, hospital admission for a non-fatal major cardiac diagnosis, or no related event), or death with no prior event, over a 2-year observation period from the time of the index stroke event are defined for individual patients. Regression models were fitted to separate datasets created for each intermediate endpoint to predict long-term survival and associated costs for each patient, controlling for the effects of patient (e.g. age, sex, co-morbidities, socioeconomic status) and disease (e.g. stroke severity) characteristics.

|
The resulting estimates of lifetime costs and survival for all patients were then standardised by fitting regression models that predicted expected values of these parameters for all patients, and subtracting the expected values from the observed values. Summing standardised costs and survival across hospital populations of eligible patients informs mean estimates, which can be analysed to estimate the incremental cost-effectiveness of services provided for stroke patients at different hospitals.
Differences in the ‘observed minus expected’ cost and survival estimates between hospitals can be interpreted as risk-adjusted differences in costs and survival: if costs incurred by patients at Hospital A are $300 more than expected, whereas costs incurred by patients at Hospital B are $200 less than expected, then the risk-adjusted difference in per patient costs between Hospitals A and B is $500. By also examining the risk-adjusted survival estimates of both hospitals, the extent to which the cost differences represent investments in better outcomes can be examined.
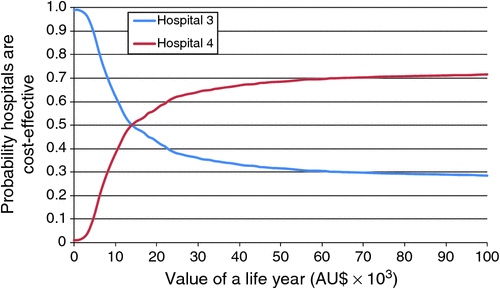
A comprehensive sensitivity analysis involved a multistage bootstrapping (sampling with replacement) approach, which generates distributions of the observed minus expected costs and survival estimates across the four hospitals. These data inform confidence intervals around the cost-effectiveness results and cost-effectiveness acceptability curves.5 In the RAC-E context, acceptability curves present the probabilities that each hospital is the efficient hospital at different monetary thresholds. The thresholds represent the monetary value associated with additional survival.
Results
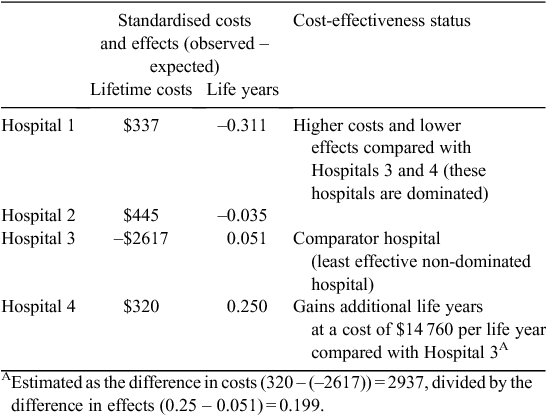
Table 1 presents the mean results for the stroke analyses. The hospitals are ordered in increasing magnitude of standardised effects (e.g. Hospital 4 is the most effective hospital). The standardised long-term costs of care for patients treated at Hospitals 1 and 2 are greater than those incurred by patients treated at Hospitals 3 and 4. Moreover, these hospitals also produce lower standardised health gains than the other two hospitals. By whatever criteria of efficiency is chosen, Hospitals 1 and 2 are clearly the most inefficient of the four hospitals.
|
Patients treated at Hospital 3 incurred costs well below the expected cost, and gained more life years than would be expected if treatment effect was the same across all hospitals. Costs of care at Hospital 4 are also higher than would be expected for the casemix of patients treated, but this hospital produces the largest standardised health gains. On average, patients treated at Hospital 4 gain an additional 0.199 life years relative to patients treated at Hospital 3.
The identification of the most efficient of Hospitals 3 and 4 depends on how efficiency is defined. The additional cost required to gain an additional life year by treating a patient at the more effective, but more costly Hospital 4, compared with Hospital 3 is $14 760. So, if $14 760 to gain an additional life year in stroke patients is deemed to be a cost-effective use of resources, Hospital 4 seems to be the most efficient hospital, otherwise Hospital 3 is more efficient.
Fig. 2 presents the cost-effectiveness acceptability curves for the stroke RAC-E analysis, which considers Hospitals 3 and 4. If we are willing to invest $50 000 to gain an additional year of life in stroke patients, then there is a 70% probability that Hospital 4 is the efficient hospital.
|
Discussion
The current Casemix system (AR-DRG 10) can be considered as a language system whose terms bring together diagnostic and resource utilisation elements. Likes its predecessors, the AR-DRG 10 aggregates related clinical conditions into purportedly iso-resource groups (Diagnostic Related Groups). That is, clinically meaningful groups of conditions or procedures whose resource utilisation is approximately similar. National and State and Territory costing studies identify the costs of providing care for each DRG group across hospitals.
A pricing authority could use some function of the observed costs of providing services (e.g. the average) as the basis of an efficient price. Hospitals that provide care at or below that price will be deemed efficient, hospitals that exceed that price will be deemed inefficient. Inefficient hospitals have an incentive to reduce costs because they are receiving fewer funds per separation than they are spending.
This is essentially how the current Casemix system operates. The underlying assumption is that when a clinical innovation occurs that improves clinical outcomes (or not, as the case may be), the Casemix system will self correct. Annual costing studies will identify changes to costs of care, which will then be appropriately reflected in an adjusted casemix price.
There are two key problems with this system. First, in cases where clinical innovation is more costly, but is also cost-effective (i.e. the additional benefits are worth the investment of additional cost), there are perverse incentives regarding the uptake the new technologies. Early adopters receive funds based on the costs of providing the old model of care, which are unlikely to cover the costs of providing the new form of care. Over the longer term increased costs will only be met if there is widespread adoption of the new model of care. However, hospitals that previously produced care at above average cost will become less ‘inefficient’ (where efficiency is defined only with respect to costs) as the early adopters push the reimbursement level up. Under a definition of efficiency that accounts for costs and benefits, the non-early adopters are likely becoming more inefficient because the early adopters are improving outcomes at a cost-effective rate.
Using RAC-E to define the efficient price(s)
The restricted nature of the Casemix system has been recognised in the government report that preceded the COAG negotiation,6 which states that ‘[i]n setting the nationally efficient price [for every public hospital service], the umpire will be required to strike an appropriate balance between reasonable access, clinical safety, efficiency and fiscal considerations’ [p. 70]. RAC-E provides the basis of an approach that could account for all four of these factors. Using a decision analytic framework, RAC-E facilitates the identification of all important differences in costs (fiscal considerations) and benefits between hospitals,7 while controlling for relevant differences in the characteristics of the patients treated at different hospitals. The benefits side of the equation captures differences in outcome, including safety effects (e.g. adverse events) and the effectiveness of treatment.
Before discussing how reasonable or equitable access might be addressed, it is useful to consider how the RAC-E outputs might be analysed to estimate the efficient price. Given estimates of standardised costs and benefits at each included hospital, a crude approach would be to list the hospitals in increasing order of standardised effectiveness, exclude dominated hospitals, and estimate the incremental cost-effectiveness ratio (ICER) between each hospital (as represented in Table 1). Given a threshold monetary value for the measure of effect,A the efficient hospital is defined as the hospital with the largest ICER that is closest to the threshold value. The efficient price is then estimated as the cost of providing services at the efficient hospital.
Several issues arise that preclude the application of this crude approach. First, there may be unmodifiable determinants of inefficiency, which are factors that affect hospitals’ ability to provide services at the crude efficient price that are beyond their control. Such determinants may be defined at a hospital level or a patient level. Second, there will likely be significant uncertainty around the identification of a single efficient hospital.
Potential hospital-level unmodifiable determinants of inefficiency include variables such as hospital size, teaching status, geographical location, etc. Such variables would need to be included as covariates in the estimation of RAC-E, which would hence identify significant and important unmodifiable hospital-level determinants of inefficiency. Separate efficient prices could be specified for different categories of hospital, as defined by significant determinants of inefficiency.
Coming back to the handling of equitable access via the setting of the efficient price, the identification of unmodifiable hospital-level determinants of inefficiency provides an explicit process for incorporating equity into the process. Such factors may lead to the specification of a higher (secondary) efficient price for hospitals that are unable to achieve the primary efficient price, which may be viewed as the ‘equity premium’ (i.e. the additional amount we are willing to pay in order to achieve an equitable allocation of resources). If the equity premium is judged to be too high, then this may lead to a rationalisation of service delivery, whereby the provision of certain services is restricted to centres that are able to achieve the primary efficient price.
Patient-level factors are important if alternative pathways of care are efficient for different patient groups within the overall diagnostic group being assessed (e.g. stroke). The current Casemix system defines separate DRGs on the basis of age or the presence of general complications or co-morbidities. Reported RAC-E analyses have tested the significance of age, sex and disease severity (as defined by the presence of general complications or co-morbidities), as well as socioeconomic status and more specific measures of co-morbidity (e.g. presence of diabetes, renal impairment, dementia, etc.). However, it is not practicable to define efficient prices for a wide range of alternative patient groups (e.g. men, aged 50 to 60 years, with diabetes and dementia, etc.). One option is to combine the handling of patient-level factors with the handling of uncertainty. This involves analysis of separation costs at a subset of efficient hospitals in order to quantify the effect of patient-level factors on the costs of providing efficient hospital services.
One approach to identifying an efficient set of hospitals would be to compare all hospitals to the base case efficient hospital. Hospitals would be included in the efficient set if the upper 95% confidence limit of the incremental net benefits between the hospital of interest and the base case efficient hospital was positive, i.e. there was a significant probability that the hospital of interest was more efficient than the base case efficient hospital.B
Having identified an efficient set of hospitals, regression analyses can be undertaken to predict separation costs as a function of patient-level factors. The resulting model predictions can be used as estimates of the efficient price for different combinations of patient-level factors.
Helping inefficient hospitals become efficient
An alternative approach to defining the efficient price might be to define a literature-driven care pathway for different diagnoses, to which resource requirements and associated unit costs are attached. Similar to the process used to develop clinical guidelines. However, clinical guidelines, at best, reflect the cost-effectiveness of individual components of the defined pathway, usually based on studies conducted under controlled conditions (e.g. clinical trials).
An advantage of using RAC-E to identify efficient hospitals is that it provides an empirical basis for defining efficient practice. The empirical approach reflects the translation of evidence into practice, representing the cost-effectiveness of the full care pathway. It is the case that RAC-E reflects relative, rather than absolute efficiency, but given an eligible population of over 700 public acute hospitals it is likely that there is significant potential to improve efficiency via the dissemination of best practice.
Empirical analyses of comparative performance, whether publicly stated or not, should also provide a stronger incentive to act than a theory driven approach. In particular, because the guidelines approach provides no basis for the comparison of outcomes, it provides no incentives for inefficient hospitals that are less effective, but also less costly, to invest in order to improve outcomes.
Inefficient hospitals should be supported in their attempts to improve their performance, and so a corollary to RAC-E is further analysis and investigation of modifiable determinants of inefficiency.
Conclusion
The debate over what constitutes an efficient price for the healthcare activity of a national hospital network has only just begun. The task for the Government (via the National Pricing Authority) is to identify opportunities to use the pricing system to encourage hospitals to invest in healthcare that delivers better outcomes, and to avoid allowing a pricing system to simply maintain the status quo and deter innovation. Hard work, but not impossible work, and work that builds on the substantial investment Australia has already made in the development of its Casemix system, and the availability of a National hospital morbidity data collection and the National costing studies.
Competing interests
None of the authors have any known conflicts of interests with respect to the material contained in the submitted manuscript.
Acknowledgements
This research was funded by a Strategic Health Research Program grant by SA Health. We are grateful to staff at SA Health who provided the data, and assisted with the data linkage: Paul Basso, Phil Batista, Deb Brown, Kym Piper, Graeme Tucker and Ann-Marie Twisk.
References
[1] Council of Australian Governments Meeting 19–20 April 2010, Canberra Communiqué. COAG; 2010. Available at http://www.coag.gov.au/coag_meeting_outcomes/2010-04-19/docs/communique_20_April_2010.pdf [verified 1 November 2011].[2] Duckett SJ. Casemix funding for acute hospital inpatient services in Australia. Med J Aust 1998; 169 S17–21.
[3] Duckett SJ. The development of Australian refined diagnosis related groups: the Australian inpatient casemix classification. Casemix Quarterly 2000; 2 115–20.
[4] PricewaterhouseCoopers, The review of the AR-DRG classification system development process. Department of Health and Ageing; 2009. Available at http://www.health.gov.au/internet/main/publishing.nsf/Content/Casemix-1/$File/Final_Report_November_2009.pdf [verified 19 October 2011].
[5] van Hout BA, Al M, Gordon GS, Rutten FFH. Costs, effects and C/E-ratios alongside a clinical trial. Health Econ 1994; 3 309–19.
| Costs, effects and C/E-ratios alongside a clinical trial.Crossref | GoogleScholarGoogle Scholar | 1:STN:280:DyaK2M7ivVelsg%3D%3D&md5=8aa74bf1dc0fd104ec7759d2b63f5ec1CAS |
[6] A national health and hospitals network for Australia’s future: delivering the reforms. Canberra: Commonwealth of Australia; 2010. Available at http://www.yourhealth.gov.au/internet/yourHealth/publishing.nsf/Content/DeliveringTheReforms/$FILE/DeliveringTheReforms.pdf [verified 19 October 2011].
[7] Karnon J, Brennan A, Akehurst RL. Decision modeling to inform decision making: seeing the wood for the trees. Med Decis Making 2010; 30 E20–2.
| Decision modeling to inform decision making: seeing the wood for the trees.Crossref | GoogleScholarGoogle Scholar |
[8] Sendi P, Gafni A, Birch S. Ethical economics and cost-effectiveness analysis: is it ethical to ignore opportunity costs. Working Paper 02–05. Basel, Switzerland: Basel Institute for Clinical Epidemiology; 2005. Available at http://www.ceb-institute.org/uploads/media/WP-02-05.pdf [verified 19 October 2011].
A The derivation of the monetary threshold value is an important, but complex issue that is beyond the scope of this paper. See Sendi et al. for a good summary of the issues.8
B Incremental net benefits for Hospital i relative to the base case efficient hospital (Hospital e) are defined as (Costsi – Costse) + λ(Effectsi – Effectse), where λ represents the monetary value of a unit of effect.