

Revenue effects of practice nurse-led care for chronic diseases
Richard A. Iles A , Diann S. Eley B I , Desley G. Hegney C D , Elizabeth Patterson E , Jacqui Young F , Christopher Del Mar G , Robyn Synnott B and Paul A. Scuffham HA School of Accounting, Finance and Economics, Griffith University, 170 Kessels Road, Nathan, Qld 4111, Australia. Email: r.iles@griffith.edu.au
B School of Medicine, The University of Queensland, 288 Herston Road, Brisbane, Qld 4006, Australia. Email: r.synnott@uq.edu.au
C Curtin University, School of Nursing and Midwifery, GPO Box U1987, Perth, WA 6845, Australia. Email: Desley.Hegney@curtin.edu.au
D Sir Charles Gairdner Hospital, Perth, WA 6845, Australia.
E Department of Nursing, School of Health Sciences, The University of Melbourne, Room 606, Level 6, Allan Gilbert Building, 161 Barry Street, Melbourne, Vic. 3010, Australia. Email: elizabeth.patterson@unimelb.edu.au
F School of Nursing and Midwifery, The University of Queensland, Herston, Qld 4111, Australia. Email: jacqui.young@uq.edu.au
G Centre for Research in Evidence Based Practice, Faculty of Health Sciences and Medicine, Bond University, Gold Coast, Qld 4229, Australia. Email: cdelmar@bond.edu.au
H Centre for Applied Health Economics, School of Medicine & Population and Social Health Research Program, Griffith Health Institute, Griffith University, Nathan, Qld 4111, Australia. Email: p.scuffham@griffith.edu.au
I Corresponding author. Email: d.eley@uq.edu.au
Australian Health Review 38(4) 363-369 https://doi.org/10.1071/AH13171
Submitted: 11 September 2013 Accepted: 11 April 2014 Published: 8 July 2014
Journal Compilation © AHHA 2014
Abstract
Objective To determine the economic feasibility in Australian general practices of using a practice nurse (PN)-led care model of chronic disease management.
Methods A cost-analysis of item numbers from the Medicare Benefit Schedule (MBS) was performed in three Australian general practices, one urban, one regional and one rural. Patients (n =254; >18 years of age) with chronic conditions (type 2 diabetes, hypertension, ischaemic heart disease) but without unstable or major health problems were randomised into usual general practitioner (GP) or PN-led care for management of their condition over a period of 12 months. After the 12-month intervention, total MBS item charges were evaluated for patients managed for their stable chronic condition by usual GP or PN-led care. Zero-skewness log transformation was applied to cost data and log-linear regression analysis was undertaken.
Results There was an estimated A$129 mean increase in total MBS item charges over a 1-year period (controlled for age, self-reported quality of life and geographic location of practice) associated with PN-led care. The frequency of GP and PN visits varied markedly according to the chronic disease.
Conclusions Medicare reimbursements provided sufficient funding for general practices to employ PNs within limits of workloads before the new Practice Nurse Incentive Program was introduced in July 2012.
What is known about the topic? The integration of practice nurses (PN) into the Australian health system is limited compared with the UK and other parts of Europe. There are known patient benefits of PNs collaborating with general practitioners, especially in chronic disease management, but the benefits from a financial perspective are less clear.
What does this paper add? The cost-analysis of a PN-led model of chronic disease management in Australian general practice is reported, providing an indication of the financial impact of using PNs in primary healthcare.
What are the implications for practitioners? Taking into account general practice and individual PN workloads, sufficient funding for employment of PNs is provided by Medicare reimbursements.
Introduction
Practice nurses (PN) are a valued part of primary health care delivery in several health systems internationally. Their integration into the health systems in the UK and other parts of Europe is well developed,1–3 but remains limited in Australia. However, the Australian Government’s Practice Nurse Incentive Program (PNIP), launched in 2012, is a recent initiative aimed at scaling up the role of PNs within the primary health setting.4
There are known benefits of PNs collaborating with general practitioners (GPs),1,5–9 including high levels of patient satisfaction, effective care coordination with GPs and enhanced communication to assist patients to take greater responsibility in managing chronic diseases.5–7 However, from a financial perspective, the benefits of PNs for general practices are less clear. In the UK, costs of substituting cheaper PN consultations instead of sessions with a GP are offset by PNs having longer consultations, carrying out more tests and requesting more follow-up visits.8,9 Medicare Australia introduced payments for services undertaken by a PN on behalf of a medical practitioner, such as payment for PNs to undertake chronic disease management on 1 November 2007.10 In 2012, when the PNIP was introduced, many of these Medicare Benefit Schedule (MBS) item numbers were replaced by block funding for nursing services. However, the item number for chronic disease management remains.
The financial impact of using PNs in primary healthcare has not been analysed previously within the Australian Medicare system. This article presents an economic feasibility analysis for a PN-led model of chronic disease management in Australian general practice.5,11 We develop a business case based on the total MBS item charges for patients who were managed for their stable chronic disease by usual GP- or PN-led care, with the aim of assessing whether the use of PNs can generate sufficient income via the MBS to be viable in place of GP-led care. Because of the variability in charges to patients by GPs and co-payments across general practices, we restricted our focus to MBS fees only.
Methods
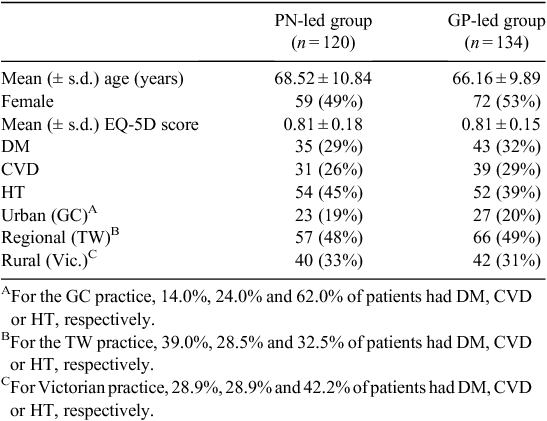
A cost-analysis of item numbers from the MBS was undertaken from the perspective of costs to Medicare Australia using data from participants in a comprehensive study (between 2008 and 2009) that investigated the feasibility, acceptability and cost-effectiveness of nurse-led management of chronic disease in a general practice setting.11 A sample of 254 patients was recruited from three Australian general practices: an urban (Gold Coast; GC) and regional (Toowoomba; TW) practice in Queensland, and a rural practice in Victoria. Practices were purposively selected by employment of a PN, level of computerisation and diversity of geographical and patient population. Patients with one or more stable chronic diseases of type 2 diabetes mellitus (DM), ischaemic heart disease (cardiovascular disease; CVD) and hypertension (HT) were recruited from these practices. Patients so classified at an initial GP assessment were randomly allocated to either PN- or GP-led (i.e. usual practice) care. Further details of patient recruitment, randomised allocation of patients to treatment group and methods of data collection have been reported previously.11 There were two PNs and one to four GPs involved at each practice in the study over the 2-year period. All PNs in the study were registered nurses working within their scope of practice where the PN, rather than working under the direct supervision of the GP, worked from protocols in a collaborative practice model. If patients in the PN-led care group became unstable, they could be referred back to GP care until their disease stabilised and then return to PN-led care.
The frequency of GP and PN visits, MBS item numbers and clinical and demographic characteristics were captured for each patient from the electronic records 12 months before entering the study (pre-intervention) and 12 months after (intervention). Additional data were obtained by patient questionnaires at baseline (pre-intervention) and at 2 years, including quality of life measured using the EuroQol 5-Dimensions (EQ-5D-3L), scored with the Australian algorithm.12 The EQ-5D-3L measures health status and assigns valuations for 243 health states. Full health is scored as 1.0 and dead as 0.0; for severe states of suffering it is possible to have health states worse than death. All MBS item numbers were mapped to the November 2009 MBS13 and all charges are reported in 2009 Australian dollars. Ethics approval for the study was obtained from relevant ethics committees.
Statistical analysis
To test the effect of GP- and PN-led care on total MBS charges per patient, a log-linear regression model was used with the inclusion of dummy variables for pre-intervention and for the GP and/or PN group, as well as accounting for several covariates. The distribution of total MBS charges was highly non-normal in respect to both skewness and kurtosis, and data were transformed using a zero-skewness log transformation.14–17 The Kolmogorov–Smirnov standardised test on the transformed zero-skewed total MBS item charge indicated normality (P = 0.85).
Two models are estimated using an ordinary least-squares (OLS) estimator. The first used the full pooled sample and is represented by Eqn (1):
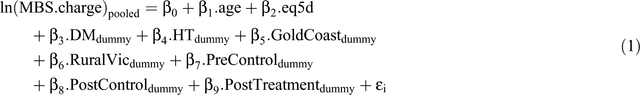
where eq5d represents the EQ-5D-3L, DM represents diabetes mellitus, HT represents hypertension, PreControl and PostControl define observations from the GP-treated control group before and after PN intervention, PostTreatment define observations from the PN-treated group after intervention and location controls of Gold Coast and Rural Victoria.
Model 2 comprises a series of related functions that are estimated for each chronic condition (Models 2a–c). The functions take the same form as Eqn (1) with the removal of the DM and HT dummy variables.
The OLS estimator is robust following the transformation of the dependent variable. Testing for possible multicolliniarity between independent variables using the variance inflation factor (v.i.f.) produced nonsignificant results (mean v.i.f. ranging between 1.22 and 1.37). The Ramsey RESET procedure testing for omitted variables also produced non-significant results ranging between P = 0.295 and P = 0.446
Coefficients of the above functions, once the exponential is taken, give the percentage change in MBS charge (Y) for a 1 unit change in each independent variable.18 In addition, coefficients are retransformed to provide mean dollar values to assess the treatment effect using the smearing method.19 All analyses were performed using STATA version 12.20
Results
The sample comprised 20% recruited from the GC, 48% from TW and 32% from Victoria (Table 1). One-third of patients in TW were in each chronic disease group. In GC and Victorian practices, 62% and 42% of patients had DM, respectively, with the remaining patients evenly divided between CVD and HT. The random allocation of patients into the intervention group (those treated under PN managed care) and control (GP managed care) was stratified by geographic location. Over the course of the study, three patients died (two in GP-led care and one in PN-led care). No patients in the PN-led care requested reassignment to GP-led care, but four patients were reassigned to the GP due to deterioration of their condition. The average age was 66.7 years (range 34–90 years) and 31% had an established diagnosis of DM, 28% had CVD and 42% had HT. The EQ-5D scores ranged from 0.23 to 1.0, with an average of 0.81. The baseline sample suggests successful randomisation.
|
The number of total visits per patient more than doubled from before to during the intervention period for all three chronic diseases (Table 2). The mean number of visits and total MBS charges per patient also increased over the same period. For those in the GP-led group, total visits (per patient) increased from before to during the intervention period by 123% for DM (mean visits 5.7 vs 12.9, respectively), by 148% for CVD (mean visits 5.7 vs 14.2, respectively) and by 134% for HT (mean visits 5.7 vs 13.4, respectively). Similarly, for patients in the PN-led care group, total visits to the practice increased from before to during the intervention period by 301% for DM (mean visits 5.78 to 23.17, respectively), by 250% for CVD (mean visits 5.73 to 20.03, respectively) and by 190% for HT (mean visits 5.73 to 16.59, respectively).

|
For the 12-month intervention period, participants with CVD in the PN-led care group had a greater number of GP visits compared with patients in the GP group (15.06 v. 11.00, respectively; P = 0.011, t-test). Patients with DM and HT had similar numbers of GP visits for the GP-led and PN-led care groups (P = 0.262 and P = 0.342, respectively; t-test). A comparison of the number of visits to PNs across both treatment groups revealed that CVD patients in the PN-led care group made more PN than GP visits (4.97 vs 3.23, respectively; P = 0.013), DM patients in the PN-led care group had considerably more PN visits (13.29 vs 1.63, respectively; P < 0.001) and HT patients in the PN-led care group had marginally more PN visits (4.80 vs 3.12, respectively; P = 0.013).
All GP and PN visits, and their associated MBS item costs, are included in the revenue analysis. This includes visits directly associated with patients’ chronic conditions and those not. During the intervention period, half of all visits were attributed as being directly related to the management of patients’ chronic conditions. Over the 12-month intervention period, patients on average made approximately five visits to a GP for the purposes of managing their stable chronic condition. This figure corresponds well with GP consultation data from the Australian Health Survey, 2011–12 for each chronic condition.21 In addition, MBS data show that for the general population there were claims for 6.5 professional services per person in 2008–09, including specialists visits.22
A range of MBS item codes for GP ‘Professional Attendances’ are the clear drivers of the MBS costs measured in the present study. Over 45% of all MBS item numbers claimed are associated with the MBS Group A–Professional Attendances (Table 3). These GP attendances claim amounts range from A$27.73 to A$253.30. The most common item number claimed was A1–23 for a 20-min consultation. In contrast, the item numbers associated with PN attendances (M2) and loadings for regional and rural medical practices (M1) also account for approximately 45% of the total number of claim items, but these item amounts ranged only between A$6.65 and A$11.35. The remaining 10% of item numbers claimed were spread across Diagnostic Imaging, Therapeutic and Pathology. The claims associated with medicine scripts were not included in the analysis.

|
The costs (total annual item charges) relative to the pre-intervention period using pooled data for all three chronic diseases had positive and significant coefficients for the GP- and PN-led care groups for the intervention period (P < 0.001; Table 4), indicating higher costs during the intervention period. The variables age, EQ-5D, DM, and Victoria (rural) were also significant (P < 0.001). Of these, the EQ-5D score (as measured at the pre-intervention period) was inversely associated with MBS item charges. On average, a 1% increase in the EQ-5D score resulted in a 44.5% (exp–0.60 = 0.5548) decrease in MBS item charges. Relative to patients with CVD, DM and HT patients had 17% higher had 15% lower MBS total item charges, respectively. Controlling for location, the Victorian group had higher mean MBS item charges of 21% relative to regional (TW) study participants. In addition, for each year increase in age, mean MBS item charges increased by 2%.

|
The same regression analysis was repeated for each of the three chronic diseases (Table 4). These tables show differing results with respect to geographic location and allocation to PN- or GP-led care groups. For each of the three diseases, variables from both the PN- and GP-led care groups are positive and highly significant, indicating greater numbers of visits to PNs and GPs. Relative to TW study participants, those with DM in the urban (GC) practice had greater total MBS charges, as did those with CVD and HT patients in Victoria.
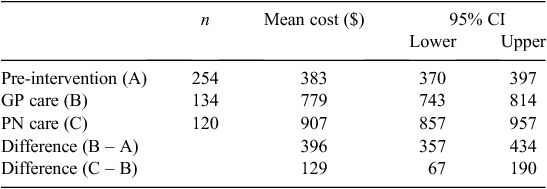
The GP group recorded re-transformed charge increases of A$396 above the pre-intervention phase (Table 5), whereas the corresponding increase in total MBS item charges for the PN-led care group was A$524. This re-transformation is based on Model 1. Thus, the net additional cost of PN-led care over GP-led care was A$129 per participant per year.
|
Discussion
The present study compared total MBS charges for patients who were managed for their stable chronic disease by either usual GP- or PN-led care. Our main findings showed that total MBS claims increased by a mean of A$129 per patient for PN-led care above GP-led care over a 1-year period, having controlled for age, self-reported quality of life and geographic location of practice. Patients with CVD recorded the highest number of GP and second highest number of PN visits in the intervention period. Patients with DM recorded the highest mean number of PN visits and a large increase in the number of GP visits during the intervention period. As a result, CVD and DM patient groups had higher mean MBS charges (total annual costs) relative to HT patients. The combined additional consultations with GPs and PNs drive the majority of these increases.
The notion that a PN-led model of care would free up GPs to attend to more acute problems and thereby improve healthcare delivery cost-effectively was not supported. GPs were busier with their trial patients, perhaps due a Hawthorne effect,23 or because of the natural deterioration of the chronic diseases as patients aged. Similarly, PNs were significantly busier, perhaps for the same reasons, or because of the time demands of individual care plans, the assumption of a new role and the need to refer patients becoming unstable or developing a new problem. Furthermore, some extra GP visits could have been offset by PNs preventing or detecting problems early, but the data cannot analyse these effects. The analysis presented here focused on the overall (average) difference in total charges (revenue from MBS) between PN- and GP-led care rather than delving into individual patient care pathways and complications. Of note was that the mix of GP and PN visits varied markedly between chronic diseases, suggesting different care loads.
Nevertheless, each chronic disease patient who was managed by a PN generated additional MBS income for the practice due to more frequent contact with the practice. The mean increase in total MBS charges was A$129 per annum (approximately A$140 in 2013 values) for PN-led care over GP-led care. For a practice to employ a PN without incurring additional costs to the practice, some additional calculations are required to identify the break-even point, as now described. The cost to employ a PN in a general practice comprises the national average hourly wage rate for a registered nurse working in a general practice (approximately A$33 in 2013), plus salary on-costs of 25%, plus an additional 25% for workplace overheads. This sums to approximately A$52 per hour to employ a PN.
The new PNIP introduced in July 2012 requires a registered general nurse to work a minimum of 12 h 40 min per week for an annual payment to the practice of A$25 000.4 This is approximately A$38 per hour. Additional loadings are available for inner regional to very remote practices and for Department of Veteran’s Affairs clients. At the time the present study was undertaken, various claims needed to be made for each PN item. We had previously calculated that for a general practice to break even from employing a PN, the PN will need to spend no more than an average of 2.7 h on each patient per year (including non-patient contact time) and a full-time PN (37.25 h per week) should manage at least 717 chronic disease patients. The new PNIP incorporates all PN MBS items into a single payment, which should reduce administrative burden and improve efficiency. However, the margin for salary on-costs and workplace overheads means that greater income will need to be generated by the practice to cover any shortfalls.
There exists an obvious expenditure implication for the Australian Government by promoting the role of PNs as a means of increasing the capacity of the primary health care sector and attempting better management of long-term chronic conditions (i.e. more PNs means more expenditure on PNs). However, this increase in expenditure for chronic conditions may lead to total health care expenditure savings in the future by limiting the number and duration of chronic disease hospital admissions.24,25 Recent evidence is mixed. With CVD alone having a health expenditure of A$1.8 billion dollars in 2004–05, and approximately 72 per cent of this coming from in-patient hospital costs,26 attempts to promote more primary health care chronic disease management may provide the Australian Government with savings in total health expenditure.
The limitations of the study include the small sample sizes for each chronic disease across PN and GP groups and three sample locations, which potentially reduce some generalisability of the study’s conclusions. However, the diversity of geographical locations is an overall strength, despite the confounding between geographic location and practice behaviour. The three chronic diseases selected are frequently seen in general practice and therefore the results and subsequent calculations provide a good guide to the cost and expected workload of a GP employing PNs. We know nothing about the maintenance of the effect long term. We have evaluated MBS costs and not total costs (i.e. we did not evaluate the total fees charged by the practice). Fees charged by the practice will be subject to wide variation depending on locality and the population the practice services. It is apparent that patients will access services (or MBS items) more frequently under this PN-led model of care and potentially increase total costs to the MBS; whether the additional costs lead to better health outcomes (improved quality of life, reduced admissions to hospital, longer survival) remains unknown. A much larger trial that includes these end-points is needed to address these questions. An additional weakness of the study is the possible artefact of the pre-intervention data (e.g. patient records may be truncated for new patients and/or patient records for the pre-intervention period are more likely to have been incomplete because the main focus was on the intervention period). However, these factors will have had similar effects on both the PN and GP groups.
Conclusion
Medicare reimbursements provide sufficient funding for general practices to employ PNs within limits of workloads.
Competing interests
No relevant disclosures are declared by any of the authors.
Acknowledgements
The authors acknowledge the other members of the research team: Paul Fahey, Peter Baker and Rosemary Mahomed. The study was funded through an Australian Research Council Discovery grant (no. DP110102439).
References
[1] Wright FL, Wiles RA, Moher M. Patients’ and practice nurses’ perceptions of secondary preventive care for established ischaemic heart disease: a qualitative study. J Clin Nurs 2001; 10 180–8.| Patients’ and practice nurses’ perceptions of secondary preventive care for established ischaemic heart disease: a qualitative study.Crossref | GoogleScholarGoogle Scholar | 1:STN:280:DC%2BD38%2FptFykuw%3D%3D&md5=a07a83cc13abbc86e2e6ad0008c1aefeCAS | 11820338PubMed |
[2] Iglesias B, Ramos F, Serrano B, Serrano B, Fàbregas M, Sánchez C, García MJ, Cebrian HM, Aragonés R, Casajuana J, Esgueva N, PIPA Group A randomized controlled trial of nurses vs. doctors in the resolution of acute disease of low complexity in primary care. J Adv Nurs 2013; 69 2446–57.
| A randomized controlled trial of nurses vs. doctors in the resolution of acute disease of low complexity in primary care.Crossref | GoogleScholarGoogle Scholar | 23517494PubMed |
[3] Houweling ST, Kleefstra N, van Hateren KJJ. Can diabetes management be safely transferred to practice nurses in a primary care setting? A randomised controlled trial. J Clin Nurs 2011; 20 1264–72.
| Can diabetes management be safely transferred to practice nurses in a primary care setting? A randomised controlled trial.Crossref | GoogleScholarGoogle Scholar | 21401764PubMed |
[4] Medicare Australia. Practice Nurse Incentive Program guidelines. Canberra: Department of Human Services; 2012. Available at http://www.medicareaustralia.gov.au/provider/incentives/files/9689-1208en.pdf [verified 19 May 2014].
[5] Eley D, Del Mar C, Patterson E, Synnott RL, Baker PG, Hegney D. A nurse led model of chronic disease care: an interim report. Aust Fam Physician 2008; 37 1030–2.
| 19142279PubMed |
[6] Ehrlich C, Kendall E, Muenchberger H. Practice-based chronic condition care coordination: challenges and opportunities. Aust J Primary Health 2011; 17 72–8.
| Practice-based chronic condition care coordination: challenges and opportunities.Crossref | GoogleScholarGoogle Scholar |
[7] McCarthy G, Cornally N, Moran J, Courtney M. Practice nurses and general practitioners: perspectives on the role and future development of practice nursing in Ireland. J Clin Nurs 2012; 21 2286–95.
| Practice nurses and general practitioners: perspectives on the role and future development of practice nursing in Ireland.Crossref | GoogleScholarGoogle Scholar | 22788562PubMed |
[8] Hefford M, Love T, Cumming J, Finlayson M, Raymont A. The financial impact of clinical task substitution between practice nurses and GPs in New Zealand primary care centres. N Z Med J 2011; 124 59–64.
| 21963926PubMed |
[9] Vallejo-Torres L, Morris S. Factors associated with the use of primary care services: the role of practice nurses. Eur J Health Econ 2011; 12 373–81.
| Factors associated with the use of primary care services: the role of practice nurses.Crossref | GoogleScholarGoogle Scholar | 20496159PubMed |
[10] Commonwealth Department of Health and Ageing. Medicare benefits schedule book, 1 November 2007. Canberra: Australian Government; 2007.
[11] Eley D, Patterson E, Young J, Fahey PP, Del Mar CB, Hegney DG, Synnott RL, Mahomed R, Baker PG, Scuffham PA. Outcomes and opportunities: a nurse-led model of chronic disease management in Australian general practice. Aust J Primary Health 2013; 19 150–8.
| Outcomes and opportunities: a nurse-led model of chronic disease management in Australian general practice.Crossref | GoogleScholarGoogle Scholar |
[12] Viney R, Norman R, King MT, Cronin P, Street DJ, Knox S, Ratcliffe J. Time trade-off derived EQ-5D weights for Australia. Value Health 2011; 14 928–36.
| Time trade-off derived EQ-5D weights for Australia.Crossref | GoogleScholarGoogle Scholar | 21914515PubMed |
[13] Commonwealth Department of Health and Ageing. Medicare benefits schedule book, 1 November 2009. Canberra: Australian Government; 2009.
[14] Manning W, Mullahy J. Estimating log models: to transform or not to transform? J Health Econ 2001; 20 461–94.
| Estimating log models: to transform or not to transform?Crossref | GoogleScholarGoogle Scholar | 1:STN:280:DC%2BD3MvhvVOksw%3D%3D&md5=84624aa575db29cdc165f966abecd9a7CAS | 11469231PubMed |
[15] Manning W. The logged dependent variable, heteroscedasticity, and the retransformation problem. J Health Econ 1998; 17 283–95.
| The logged dependent variable, heteroscedasticity, and the retransformation problem.Crossref | GoogleScholarGoogle Scholar | 1:STN:280:DyaK1czjvVWltw%3D%3D&md5=2feb1a491a0d2931ceb6666aa1a03e96CAS | 10180919PubMed |
[16] Royston P, Wright E. A method for estimating age-specific reference intervals (‘normal ranges’) based on fractional polynomials and exponential transformation. J R Stat Soc Ser A Stat Soc 1998; 161 79–101.
| A method for estimating age-specific reference intervals (‘normal ranges’) based on fractional polynomials and exponential transformation.Crossref | GoogleScholarGoogle Scholar |
[17] MacLean C, Morton N, Elston R, Yee S. Skewness in commingled distributions. Biometrics 1976; 32 695–9.
| Skewness in commingled distributions.Crossref | GoogleScholarGoogle Scholar | 1:STN:280:DyaE2s%2FgtVKhsQ%3D%3D&md5=8e9e22b4c29c410b14e12ea482105d74CAS | 963179PubMed |
[18] Hayashi F. Econometrics . Princeton, NJ: Princeton University Press; 2000.
[19] Duan N. Smearing estimate: a nonparametric retransformation method. J Am Stat Assoc 1983; 78 605–10.
| Smearing estimate: a nonparametric retransformation method.Crossref | GoogleScholarGoogle Scholar |
[20] StataCorp. Stata 12. College Station, TX: StataCorp; 2012.
[21] Australian Bureau of Statistics. Australian health survey: health services usage and health related actions, 2011–12. Catalogue no. 4364.0.55.002. 2013. Available at http://www.abs.gov.au/ausstats/abs@.nsf/PrimaryMainFeatures/4364.0.55.002?OpenDocument [verified 18 December 2013].
[22] Australian Government Department of Human Services. Medicare Australia statistics: Medicare group reports. 2013. Available at http://www.medicareaustralia.gov.au/statistics/mbs_group.shtml [verified 24 December 2013].
[23] Adair J. The Hawthorne effect: a reconsideration of the methodological artifact. J Appl Psychol 1984; 69 334–45.
| The Hawthorne effect: a reconsideration of the methodological artifact.Crossref | GoogleScholarGoogle Scholar |
[24] Coleman K, Mattke S, Perrault PJ, Wagner EH. Untangling practice redesign from disease management: how do we best care for the chronically ill? Annu Rev Public Health 2009; 30 385–408.
| Untangling practice redesign from disease management: how do we best care for the chronically ill?Crossref | GoogleScholarGoogle Scholar | 18925872PubMed |
[25] Peikes D, Chen A, Schore J, Brown R. Effects of care coordination on hospitalization, quality of care, and health care expenditures among Medicare beneficiaries: 15 randomized trials. JAMA 2009; 301 603–18.
| Effects of care coordination on hospitalization, quality of care, and health care expenditures among Medicare beneficiaries: 15 randomized trials.Crossref | GoogleScholarGoogle Scholar | 1:CAS:528:DC%2BD1MXhvVOqur0%3D&md5=fa3cac6f9e851fb5090fc8af18aca4eaCAS | 19211468PubMed |
[26] Australian Institute of Health and Welfare (AIHW). Key indicators of progress for chronic disease and associated determinants: data report. Catalogue no. PHE 142. Canberra: AIHW; 2011.