

Profiling the allied health staffing of Queensland Health inpatient general rehabilitation units
Catherine Barrett A B , Catherine Stephens A , Julie Hulcombe A and Brian McEvoy AA Allied Health Professions’ Office of Queensland, PO Box 2368, Fortitude Valley BC, Qld 4006, Australia. Email: julie_hulcombe@health.qld.gov.au; catherine_stephens@health.qld.gov.au; brian_mcevoy@health.qld.gov.au
B Corresponding author. Email: catherine.barrett2@health.qld.gov.au
Australian Health Review 39(1) 89-94 https://doi.org/10.1071/AH13242
Submitted: 17 December 2013 Accepted: 3 September 2014 Published: 6 November 2014
Journal Compilation © AHHA 2015
Abstract
Objective The purpose of this paper was to profile staffing levels for allied health (AH) professional and support staff in Queensland Health inpatient general rehabilitation services (at a given point-in-time) and compare them against established profession-specific standards and guidelines in order to provide a reference for future workforce planning for these services.
Methods A statewide analysis of AH staffing in Queensland Health inpatient general rehabilitation services was undertaken during June–August 2011. Reported full-time equivalent positions (FTE) were compared to several established national and international benchmarks. Patient activity data was used to calculate the average length of stay (ALOS) and Functional Independence Measure (FIM) scores on admission.
Results Sixteen facilities reported 202 FTE for a total of 466 general rehabilitation beds, with a resultant average workforce ratio of 0.43 FTE/bed. While several professional groups within specific services met established benchmarks, the majority failed to reach recommended staffing ratios. More than half the workforce (53%) was entry-level or consolidating clinicians. The FTE/bed ratios were compared against both patient ALOS and FIM scores on admission and showed a poor correlation.
Conclusion Across all included services statewide, there was significant variance in AH staffing levels and diversity in skill mix for inpatient general rehabilitation services.
What is known about the topic? The AH workforce faces several challenges to delivering effective, efficient and responsive services including balancing the high and escalating demand for services with managing staff costs. While several different workload capacity measures have been used successfully for medical and nursing professions, there is currently little published evidence about effective workforce allocation for AH professionals (AHPs) in rehabilitation settings.
What does this paper add? This paper describes AH staffing levels in Queensland Health inpatient general rehabilitation services. It includes the outcome of analysis of data collected from AHPs and allied health assistants (AHAs) and comparison with established benchmarks.
What are the implications for practitioners? The workforce ratios identified can assist with future workforce planning when introducing new services and reviewing service delivery models. They should be considered in conjunction with other relevant standards and planning tools, and it is recommended that further work be undertaken to investigate links between staffing levels and patient outcomes, as many of the current benchmarks rely heavily on professional opinion.
Introduction
The Queensland Health allied health (AH) workforce faces several challenges to delivering effective, efficient and responsive inpatient rehabilitation services, including the increased demand for aged care services associated with an ageing population.1 Predicting future workforce requirements for new and enhanced AH services is difficult. Capability frameworks exist, which provide guidelines on the range of professional and support staff required, but not actual staffing numbers.2
Inpatient general rehabilitation services aim to provide patients (who have lost function or ability due to injury or disease) with the highest possible level of independence (physically, psychologically, socially and economically) through a combined and coordinated use of dedicated medical, nursing and AH professional (AHP) skills encompassing individual assessment, intervention, regular review, discharge planning, community integration and follow up.3 This multiprofessional team approach makes it even more difficult to predict appropriate staffing numbers.
There are several contemporary papers (Table 1) that recommend staffing ratios for AH services delivered in inpatient general rehabilitation services.3–10 The ratio-based methodologies applied in their development have been derived from four main approaches: (i) consensus; (ii) experimental trial; (iii) current clinical practice; and (iv) staff classification level.5

|
Methods
Twenty-six casemix-funded Queensland Health facilities and Mater Health Services were surveyed and were asked to report on AH full-time equivalent positions (FTE) for service provision to adult inpatient general rehabilitation services. Queensland Health provides publically funded services for the state of Queensland, Australia. The AH professions included in the scope of the project were dietetics, occupational therapy, podiatry, pharmacy, psychology, physiotherapy, radiography, speech pathology and social work. AH support staff included allied health assistants (AHAs) both profession-specific and multiprofessional.
Palliative care, geriatric evaluation and management, specialist rehabilitation services (viz. spinal and acquired brain injury units) and rehabilitation services provided in paediatric, outpatient and community settings were considered out of scope for this project.
AH managers coordinated the distribution and subsequent collation of a data collection spreadsheet from each health facility during June–August 2011. Sites self-reported the number of actual FTE (including all services and time except on-call) provided to designated inpatient general rehabilitation beds.
Reported FTE data included the variety of activities typically performed by the individual in a clinical role (i.e. individual and non-individual patient attributable activities, clinical services management, teaching and training and research).
Data were collected for each profession according to staff classification (i.e. Health Practitioner11) levels: HP3 (entry and consolidating, both newly qualified clinicians and developing professional clinicians), HP4 (senior, demonstrate high-level knowledge, skills, experience and clinical leadership), HP5 (advanced, demonstrate a specialist level of knowledge, skills, experience and clinical leadership) and HP6 (specialist, considered ‘experts’ in their field).12
The number of designated general rehabilitation beds was sourced centrally from the Health Statistics Centre (Queensland Department of Health). Activity data comprising admitted patient episodes of care, patient days and average length of stay (ALOS) for rehabilitation services, Public Acute Hospitals, Queensland 2011–12 was sourced from the Queensland Hospital Admitted Patient Data Collection (QHAPDC).13 In addition, QHAPDC retrospectively reported Functional Independence Measure (FIM) scores collected from patients on admission to the designated rehabilitation units included in this study during the same time frame. An example of an activity of daily living tool, FIM requires reporting of both a cognitive and motor score and has been shown to accurately predict LOS14 and resource use in rehabilitation settings. A high FIM score equates to a high level of functional independence.
The FTE/bed data for physiotherapy has been compared to staffing guidelines recommended by the Australasian Faculty of Rehabilitation Medicine (AFRM, 2011),7 Austin Hospital (2006)8 and Christie and Grimwood (2006).9 Occupational therapy data has been compared against AFRM (2011)7 and Christie and Grimwood (2006).9 Social work, speech pathology, dietetics, psychology and allied health assistants have been benchmarked against the revised AFRM standard (2011)7 and pharmacy against the Society of Hospital Pharmacists of Australia (2011)10 standards.
Results
Sixteen facilities reported 202 FTE for a total of 466 inpatient general rehabilitation beds, with a resultant average workforce ratio of 0.43 FTE/bed (range 0.17–0.64).
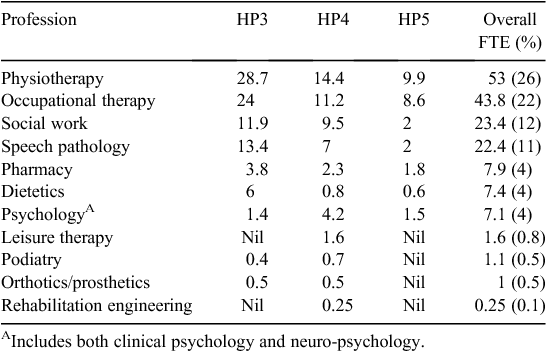
Table 2 summarises staffing levels for AHPs providing services to inpatient general rehabilitation units as reported in June–August 2011. Profession-specific results have been reported as overall FTE, % overall FTE and according to health practitioner level.
|
Table 2 demonstrates the considerable variation in staffing levels for inpatient general rehabilitation services across facilities statewide, although the major AHPs – physiotherapy, occupational therapy, social work and speech pathology – were consistently provided in all participating facilities. In comparison, smaller contingents of pharmacy, dietetics and psychology were provided in 75%, 88% and 56% of facilities respectively.
The numbers for adjunct AHPs (i.e. more likely to be provided by consultation on referral rather than by a designated FTE) delivering services to inpatient general rehabilitation services were very limited, with three services (19%) reporting FTE for podiatry and another one (6%) reporting FTE for both podiatry and orthotics/prosthetics.
Two facilities (13%) reported FTE for leisure therapy, while only one facility (6%) provided a rehabilitation engineering service. There were no exercise physiologists reported as working in the Queensland Health inpatient general rehabilitation units included in this profile. Due to data collection issues, medical imaging profiles were unable to be included. The majority of facilities (69%) collectively employed 32.5 FTE AHAs, which is equivalent to 16% of the overall reported FTE.
Approximately 169 FTE AH practitioners provided services to designated inpatient general rehabilitation beds: 53% by HP3 level clinicians; 31% by HP4 level clinicians and the remaining 16% provided by HP5 level clinicians. There were no HP6 level clinicians reported as working in the rehabilitation services included in this profile.
Comparison with benchmarks
It is difficult to benchmark against standards that provide a range of staffing ratios according to patient type when the casemix for a typical inpatient general rehabilitation unit might include patients from all higher frequency diagnostic groups. Consequently, the FTE/bed ratios per profession recommended by the revised AFRM7 and Christie and Grimwood9 have been averaged across all patient types. However, this assumes an equal mix of patient types, which may not be wholly indicative of the casemix of patients admitted to the units included in this study.
Table 3 presents a comparison of Queensland Health inpatient general rehabilitation services for individual facilities. Professional FTE/bed ratios per facility and collectively are compared against established benchmarks. Although no one particular facility met the benchmarks for all allied health services reported, the overall (statewide) average FTE/bed ratios for speech pathology and AHA met the revised AFRM7 standard, while both physiotherapy and occupational therapy met the Christie and Grimwood9 recommendation.

|
Activity data
While it is recognised that rehabilitation services are provided in facilities without designated beds, analysis of activity data was limited to those facilities where rehabilitation care was delivered in a designated unit.15
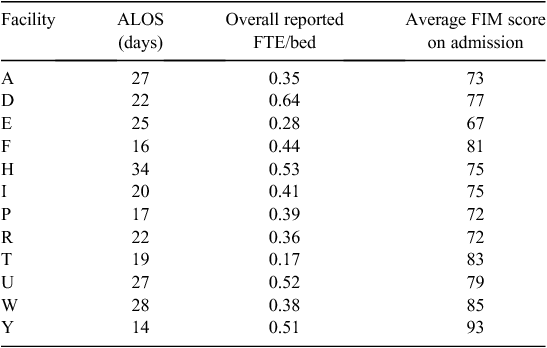
Facility K was excluded from this analysis because of an inability to isolate activity for its inpatient general rehabilitation services from the specialised services provided.
Due to the inability to separate out day hospital activity (considered ambulatory and therefore excluded in this study, but reported as inpatient data) for facilities with large ambulatory services, facilities C and J were excluded from analysis of ALOS. For the remaining facilities, the mean ALOS was 24 (14–34) days, which compares favourably with the Australian public sector ALOS for the 2011–12 financial year of 24.5 (24.2–24.7) days.15
Initial total FIM scores were utilised as a measure of complexity and compared to the FTE/bed and ALOS calculated. While total FIM scores on admission showed a small negative correlation with ALOS (r = –0.4), there was a poor correlation between FIM scores and FTE/bed (r = 0.2) and FTE/bed and ALOS (r = 0.2). Table 4 summarises activity data by ALOS, total FIM scores on admission and total FTE/bed per facility.
|
Discussion
Across all facilities statewide, there was significant variance in AH staffing levels and diversity in the mix of professions for inpatient general rehabilitation units.
The higher proportion of HP3 clinicians working within inpatient general rehabilitation offers opportunities for developing clinicians to consolidate their skills and provides a clinical workforce structure conducive to succession planning. Additionally, the leadership provided by senior clinicians (either within local services or statewide) ensures the development of research proposals, evaluation of service provision and incorporation of evidence-based practice as part of Queensland Health rehabilitation service delivery. Effective and efficient service delivery models need to consider staff classification levels within the total multidisciplinary team with an appropriate balancing of generalist and specialist skill mix requirements.
Of the 11 services (69%) that reported designated FTE for AHAs, 10 (63%) met the revised AFRM7 standard. Ratios of AHP to AHA staffing vary within the literature, both between and within profession groups16and may be related to availability of the professional workforce, acceptance by the profession, nature of work, recognition of scope of practice, work environment and the ability to supervise.
While AHAs are clearly a valued and well-utilised resource in inpatient general rehabilitation units when compared with other sub-specialties, there may still be several potential opportunities to increase the percentage of AHAs in the total workforce skill mix.
It is clear that existing FTE levels across many facilities and professions fail to reach the recommended staffing ratios referenced in this profile regardless of whether they have been determined according to the work setting or patient type.
The degree of variance in the ALOS across services statewide may reflect (in part) the diverse patient casemix with its varying levels of complexity and acuity. It may also be related to the availability (or lack thereof) of sub-acute and post-discharge services;17 for example, day therapy, community-based rehabilitation services and residential nursing home placements18 or difficulties in coordination with external agencies/services that support transition to home for patients with complex needs.19
Rehabilitation services would appear to be particularly sensitive to difficulties at service transition points and highly dependent on the interface between inpatient, outpatient and community services.20
The lack of correlation between ALOS and overall staffing levels (expressed as total FTE/bed) is somewhat surprising given units with lower LOS generally face increased demands on staffing associated with the higher turnover of patients. The poor correlation between staffing levels and patient acuity (measured by FIM scores on admission) is also unexpected. The modest negative correlation between ALOS and initial FIM score is more indicative of the trend expected where low FIM scores generally indicate a longer stay while high FIM scores indicate a shorter stay in rehabilitation. While ALOS and FIM are not necessarily accurate measures of staff workload, the lack of a strong correlation suggests that additional factors such as historical practices are driving at least some of the variability in the FTE/bed ratio between facilities. There is a plethora of evidence to link improved staffing ratios for nursing with enhanced patient outcomes nationally and internationally, but there is little that directly links allied health staffing ratios to patient outcomes. This is a subject worthy of further investigation.
Conclusion
It is recognised that this relatively simple approach to AH workforce mapping has several limitations. Self-reported data was collected from 16 facilities (at a point in time) to inform a profile of the inpatient general rehabilitation AH workforce in Queensland Health, in order to provide a baseline reference for future planning of these services. Despite two separate verification processes, the accuracy of reporting (for certain professions) cannot be absolutely guaranteed.
Reported FTE were compared to several established national and international standards and guidelines and while several professional groups within specific services met these benchmarks, the majority failed to reach the recommended staffing ratios.
For most designated rehabilitation units, there does not appear to be any apparent link between the mix and levels of staff and the casemix of patients admitted, as evidenced by the poor correlation between FTE/bed ratios, ALOS and initial FIM scores. Staffing has most likely developed in a haphazard way, dependent on historically determined resourcing rather than agreed parameters for contemporary evidence-based practice.
The existing workforce ratios do not reflect best practice recommendations nor are they intended to be prescriptive, but rather a representation of the range of resource allocation within Queensland Health facilities at the time of data collection. While staffing ratios can assist with future service planning, they must be considered in conjunction with other relevant standards and planning tools.
Before workforce planning and allocation can be effectively undertaken, team composition, skill mix and role delineation need to be formally and systematically reviewed in order to identify new ways of working and facilitate service redesign.21 The Calderdale Framework (for example) provides a workforce planning model based on the risk analysis of tasks, which is much more patient-centred than the professional-centric ratio approach. This model also promotes improved opportunities for professional skill-sharing and delegation to AHAs within a transprofessional team, which has the potential to substantially alter staffing ratios.
Increasing the proportion of support workers (e.g. AHAs), and being treated by a team with fewer senior staff and by fewer types of practitioners during the episode of care has been shown to be positively associated with improved patient outcomes.22
Decisions about rehabilitation-based workforce requirements should consider the unique character of individual services (with regard to the local population,22 patient casemix and acuity, model of care, etc.), availability of sub-acute and post-discharge services and their capacity to continue to manage demand within a best practice framework. Planning for new or enhanced inpatient general rehabilitation services must take into account staffing for adjunct and support roles in addition to predominant AHPs, backfill for leave and the non-clinical components of service delivery (e.g. professional and management activities, formal teaching, training and research).
The use of AHAs varies between profession-specific and multiprofessional roles and is likely based on service needs. A structured approach to determining and expanding the scope of delegated tasks to AHAs is required to ensure quality care. While in no way negating the need to advocate strongly for additional resources for staffing, alternative models of care that optimise the efficient use of limited AH resources should be further explored.
Competing interests
The authors declare that they have no competing interests.
References
[1] Australian Rehabilitation Alliance. Position statement: the need for a national rehabilitation strategy. Sydney: Royal Australasian College of Physicians; 2011.[2] Queensland Health. Clinical services capability framework for public and licensed private health facilities, Version 3.1. Brisbane: Queensland Government; 2012.
[3] Australasian Faculty of Rehabilitation Medicine. Standards: adult rehabilitation medicine services in public and private hospitals. Sydney: Royal Australasian College of Physicians; 2005.
[4] School of Public Health Centre for Research. Report of systematic literature review on workforce models for allied health professionals. Brisbane: Queensland University of Technology; 2008.
[5] Cartmill L, Comans T, Clark M, Ash S, Sheppard L. Using staffing ratios for workforce planning: evidence on nine allied health professions. Hum Resour Health 2012; 10
| Using staffing ratios for workforce planning: evidence on nine allied health professions.Crossref | GoogleScholarGoogle Scholar | 22293082PubMed |
[6] Allied Health in Rehabilitation Consultative Committee. Guidelines for allied health: resources required for the provision of quality rehabilitation services, version 10. Melbourne: Allied Health in Rehabilitation Consultative Committee; 2007.
[7] Australasian Faculty of Rehabilitation Medicine. Standards (for the provision of) inpatient adult rehabilitation medicine services in public and private hospitals. Sydney: Royal Australasian College of Physicians; 2011.
[8] Ridoutt L, Schoo A, Santos T. Workload capacity measures for use in allied health workforce planning. Melbourne: Department of Human Services; 2006.
[9] Christie H, Grimwood M. Staffing: can physiotherapists and occupational therapists predict EFT per bed in acute care facilities? Leading Edge 2006; 32 1–15.
[10] Society of Hospital Pharmacists of Australia. Revised information on clinical pharmacist staffing levels. Supplement to SHPA standards of practice for clinical pharmacy 2004. Melbourne: Society of Hospital Pharmacists of Australia; 2011.
[11] Queensland Industrial Relations Commission. Health practitioners’ (Queensland Health) certified agreement (No. 2). Brisbane: Queensland Government; 2011.
[12] Campbell KL, Murray EM. Allied health services to nephrology: an audit of current workforce and meeting future challenges. J Ren Care 2013; 39 52–61.
| Allied health services to nephrology: an audit of current workforce and meeting future challenges.Crossref | GoogleScholarGoogle Scholar | 23298287PubMed |
[13] Queensland Health. Queensland Hospital Admitted Patient Data Collection (QHAPDC) manual 2012–13. Brisbane: Data Collections Unit, Queensland Government; 2012.
[14] Amundsen J, Brunner A, Ewers M. J Undergraduate Res 2000; III 263–70.
[15] Australasian Rehabilitation Outcomes Centre. AROC annual report and benchmarks: financial year benchmarks (2011/2012) – Australia. Wollongong: Australian Health Services Research Institute, University of Wollongong; 2013.
[16] South Australia Health. Allied health scope of practice role development in the wider allied health service delivery context: The allied health assistant (AHA). Adelaide: Centre for Allied Health Evidence, University of South Australia; 2008.
[17] Anderson C, Ni Mhurchu C, Brown PM, Carter K. Stroke rehabilitation services to accelerate hospital discharge and provide home-based care: an overview and cost analysis. Pharmacoeconomics 2002; 20 537–52.
| Stroke rehabilitation services to accelerate hospital discharge and provide home-based care: an overview and cost analysis.Crossref | GoogleScholarGoogle Scholar | 12109919PubMed |
[18] Queensland Health. Queensland statewide rehabilitation medicine services plan 2008–12. Brisbane: Planning and Coordination Branch, Queensland Government; 2008.
[19] Health NSW. Rehabilitation redesign project final report – model of care. Sydney: NSW Government; 2010.
[20] South Australia Health. Statewide rehabilitation service plan 2009–17. Adelaide: Statewide Service Strategy Division, Department of Health, South Australia; 2009.
[21] Smith R, Duffy J. Developing a competent and flexible workforce using the Calderdale Framework. Int J Ther Rehabil 2010; 17 254–62.
| Developing a competent and flexible workforce using the Calderdale Framework.Crossref | GoogleScholarGoogle Scholar |
[22] Nancarrow S, Enderby P, Moran A, Dixon S, Parker S, Bradburn M, Mitchell C, John A, McClimens A. The relationship between workforce flexibility and the costs and outcomes of older peoples’ services. Report for the National Institute for Health Research Service Delivery and Organisation programme. Sheffield: National Institute for Health Research; 2010.