Clinical activity profile of preregistration physiotherapy students during clinical placements
Susan Stoikov A B E , Kassie Shardlow C , Mark Gooding D and Suzanne Kuys BA Physiotherapy Department, Princess Alexandra Hospital, Metro South Hospital and Health Service, 199 Ipswich Road, Woolloongabba, Qld 4102, Australia.
B School of Physiotherapy, Australian Catholic University, 1100 Nudgee Road, Banyo, Qld 4014, Australia. Email: suzanne.kuys@acu.edu.au
C Metro South Hospital and Health Service, C/- Logan Hospital Physiotherapy Department, PO Box 6031, Yatala, Qld 4207, Australia. Email: Kassie.Shardlow@health.qld.gov.au
D Physiotherapy Department, Townsville Hospital and Health Service, IMB 1, Post Box 670, Townsville, Qld 4810, Australia. Email: Mark.Gooding@health.qld.gov.au
E Corresponding author. Email: susan.stoikov@health.qld.gov.au
Australian Health Review 42(6) 661-666 https://doi.org/10.1071/AH16181
Submitted: 25 August 2016 Accepted: 3 May 2017 Published: 22 June 2017
Journal Compilation © AHHA 2018 Open Access CC BY-NC-ND
Abstract
Objective The aim of the present study was to determine the clinical activity profile of preregistration physiotherapy students during clinical placements and their clinical activity contribution to health service delivery.
Methods Clinical activity data for 2014 were obtained from five Queensland public sector hospitals providing preregistration physiotherapy students clinical education in three key clinical areas (cardiorespiratory, musculoskeletal and neurological) over four 5-week placement blocks. Data regarding the number of student occasions of service (OOS) and the length of the OOS (LOOS) were collected to determine the average OOS and LOOS per student in each clinical area.
Results Twenty weeks of student data were collected from each hospital in each clinical area, representing 29.1% of cardiorespiratory, musculoskeletal and neurorehabilitation student placements. Students completed 19 051 OOS. The average OOS per student per block for cardiorespiratory, musculoskeletal and neurorehabilitation placements was 98.3, 74.0 and 72.4 respectively. Two-way ANOVA revealed a main effect of weeks (F = 402.1, P < 0.001) and clinical area (F =1331.5, P < 0.001) for LOOS.In addition, an interaction was found between clinical placement week and clinical area for LOOS (F = 8.4, P < 0.001).
Conclusions Student clinical activity data are useful for understanding the student contribution to health services. Student contribution appears to increase throughout the clinical placement and consideration should be given to the clinical educator : student ratio to enhance overall student contribution.
What is known about the topic? Quantitative data describing physiotherapy student clinical care activity during placements are limited.
What does this paper add? This paper profiles physiotherapy student clinical care activity and the changes occurring over 5-week placements.
What are the implications for practitioners? Physiotherapy students provide clinical activity for health services that changes over their 5-week placement. Student clinical activity should be considered when responding to placement demand and planning service delivery.
Introduction
Preregistration physiotherapy student clinical education within clinical practice settings is a core component of developing competent, effective and safe clinicians.1 The physiotherapy profession requires a significant level of clinical training before registration, with clinical placements needing to occur in various health settings and clinical areas.2 Accreditation requirements for entry-level physiotherapy programs in Australia indicate that students must complete placements that provide opportunities to develop competence in the key areas of physiotherapy (cardiorespiratory, musculoskeletal and neurological physiotherapy).1 Providing clinical placements can result in many benefits and challenges to healthcare services. Benefits include encouraging staff to engage in reflective practice3 and increased exposure to evidence-based practice and current knowledge.4 Reported barriers include managing time constraints and coping with challenging students.5 Although early physiotherapy research identified that student clinical placements within healthcare services enhance overall productivity,6 quantitative data identifying student contribution to service delivery are limited. These data would be valuable to inform health policy, planning and resourcing requirements of clinical placements, as well as enhancing capacity and skill to provide quality clinical education.
One aspect of student contribution that has attempted to be quantified is student productivity. Clinical educator (CE) and student occasions of service (OOS) and time spent treating patients have been measured, with comparisons made before, during and after student clinical placements.7,8 However, to date, no study has investigated the volume of, or changes in, physiotherapy student OOS or length of OOS (LOOS; treatment time) throughout a clinical placement across different clinical areas. Another factor that may affect student contribution is the CE : student ratio. A systematic review found that there was little quantitative evidence to suggest the most effective or productive CE : student ratio.9 Further research is required to inform best practice clinical education.
The present study investigated the quantitative contribution preregistration physiotherapy students make to physiotherapy service delivery in Queensland public sector hospitals. The primary aim of the study was to determine the profile of student clinical care activity, including identifying the volume of and changes in student OOS and LOOS across a placement in three key clinical areas of physiotherapy practice and hospitals. The secondary aim of the study was to identify the effect of CE : student ratios on student clinical activity.
Methods
Participants
Five Queensland public sector hospitals participated in the present study (three metropolitan and two regional hospitals). Hospitals were selected based on hospital type and location, the hospital’s information management system and the volume of physiotherapy students undertaking clinical placements in the three clinical areas at each hospital. The type of hospital was determined using the peer group descriptions ‘principal referral hospital’ and ‘public acute Group A hospitals’.10 Principal referral hospitals are large tertiary teaching hospitals that, on average, complete 74 631 acute weighted separations and have a wide variety of speciality areas.10 A public acute Group A hospital completes, on average, 27 155 acute weighted separations, but does not have the same breadth of speciality areas as a principal referral hospital.10 The present study was approved by the Metro South Health Human Research Ethics Committee(HREC/15/QPAH/133).
Procedures
Student clinical activity data from 2014 were obtained from each participating hospital in three key clinical areas: cardiorespiratory, musculoskeletal and neurorehabilitation. For each clinical area, data were obtained from four clinical placement blocks, each of 5 weeks in length, providing 20 weeks of clinical activity data for each clinical area for each hospital. Placement blocks were selected to ensure all Queensland universities providing physiotherapy programs were represented for each clinical area and data were available across the calendar year to capture seasonal variation and student prior clinical placement experience.
In the present study, ‘clinical activity data’ refers to the reported clinical care activities provided to patients and other activities related to the delivery of health services. Clinical activity data used in the present study were obtained from hospital-specific information management systems in which students recorded this information as part of routine practice. Data were then imported into Microsoft (Armonk, NY, USA) Excel format for analyses. Information regarding the total number of 2014 clinical placements, CE : student ratio at each hospital and the total number of Queensland public sector hospital physiotherapy clinical placements in the three key clinical areas in 2014 was also obtained from the Queensland Physiotherapy Placement Collaborative.11
Measures
Student clinical activity was determined by student-documented OOS and LOOS. For the purposes of the present study, an OOS was defined as a single interaction between a student physiotherapist and patient to deliver care that affected patient health outcomes. Due to different information management systems recording group data differently, groups were recorded as one OOS. LOOS describes the time, in minutes, to provide an OOS.12
Analysis
All data were deidentified before being pooled and analysed. Descriptive statistics were used to describe total student OOS, combined hospital student OOS and the average OOS per student in each placement week by clinical area. Percentage changes for each week of the placement, as well as overall change from Week 1 to Week 5 were calculated. No P-values are reported for OOS data due to deidentified data resulting in a count of OOS.
LOOS data were examined for outliers with upper and lower limits for an OOS set at 210 and 10 min respectively. The lower limit represents the minimum LOOS as defined by governing rules for clinical activity data recording.11 An upper limit of 210 min was selected because a longer student treatment time for a single OOS would be unreasonable. Data falling outside this range were removed for LOOS analysis, but were included for OOS analysis. Two-way analysis of variance (ANOVA) was used to examine the effects of clinical area and placement week on LOOS.
Hospital variability in each clinical area was described by the average OOS per student per block to account for the different number of students at each hospital in the three clinical areas. The average OOS per student per block was determined by calculating the total OOS in each hospital and correcting for the total number of students in the clinical area.
Total OOS completed by a group of students during a clinical placement and an individual student were compared for different CE : student ratios. Comparison between total OOS could only be performed in musculoskeletal and neurorehabilitation placements due to some limitations in the cardiorespiratory data. Combined student data at two hospitals hosting separate cardiorespiratory clinical placements simultaneously could not be separated for accurate data analysis. A Welch two-sample t-test was used to determine the differences in CE : student ratios within each clinical area. Statistical analyses were performed using SPSS v23 (IBM Corp, Armonk, NY) with significance set at two-tailed P < 0.05.
Results
Four of the five participating hospitals are considered principal referral hospitals (Hospitals 1, 2, 3 and 5), with the fifth a public acute Group A hospital.10 Four different information management systems were used in the five hospitals to collect student clinical activity data.
In all, data were collected for 300 weeks of student clinical activity data from all hospitals, representing 29.1% of all 2014 Queensland public sector hospital clinical placements in the key clinical areas. This represented 27.6% of all 2014 cardiorespiratory placements, 28.1% of all 2014 musculoskeletal placements and 31.9% of all 2014 neurorehabilitation placements. Students at the five hospitals produced 19 051 OOS across these three clinical areas.
Occasions of service
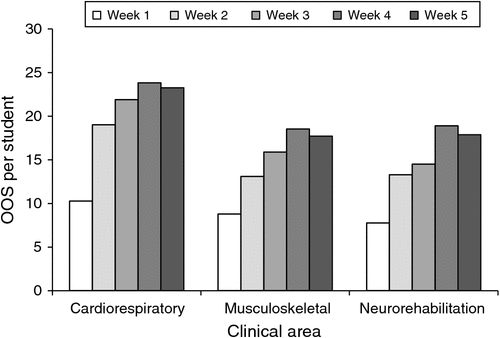
Across all clinical areas, total OOS increased, on average, by129% across the 5 weeks of the clinical placement. Weeks 1–3 saw the most growth in OOS in all clinical areas, with 100%, 70% and 80% increases in OOS in cardiorespiratory, musculoskeletal and neurorehabilitation placements over this time frame. Figure 1 illustrates the average OOS per student per week in each key clinical area, with growth observed from Week 1 to Week 4, plateauing in Week 5. When all clinical placements are considered for each clinical area, cardiorespiratory students, on average, produced the most OOS for a block (98.3 OOS per student per block). The average number of OOS per student per block was similar for musculoskeletal and neurorehabilitation placements (74.0 and 72.4 OOS per student per block respectively). Cardiorespiratory placements also produced more OOS than musculoskeletal and neurorehabilitation placements in each week of a clinical placement.

|
Length of OOS
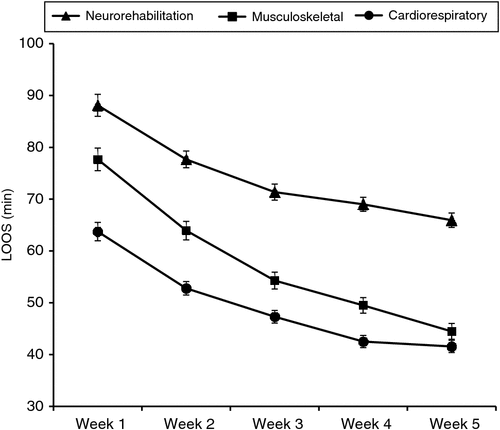
Identification of outliers resulted in 138 (0.72%) LOOS outside the limits set, which were removed for analysis. Two-way ANOVA revealed a main effect of weeks (F = 402.1, P < 0.001) and clinical area (F = 1331.5, P < 0.001) for LOOS. The average LOOS over 5 weeks was 49.6 min (95% confidence interval (CI) 49.0–50.2) for cardiorespiratory placements, 58.0 min (95%CI 57.2–58.8) for musculoskeletal placements and 74.4 min (95%CI 73.7–75.1) for neurorehabilitation placements. A significant interaction was found between clinical placement week and clinical area (F = 8.4, P < 0.001) on LOOS. Further, LOOS differed significantly between all clinical areas in each week (P < 0.01), with cardiorespiratory placements having the shortest LOOS in each week and neurorehabilitation placements having the longest LOOS over the 5 weeks (Fig. 2).

|
Hospital variability
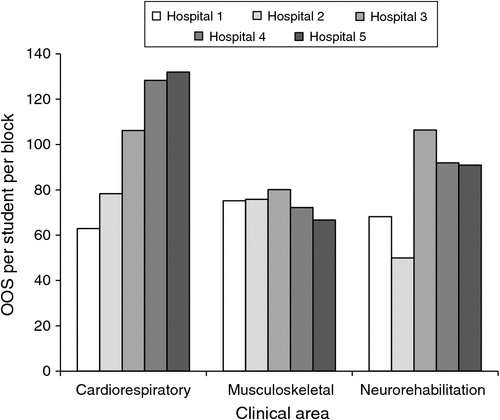
Across the three key clinical areas, average OOS per student varied between hospitals (Fig. 3). There was a 110% variation in cardiorespiratory OOS across the different hospitals, ranging from 62.9 to 132.0 OOS per student per block (in Hospitals 1 and 5 respectively). Similarly, there was a 113% variation in neurorehabilitation OOS, ranging from 50.0 to 106.4 OOS per student per block (in Hospitals 2 and 3 respectively). However, there was only a 20% variation in average OOS per student per musculoskeletal block, ranging from 66.7 to 80.1 OOS per student per block (in Hospitals 5 and 3 respectively).

|
Comparisons of CE : student ratios
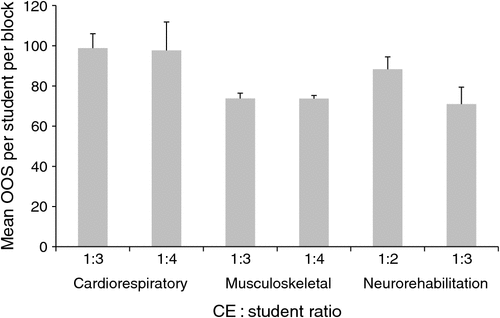
CE : student ratios in participating hospitals ranged between 1 : 2 and 1 : 4. For musculoskeletal placements, there was a significant difference (P < 0.001) between total OOS per block for students in a 1 : 3 CE : student ratio (221.3 OOS per block; 95%CI 205.6–237.0) compared with those in a 1 : 4 ratio (294.9 OOS per block; 95%CI 282.8–306.9). In the case of neurorehabilitation placements, there was no significant difference (P = 0.28) between total OOS per block for students in a 1 : 2 CE : student ratio (162.2 OOS per block; 95%CI 141.2–183.1) compared with those in a 1 : 3 ratio (191.8 OOS per block; 95%CI 142.6–240.8). However, when the average OOS per student per block was compared between different CE : student ratios (Fig. 4), there was no significant difference in the average number of OOS an individual student could produce per block in any clinical area.

|
Discussion
Student contribution to physiotherapy service delivery has not been quantified and investigated previously. To date, it has been unclear as to the number of OOS and the LOOS physiotherapy students complete while on 5-week clinical placements. The present study found that student OOS increased throughout a placement, with a concomitant reduction in LOOS. Students on cardiorespiratory placements completed a higher number of OOS than in other clinical areas. The CE : student ratio had some effect on the student contribution to service delivery, although this was not consistent across all clinical areas. This information can be useful to CEs, health service managers, universities and physiotherapy professional governance to benchmark student clinical activity, plan health service delivery and the associated resource requirements of clinical placements.
Not surprisingly, student OOS increased across Weeks 1–5 of the placement block. This is in contrast with findings in previous studies,8,13 where no change in OOS during clinical placements was reported for the student–supervisor team in the case of occupational therapy and dietetic students. Although the differences were not statistically significant, Rodger et al.13 demonstrated that the number of OOS had periods of growth during placements of longer length (10–14 weeks), with the main growth occurring between Weeks 1 and 3. This early period of growth was also present in the present study up to Week 4. This may suggest that the early weeks of clinical placements allow students to apply theoretical knowledge and gain a foundation in the clinical area.
As the number of OOS increased, LOOS decreased. It is expected that students develop a variety of skills and refine these throughout their clinical placements, fostered by experiential learning and CE facilitation. One strategy that CEs may use to increase student learning is to increase the number of OOS undertaken by students as a way of preparing students for entry into the profession. Hughes and Desbrow7 reported similar findings, with a significant reduction in LOOS over 10-week dietetic student placements with a trend for increasing OOS each week. A reduction in the clinical educator supervision of students over the 10 weeks was also found,7 suggesting that students develop some level of independence during clinical placements that increases over the duration of the placement. Thus, it would seem reasonable to assert that student OOS increase and LOOS decreases as a result of increasing experience in a clinical area as the placement weeks progress, enhancing student contribution to the health service in the later weeks of placements. Therefore, shorter placements may affect the ability of a group of students to maintain the required service requirements of a clinical area.
Variation between clinical areas in the number of OOS offers some insight into the difference in LOOS in each clinical area and likely reaffirms what is informally understood by the physiotherapy profession. Neurological patients often take longer to treat than in-patient cardiorespiratory patients and musculoskeletal out-patients with designated appointment times. The results of the present study indicate that clinical areas that provided fewer student OOS tended to spend more time per OOS, such as in neurorehabilitation. Due to the increased length per OOS in neurorehabilitation, the total number of student OOS may be limited compared with other clinical areas. Therefore, it is imperative to consider clinical areas separately when analysing clinical placements due to the varying needs and clinical requirements of patients.
Hospital variance in the average OOS per student per block in the cardiorespiratory and neurorehabilitation clinical areas is an interesting finding and requires careful consideration. Selection of clinical placement blocks ensured that all universities were represented, which aimed to achieve a balance between those students who were attending their first placement and those who had completed several clinical placements previously. These data are representative of the 2014 calendar year and include a spread of placements across months in an attempt to accommodate any seasonal changes in service delivery demands. This suggests that the hospital variability is due to individual hospital factors, which may include clinical placement structure and culture, CEs’ preferences and the amount of learning and other activities students undertake that do not directly produce OOS. Musculoskeletal placements demonstrated more consistency in average OOS per student per block, and this may be due to the nature of musculoskeletal placements that use appointment scheduling.
It appears that changing CE : student ratios had little effect on the average OOS produced by an individual student over the course of a placement. This suggests there is no ceiling effect on patient OOS with a CE : student ratio up to 1 : 4. Thus, increasing student numbers per CE could potentially result in increased OOS for the health service. This is supported by a previous study investigating a CE : student ratio of 1 : 2 model, where two students were more productive than one student or a physiotherapist alone.14 In contrast, a US study found no change in productivity with between four and eight students,15 suggesting that student, facility and workplace needs are important when considering total student numbers. Despite this, there appears to be agreement that students do not reduce the productivity of a health service. Therefore, it is reasonable to assert that increasing student numbers per CE can result in increased OOS for the health service. Thus, consideration should be given to the CE : student ratio to potentially enhance the student contribution and as a method of managing placement demand.
Study limitations
Although the present study provides an understanding of student contribution to physiotherapy clinical activity, it does have some limitations. The use of retrospective clinical activity resulted in limited ability to check the accuracy of data collected and entered. However, health services would regularly use these data to inform service delivery and thus the present study provides an analysis on real-world clinical activity data. Furthermore, due to differences in data information management systems, group OOS were allocated a single OOS. At those hospitals and in clinical areas where groups are frequently held, OOS may have been underestimated.
Conclusion
Hospitals that actively engage in providing clinical placements for preregistration physiotherapy students should consider using student clinical activity data when planning both service delivery and placement demand. Understanding student contribution to service delivery allows for effective workload management and, in fact, with careful consideration of hospital logistics may enhance the overall clinical care activity of the service. Furthermore, the results of the present study should encourage hospitals to consider their CE : student ratio and clinical education resourcing. Although the present study has provided valuable information, in order to fully appreciate and understand the student contribution to service delivery, further research is necessary to understand placement models and the effect a group of students has on service delivery compared with a registered physiotherapist.
Competing interests
The authors have no competing interests.
Acknowledgements
This project was funded via the Directors’ of Physiotherapy Services Queensland Physiotherapy Clinical Education and Training Initiative (2014–15 and 2015–16) with funds generated from the Physiotherapy Pre-registration Clinical Placement Agreement. Members of the Physiotherapy Student Contribution to Physiotherapy Services within Queensland Health Steering Committee.
References
[1] Australian Physiotherapy Council. Accreditation standard requirements. Melbourne: Australian Physiotherapy Council; 2011.[2] Health Workforce Australia. Clinical training profile: physiotherapy. Adelaide: Health Workforce Australia; 2014.
[3] Sturman N, Rego P, Dick ML. Rewards, costs and challenges: the general practitioner’s experience of teaching medical students. Med Educ 2011; 45 722–30.
| Rewards, costs and challenges: the general practitioner’s experience of teaching medical students.Crossref | GoogleScholarGoogle Scholar |
[4] DeWitt P, Rothberg A, Bruce J. Occupational therapy manager’s role in and perceptions of clinical education. South African J Occup Ther 2014; 44 9–14.
[5] Davies R, Hanna E, Cott C. ‘They put you on your toes’: physical therapists’ perceived benefits from and barriers to supervising students in the clinical setting. Physiother Can 2011; 63 224–33.
| ‘They put you on your toes’: physical therapists’ perceived benefits from and barriers to supervising students in the clinical setting.Crossref | GoogleScholarGoogle Scholar |
[6] Ladyshewsky R, Barrie C, Drake V. A comparison of productivity and learning outcomes in individual and cooperative physical therapy clinical education models. Phys Ther 1998; 78 1288–98.
| A comparison of productivity and learning outcomes in individual and cooperative physical therapy clinical education models.Crossref | GoogleScholarGoogle Scholar | 1:STN:280:DyaK1M%2FnsFaqsw%3D%3D&md5=e19b23beaad4248c54a7296085fc1b73CAS |
[7] Hughes R, Desbrow B. An evaluation of clinical dietetic student placement case-mix exposure, service delivery and supervisory burden. Nutr Diet 2010; 67 287–93.
| An evaluation of clinical dietetic student placement case-mix exposure, service delivery and supervisory burden.Crossref | GoogleScholarGoogle Scholar |
[8] Rodger S, Stephens E, Clark M, Ash S, Graves N. Occupational therapy students’ contribution to occasions of service during practice placements in health settings. Aust Occup Ther J 2011; 58 412–18.
| Occupational therapy students’ contribution to occasions of service during practice placements in health settings.Crossref | GoogleScholarGoogle Scholar |
[9] Lekkas P, Larsen T, Kumar S, Grimmer K, Nyland L, Chipchase L, Jull G, Buttrum P, Carr L, Finch J. No model of clinical education for physiotherapy students is superior to another: a systematic review. Aust J Physiother 2007; 53 19–28.
| No model of clinical education for physiotherapy students is superior to another: a systematic review.Crossref | GoogleScholarGoogle Scholar |
[10] Australian Institute of Health and Welfare (AIHW). Australian hospital peer groups. Canberra: AIHW; 2015.
[11] Queensland Physiotherapy Placement Collaborative. Queensland Physiotherapy Placement Collaborative – clinical network reports (2009–2016). Brisbane: Queensland Health; 2016.
[12] Allied Health Professions’ Office Queensland. Queensland Health allied health information management business rules. Brisbane: Allied Health Professions’ Office Queensland; 2014.
[13] Rodger S, Stephens E, Clark M, Ash S, Hurst C, Graves N. Productivity and time use during occupational therapy and nutrition/dietetics clinical education: a cohort study. PLoS One 2012; 7 e44356
| Productivity and time use during occupational therapy and nutrition/dietetics clinical education: a cohort study.Crossref | GoogleScholarGoogle Scholar | 1:CAS:528:DC%2BC38XhtlSjs7%2FI&md5=01f42b6a9344458a8ea183aad5f71e12CAS |
[14] Ladyshewsky R. Enhancing service productivity in acute care inpatient settings using a collaborative clinical education model. Phys Ther 1995; 75 503–10.
| Enhancing service productivity in acute care inpatient settings using a collaborative clinical education model.Crossref | GoogleScholarGoogle Scholar | 1:STN:280:DyaK2M3ovVegsA%3D%3D&md5=cadd65cb2648963b09188295d21abe33CAS |
[15] Moore J, Glenesk K, Hulsizer D, McCright B, Wrenn C, Sander T, Fisher D, Childs JD. Impact of an innovative clinical internship model in the US Army–Baylor Doctoral Program in physical therapy. US Army Med Dep J 2014; Jan–Mar 30–4.


