

Evidence of rapid population decline of the eastern quoll (Dasyurus viverrinus) in Tasmania
Bronwyn A. Fancourt A B , Clare E. Hawkins A and Stewart C. Nicol AA School of Zoology, University of Tasmania, Private Bag 5, Hobart, Tas. 7001, Australia.
B Corresponding author. Email: Bronwyn.Fancourt@utas.edu.au
Australian Mammalogy 35(2) 195-205 https://doi.org/10.1071/AM13004
Submitted: 4 March 2013 Accepted: 16 May 2013 Published: 24 June 2013
Abstract
Australia’s mammalian fauna has suffered unparalleled extinctions and declines in recent history. Tasmania has remained largely unaffected by these losses; however, marsupial dynamics are changing rapidly and new threats are emerging. Once abundant throughout south-eastern Australia, the eastern quoll (Dasyurus viverrinus) survives only in Tasmania. Until recently, it was considered widespread and common, but it may be undergoing a rapid and severe decline. The aim of this study was to quantify changes in eastern quoll populations over recent years. Data were compiled from statewide spotlight surveys, repeated historic trapping surveys and bycatch records from non-target trapping surveys. Spotlight surveys from 150 sites across Tasmania revealed a 52% reduction in the number of eastern quoll sightings over the 10 years to 2009. Declines of 61–100% were observed in trapping surveys at three study sites compared with trapping conducted 18–31 years earlier. A reduction in trap success was recorded in five of six non-target surveys, with declines of 51–100% over 1–12 years. These results suggest that the eastern quoll can no longer be presumed secure in Tasmania. Urgent management action may be needed to ensure the future conservation of the species in its last remaining stronghold.
Additional keywords: conservation status, endangered, native cat, spotlighting, survey methods, threatened species, trapping.
Introduction
In recent history, the Australian fauna has suffered unparalleled losses (Short and Smith 1994; Baillie et al. 2004; Johnson 2006; Woinarski et al. 2010), with terrestrial mammals particularly susceptible to extinctions and declines in both abundance and range (Burbidge and McKenzie 1989; Maxwell et al. 1996; Burbidge and Manly 2002). Declines have not affected the mammalian fauna evenly: medium-sized ground-dwelling mammals have been disproportionately affected (Burbidge and McKenzie 1989; Short and Smith 1994; Maxwell et al. 1996; Johnson and Isaac 2009).
With the notable exception of the thylacine (Thylacinus cynocephalus), Tasmania has been largely unaffected by these losses and has remained a refuge for marsupial diversity in Australia (Short and Smith 1994). Five species that were once widespread on the mainland now survive only in Tasmania. Two key differences between Tasmanian and mainland ecosystems that could explain the persistence of these species in Tasmania are the persistence of a relatively intact guild of marsupial carnivores, including the Tasmanian devil (Sarcophilus harrisii), spotted-tailed quoll (Dasyurus maculatus) and eastern quoll (Dasyurus viverrinus), and the absence or low densities of introduced eutherian carnivores such as the red fox (Vulpes vulpes). This suggests that top-down regulation of ecosystem processes by Tasmania’s marsupial carnivores may have contributed to retention of biodiversity on the island. As Tasmania’s largest marsupial carnivore, the Tasmanian devil may have historically suppressed the abundance and/or behaviour of mesopredators such as feral cats through aggressive encounters. While these interactions have not yet been tested in Tasmania, evidence from ecosystems across the world has documented similar trophic interactions and the subsequent extirpation of prey species following the removal of high-order carnivores (Ritchie and Johnson 2009).
Once widespread throughout south-eastern Australia, the eastern quoll is now considered extinct on the mainland, with the last confirmed sighting in the Sydney suburb of Vaucluse in 1963 (Dickman et al. 2001). Historically, the species has been considered widespread and locally common in Tasmania (McKnight 2008). However, recent anecdotal observations from landowners and managers suggest that it may now be undergoing rapid and severe decline in its last remaining refuge.
The aim of the current study was to quantify changes in eastern quoll populations over recent years. We tested recent monitoring trends in three ways. First, we reviewed annual spotlight survey data over the 20 years from 1990 to 2009 to identify long-term trends in the number of eastern quoll sightings across Tasmania, with population changes further analysed by region to determine whether changes occurred uniformly across the state. Spotlight survey methodologies were reviewed and considered in light of the life history and ecology of the species to evaluate whether survey methods were appropriate for monitoring long-term trends in the eastern quoll. Second, localised population changes were quantified at three study sites by repeating historic trapping surveys and comparing current capture rates to those recorded in the historic surveys for each site. Population changes derived in this way were compared with spotlighting data (where available) to test for concordance in trends and to verify the spotlighting data. Third, we collated all available eastern quoll capture data from a range of non-target surveys undertaken across Tasmania. Wherever a minimum of two temporal surveys was performed at a site, changes in trap success over time were quantified to determine whether observed population changes agreed with those recorded in both the spotlight surveys and the trapping surveys. Results were then evaluated to consider whether the combined evidence supports the assertion that the species is indeed undergoing rapid decline.
Materials and methods
Spotlight survey data
Long-term trends
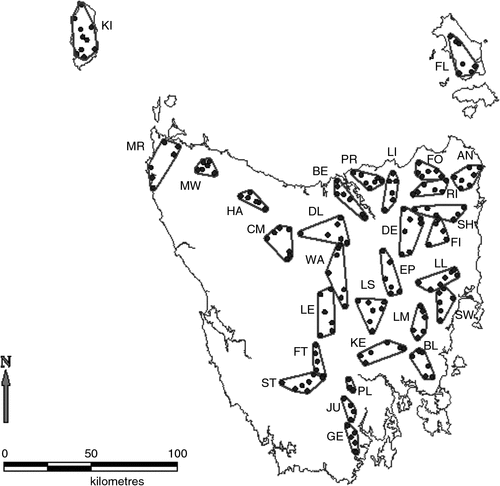
The annual spotlight surveys conducted by Department of Primary Industries, Parks, Water and Environment (DPIPWE) were begun in 1975 to monitor species subject to culling such as brushtail possums (Trichosurus vulpecula), Tasmanian pademelons (Thylogale billardierii) and Bennett’s wallabies (Macropus rufogriseus). All other non-domestic species observed were recorded (Hocking and Driessen 1992). Protocols were standardised in 1985, with variables such as observer height from ground, type of spotlight, vehicle survey speed, weather and moon phase, time of year and time of night all standardised where possible to help preserve consistency of data, ensure repeatability, reduce observer bias and increase precision and validity of observations (Hocking and Driessen 1992). Additional transects were progressively added and some rerouted subsequent to 1985, with 189 transects surveyed across most of the state in 2009 (Fig. 1).
|
Data analysis
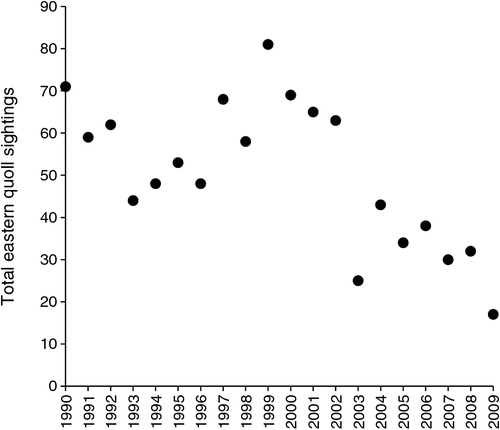
Long-term trend. The total numbers of eastern quoll sightings recorded in spotlight surveys were reviewed graphically from 1990 to 2009 inclusive to assess annual fluctuations and identify the point at which the decline in sightings commenced. To ensure consistent comparison across years, only those transects surveyed every year throughout the period were included in the analysis. Given the known 3- to 4-fold increase in the number of individuals over summer as juvenile quolls emerge each year (Fleay 1935; Godsell 1982; Bryant 1986), standardisation of influential variables such as time of year and time of night were considered crucial in the current analysis. As protocols were first standardised in 1985, observations before this time were not included in the analysis to ensure consistency of data among years. While 130 transects were surveyed every year from 1985 to 2009 inclusive, the 147 transects surveyed consistently every year between 1990 and 2009 showed similar trends but provided a larger sample size more representative of the species’ distribution across the state, with the additional 17 transects recording 25% of the total 977 eastern quoll observations during that 20-year period.
Ten-year decline. Population changes were quantified over the 10 years to 2009 in accordance with defined criteria for assessing threatened species status at state, federal and international levels. Only the 150 transects consistently surveyed during this period were included in the analysis. To reduce the impact of interannual fluctuations, for each transect we compared mean number of sightings from 1997–99 with those from 2007–09 using a one-tailed paired t-test to determine whether observed changes were significant. Survey results were further analysed by region to identify whether temporal changes were spatially consistent across the species’ distribution.
Repeat trapping surveys
Study sites
Study sites were selected wherever eastern quoll capture data were available from previous trapping surveys. Sites with both trapping data and local long-term spotlighting data were selected where possible, to validate whether both monitoring methods yielded similar population changes over time at a local scale.
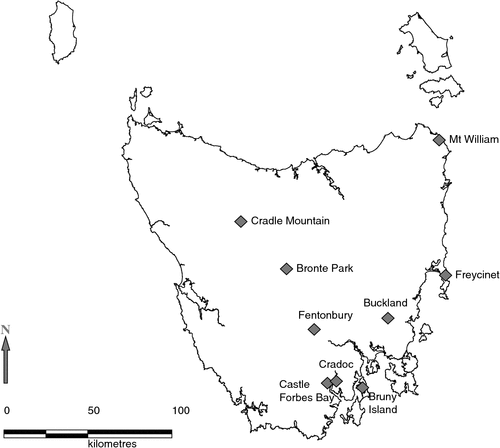
Cradoc (CR). The study site (43°06′13″S, 147°02′40″E) was on a 32-ha private cattle property ~35 km south-west of Hobart, Tasmania (Fig. 2). The property comprised large cleared open areas for grazing surrounded by dry sclerophyll forest on three sides, forming a definitive bush–pasture interface throughout the site.
|
The property was used to trap eastern quolls each month from December 1983 to January 1985 inclusive as part of a reproductive study on the species (Bryant 1988). High quoll densities in the region facilitated three different eastern quoll studies within 1.5 km of the study site between 1977 and 1985 (Blackhall 1980; Godsell 1983; Bryant 1988), with comparative raw trapping data available for two of these studies. The close spatial proximity of these studies and their temporal spread over a nine-year period provided multiple historic comparisons for the current study. No spotlighting data were available for this site.
Cradle Mountain (CM). The study site (41°35′47″S, 145°55′46″E) was at the northern end of the Cradle Mountain–Lake St Clair National Park in the central highlands of Tasmania (Fig. 2). It covered a 12-km section of the main tourist road, commencing ~4 km outside the northern park entrance, south to Dove Lake and west to Waldheim. The area comprised a mosaic of cool temperate rainforest, wet eucalypt forest, mixed forest, buttongrass moorlands and native grasslands.
The local eastern quoll population declined significantly in 1991 following a road upgrade along the northern section of the study area that resulted in an increase in both traffic speed and volume (Jones 2000). The upgrade occurred part way through a three-year study on the local native carnivore populations (Jones and Barmuta 1998). All 19 known eastern quolls and around half the known 39 Tasmanian devils disappeared within 17 months of the upgrade, with a corresponding increase in roadkill over the same period (Jones 2000). The implementation of mitigation measures such as traffic slow points, signage, wildlife reflectors and escape ramps during 1996 was followed by a gradual recovery of eastern quolls, with populations back to 50% of their former numbers by 1998 (Jones 2000).
Previous trapping data for the site were available from the local carnivore study undertaken between 1990 and 1992 (Jones 1995). Given the impact of the road upgrade on the eastern quoll population from June 1991, comparative figures could not be used for periods thereafter as these incorporate the effects of increased roadkill and temporary localised population declines at that time. Only data for March and May 1991 were used in the statistical analyses in the current study. Long-term spotlighting data were available for an area 4–14 km to the north of the study site, with a new spotlighting transect introduced along the northern half of the study site in late 1991. No local spotlighting data were available for the study site before the road upgrade in 1991.
Buckland (BU). The study site was on the southern boundary of the Swanport State Forest (42°31′32″S, 147°39′3″ E) ~48 km north-east of Hobart (Fig. 2). Forest to the east of Buckland Road was protected as an informal reserve while coupes to the west were classified as future production forest and were last harvested by clearfelling around 1974 (V. Thompson, Forestry Tasmania, pers. comm.). The southern margin of the state forest adjoined expansive sheep-grazing pastures, forming a bush–pasture interface.
No previous trapping data were available for this site. However, several studies refer to the high densities of eastern quolls formerly seen in this region (e.g. Fletcher 1977; Pearse 1981; Godsell 1983; Jones and Rose 1996), and nearby areas were used to capture eastern quolls on an ad hoc basis for reproductive and parasite studies (Fletcher 1977; Pearse 1981). In one historic study located within 4 km of the current study area, 12 traps were set and 12 or more quolls were captured, sometimes two per trap (A. Pearse, pers. comm.). These high densities are also evident in the long-term spotlighting data, which indicate that the two spotlighting transects that pass through the study site accounted for 7% of a total 661 statewide eastern quoll sightings between 1990 and 2000, whilst representing only 1% of the 131 transects surveyed consistently across that period.
Survey design
Eastern quolls were surveyed at each site using live capture and release. Standard PVC devil pipe traps (315 mm diameter × 875 mm length) (Mooney and Ralph, unpublished design) baited with lamb heart were used in preference to wire mesh cage traps to provide increased insulation and protection, facilitate disinfection and reduce the risk of injury such as canine breakage on wire mesh.
Nightly trap effort at each site replicated that used in the historical study for that site, being 20 traps per night at CR and 30 traps per night at CM, although nightly trap effort at CM did vary slightly between nights and sessions during 1991 (range: 19–31 traps per night, mean: 26 traps per night). With no comparative trapping surveys for the BU site, trap effort was set at 20 traps per night to allow comparison of results with the CR site, which supported similar vegetation, climate and land-use to the BU site. While precise GPS coordinates of traps were not recorded in the historic studies at CR or CM, discussions with the previous researchers ensured that trap positions in the current study replicated historic trap placement wherever possible, although three traps at CM were relocated <100 m due to the recent construction of tourist accommodation over the historic trap position. Traps at BU were placed along the bush–pasture interface along the southern edge of the site.
Each captured quoll was marked with an Allflex ISO-compliant FDX-B passive integrated transponder tag, then released immediately at the point of capture. The process was repeated for five consecutive nights to establish a capture–recapture history for each individual quoll. Three replicate surveys (March, May and July 2010) were performed at each site.
Data analysis
Capture–mark–recapture analysis was not possible in the current study due to the low number of individuals captured and the absence of recapture records in some historic studies.
Two population indices (number of unique individuals trapped, and trap success) were used in lieu of capture–mark–recapture estimates to quantify any long-term changes in eastern quoll populations at each site. The cumulative number of unique individuals trapped in each session was calculated over the same number of trap-nights as used in the reference study for each site, being 80 trap-nights at CR and 90 trap-nights at CM. Results were compared with the previous study to quantify any changes in the number of individuals trapped each session. The mean number of individuals trapped across all three trapping sessions (March, May and July) was then compared with the historic study using a one-tailed paired t-test to determine whether the number of individuals trapped was significantly lower than historic levels.
Raw trap success was calculated as the total number of eastern quoll captures each night (including recaptures) divided by the number of traps set for that night. Variables such as other species captured, trap failure, traps sprung or bait removed by unknown individuals/species were recorded at all sites in the current study. As these variables were also recorded in the historic study at CM, the number of traps set was adjusted for these variables in both studies to give the total number of traps available each night. Adjusted trap success was then calculated as the number of quoll captures divided by the number of traps available. These variables were not recorded in the historic CR surveys, so to ensure the most consistent comparison over time, no adjustment was made for these variables at CR. Trap success for the current study was compared with the historic study for each session at each site using a one-tailed Fisher’s Exact Test to determine whether current trap success was significantly lower than historic levels.
Due to the marked, predictable fluctuations in trappability of quolls between months due to factors such as increased mobility of males during mating and den loyalty of females while nursing, all comparisons between years were analysed using data from the same month each year to ensure that any differences over time reflected true population changes rather than normal seasonal effects. In the absence of comparative historic studies at Buckland, results from the current study were reviewed in light of available anecdotal evidence for the area.
Additional trapping data
While no other targeted eastern quoll surveys could be found with adequate capture records before the start of the decline, several other fauna surveys have recorded captures of eastern quolls across the state over recent years (Fig. 2). Eastern quoll bycatch data from non-target trapping surveys was obtained from a range of Tasmanian devil and Tasmanian bettong (Bettongia gaimardi) surveys undertaken by branches of DPIPWE and the University of Tasmania. Trapping data were included for all survey sites wherever surveys were conducted in two different years, thereby providing comparative data for that site and enabling a population change over time to be quantified. As comparative baseline dates ranged from 1999 to 2010 and surveys did not specifically target eastern quolls, inclusion of these additional data was considered beneficial in establishing a more extensive and complete picture of population trends across Tasmania. Wherever available, comparisons between years were made using data from the same month to minimise the impact of any intra-annual or seasonal fluctuations due to emergence of juveniles or increased mobility and trappability of males during mating.
All statistical analyses were performed using R (ver. 2.15.0, R Development Core Team 2012) with minimum significant P-values at α ≤ 0.05.
Results
Spotlight survey data
Long-term trend
The total number of eastern quoll sightings recorded across Tasmania each year has fluctuated considerably over the 20 years from 1990 to 2009 (Fig. 3), with mean annual sightings of 50.4 ± 3.9 (standard error) quolls (range: 17–81).
|
Ten-year decline
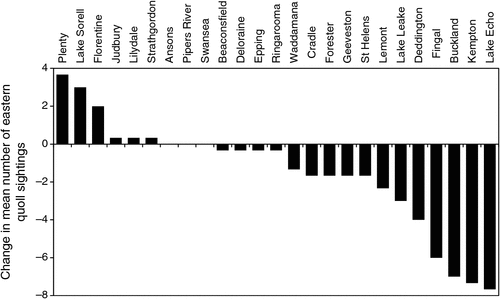
The annual number of sightings declined by 52% over the 10 years to 2009 ((1997–99) > (2007–09): t = 3.179, d.f. = 149, P < 0.001). Temporal changes were not consistent across the state, with some areas showing more marked declines than others (Fig. 4), although no geographical patterns were detected.
|
Repeat trapping surveys
CR
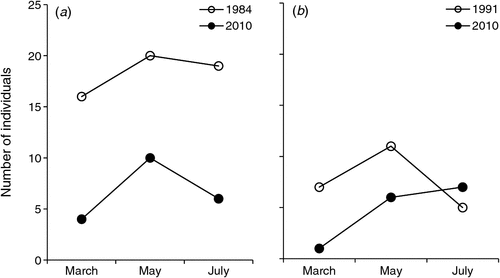
The number of individual quolls trapped in each of the three trapping sessions in the current study was significantly lower than during equivalent months in 1984 (Fig. 5a). A mean of 6.7 ± 1.8 individuals captured over the first 80 trap-nights per session in the current study represented a 64% reduction from the historic mean of 18.3 ± 1.2 quolls captured on the same study site in 1984 (t = 13.229, d.f. = 2, P = 0.003).
|
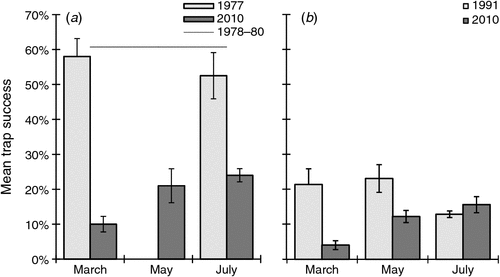
Trap success varied between sessions, with considerably lower success rates recorded in March (10 ± 2%) than in both May (21 ± 5%) and July (24 ± 2%). Trapping for the current study yielded significantly lower trap success than in 1977 for both March and July (both P < 0.001), with no comparative data available for May 1977 (Fig. 6a). While comparative data for 1978–80 were not available for individual months, the mean trap success of 63% over the 2.5-year study from 1978 to 1980 (Godsell 1983) was comparable to that recorded in the 1977 study (Blackhall 1980) and markedly higher than trapping results achieved in the current study.
|
CM
The cumulative number of unique individuals trapped throughout both March and May 2010 was significantly lower than in 1991 (Fig. 5b). The mean of 3.5 ± 2.5 quolls captured over the first 90 trap-nights per session in the current study represented a 61% reduction from the 1991 mean of 9.0 ± 2.0 individuals captured in the same area (t = 11.000, d.f. = 1, P = 0.029), with adjusted trap effort ranging from 14 to 26 traps per night during 1991. As expected, no corresponding reduction was evident in July following the road upgrade in 1991, with similar numbers of individuals trapped in both 2010 and 1991.
Trap success in 2010 varied between months in line with normal seasonal fluctuations, with March (4 ± 1%) yielding lower trap rates than both May (12 ± 2%) and July (15 ± 2%). Surveys in 2010 yielded significantly lower trap success than in 1991 for both March (P < 0.001) and May (P = 0.040), with the June 1991 road upgrade precluding meaningful statistical comparison of the July 1991 data (Fig. 6b).
BU
No eastern quolls were captured at Buckland during any of the three trapping sessions in the current study.
Additional trapping data
Non-target trapping surveys over a range of survey dates showed declines of 46–100% in trap success of eastern quolls at five of six sites, with only one site showing an increase in trap success (Table 1).

|
Discussion
Apparent decline in quoll abundance
The combined evidence from annual spotlight surveys, targeted eastern quoll trapping surveys and a range of non-target trapping fauna surveys suggests that the eastern quoll is undergoing severe and rapid decline, with subsequent spotlight surveys showing no signs of recovery. In the context of anecdotal observations of local population irruptions and declines over many decades, the recent decline may simply be part of a natural population fluctuation from which the species is likely to recover without management intervention. Alternatively, it may represent a shift to an alternative stable state, or a more concerning trajectory towards extinction. The observed reduction of more than 50% over 10 years is consistent with the IUCN criterion for listing the species as endangered (IUCN 2001).
While the total number of eastern quoll sightings does fluctuate between years, the marked overall reduction in sightings over the 10 years to 2009 suggests a sustained population decline across the state. While road-based spotlight surveys may not be a reliable means for monitoring some low-density, cryptic species such as spotted-tailed quolls, they have been demonstrated to accurately reflect long-term declines in species such as Tasmanian devils that were once abundant but have undergone severe decline with the spread of Devil Facial Tumour Disease (DFTD) (Hawkins et al. 2006; Hollings et al. 2013). Eastern quolls are nocturnal predators that traverse the landscape using roads and tracks (Jones 2000; Fancourt, unpub. obs.), lending themselves to detection using road-based spotlight surveys. They are regularly observed emerging from dusk until around midnight to forage and hunt across most of the night (Blackhall 1980; Jones et al. 1997; Fancourt, unpub. obs.), suggesting that they would be readily observed during surveys undertaken at these times, such as those performed by DPIPWE. However, eastern quolls are commonly associated with bush–pasture interface habitat (Godsell 1983) that does not always coincide with roads and tracks along which surveys are performed. While use of road-based transects may not be ideal for estimating population abundance, the use of the same permanent transects across years ensures that any road-bias remains constant between years, and hence the transect position is unlikely to affect any long-term trends in relative abundance detected in the data.
Spotlight survey limitations
As with any long-term survey method, various factors may result in significant interannual variation in reliability of observations. While the DPIPWE surveys follow a rigid set of standardised procedures following recommendations by Southwell and Fletcher (1985), logistical problems may lead to occasional deviations from protocols. For example, different observers may vary in their experience, resulting in an element of observer bias between transects and between years (e.g. Erwin 1982; Udevitz et al. 2005; Alldredge et al. 2008). High rainfall in some years may cause increased vegetation height and density, reducing detection probability away from the immediate roadside. Conversely, drought years may lead to increases in roadkilled herbivores as they concentrate foraging along road-edges where food resources are often more plentiful due to water runoff from the road (Forman and Alexander 1998; Klöcker et al. 2006). This can lead to greater quoll activity along roadsides to scavenge on carcasses (Jones 2000), potentially inflating the number of sightings in such years due to the spatial shift of quolls away from usual feeding areas to road edges where they are more visible to the observer. While standardising survey methodology will considerably reduce bias and variability of observations between transects and years, the extent to which all of these factors may realistically be controlled is questionable. These potential weaknesses notwithstanding, a review and analysis of spotlight surveys in Tasmania found that the adopted survey method was valuable for monitoring trends of several species, including the eastern quoll (Driessen and Hocking 1992).
Trap-revealed decline
The similar population declines detected in the current study using live-trapping as an alternative survey method provide increased confidence in the long-term statewide trends identified by the spotlight surveys. Significant reductions were observed in both the number of unique individuals trapped and the overall trap success, with reductions evident across all trapping sessions and all sites (except the July survey at CM, as anticipated). While spotlight surveys were not performed locally for all sites, the magnitude of the observed reductions correlate with the overall trends identified in the statewide spotlighting data.
The lower trap success observed in the targeted trapping surveys is unlikely to be an artefact of differences in trapping methods between the current study and historical studies. While the current study design closely followed the effort and location of previous trapping studies at each site, there were unavoidable differences in trap design and construction, trap trigger mechanisms (treadle or bait and hook) and type of bait used. Such differences may have contributed to a reduced trappability in the current study, thereby overstating the magnitude of any real decline. However, studies comparing the trap success of Tasmanian devils between PVC traps and cage traps found no significant differences in capture probabilities due to trap type (Lachish, pers. comm.). While similar analyses have not yet been performed for eastern quolls, the high trappability of the species (mean nightly recapture rates between 0.4 and 0.5 in both current and historic studies) suggests that capture probabilities are unlikely to differ significantly between trap types. This is further supported by trapping surveys on Bruny Island during August 2010, where eastern quoll trap success of 34% using PVC traps with bait and hook triggers and meat bait (Fancourt 2010) was comparable to the 31% trap success recorded in treadle-type cage traps baited with peanut butter sandwiches (Driessen et al. 2011), with both surveys conducted in adjacent paddocks on the same property over the same nights.
The study sites used to perform the repeat trapping surveys were formerly considered eastern quoll ‘hotspots’, with disproportionately high quoll densities compared with other parts of Tasmania. This may suggest a potential bias in the selection of study sites, with historic studies at these sites being undertaken at a time when quoll abundance was very high, and surveys undertaken in later years expected to record lower capture rates as populations naturally regress to the mean (Barnett et al. 2005). However, if these sites sustained the highest population densities in Tasmania in the past, then inherently they may represent a large proportion of the extant eastern quoll population, with any subsequent reductions representing not only localised declines for those sites, but for the species as a whole. This is further supported by the regional analysis of the spotlighting data in Fig. 4, which indicates that the largest declines occurred in the former eastern quoll ‘hotspots’ without equivalent increases in other regions to compensate for those areas in decline. While the spotlight surveys do not cover much of the south-west of Tasmania, this region has not been found to be optimal eastern quoll habitat, and hence the surveys cover most of the known eastern quoll distribution (Fancourt, unpub. data).
Further evidence for the statewide trend comes from the widespread declines in trap success recorded in the additional non-target trapping surveys (Table 1). Most of these studies were performed in years after eastern quoll spotlight sightings had already started to decline and use a range of baseline years for comparison. Moreover, many of these trapping studies were performed for other target species such as Tasmanian devils or bettongs, with eastern quoll captures recorded as incidental bycatch data. Accordingly, incorporation of these studies ameliorates any potential bias from selecting former eastern quoll ‘hotspots’ for analyses, while also providing data to corroborate results from both the targeted trapping surveys and spotlight surveys. Given that declines in trap success have been observed at almost every site, regardless of whether or not they were selected for targeted eastern quoll surveys, the effect of any perceived bias in site selection is unlikely to be significant.
Factors causing the decline
While this study has demonstrated the eastern quoll is, indeed, in decline, the underlying reasons for the decline remain elusive. Marsupial dynamics in Tasmania have changed rapidly in recent years and new threats are emerging. The Tasmanian devil is in steep decline due to the spread of DFTD (Hawkins et al. 2006; McCallum et al. 2009). Declines of Tasmanian devils may be allowing changes in the behaviour and abundance of mesopredators such as feral cats, potentially triggering trophic cascades that could threaten quolls and other species. Additionally, the observed eastern quoll decline correlates temporally with a period of ecological upheaval in Tasmania, including: persistent and severe drought (Tasmanian Planning Commission 2009), establishment of foxes (Saunders et al. 2006; Berry et al. 2007; Sarre et al. 2012), commencement of 1080 fox baiting operations in 2002 (Mooney et al. 2005; Saunders et al. 2006) and continuing widespread habitat modification and changes in land use (Tasmanian Planning Commission 2009). Each of these factors could have potentially contributed to the decline, either directly or through the trophic cascades that may follow, with possible cumulative or synergistic effects.
To prematurely attribute the decline to any correlative factor(s) without demonstration of causation could, however, result in inappropriate or inadequate management of the species and its agents of decline. Demographic modelling for several populations will help identify which life stages have the most influence on population viability and which differ in declining populations, thereby helping profile the cause by revealing its mode of action. Additionally, a range of candidate causal factors should be compared at sites where populations have declined with those where populations are comparatively stable, in order to isolate factors associated with the decline.
More detailed population monitoring is also recommended over coming years to identify whether populations are continuing to decline towards extinction, or whether the recent decline was part of a natural cyclical fluctuation. Population recovery would suggest that the cause of decline has ceased to operate or that earlier declines were part of a population fluctuation, while failure to recover or continued decline would indicate that the causes are still operating.
While declines in common species are often overlooked in favour of rare species or those imminently threatened with extinction, even relatively small proportional reductions in the abundance of common species can result in large absolute losses of individuals and biomass, leading to significant disruptions to ecosystem structure, function and services (Gaston et al. 2000; Gaston and Fuller 2008; Lindenmayer et al. 2011). The decline of a common species may result in persistence of local populations at much reduced abundance (an alternative stable state), entire loss of local populations, or a combination of the two (Hughes et al. 1997) but may also lead to high levels of threat or extinction (Gaston and Fuller 2008). There are many documented examples of previously common species that are now listed as threatened with extinction (Gaston and Fuller 2008), indicating that rapid slippage of a common species to rarity or even extinction is not as unlikely as it sometimes might seem, and that complacency in this respect may be unwise or even detrimental to its persistence.
Conservation biology aims to preserve biodiversity by preventing species declines and ultimately arresting the threat of extinction (Sodhi and Ehrlich 2010). To this end, the early detection of declines in abundance or contracting distribution is a necessary first step in identifying the reasons for temporal changes, thereby enabling timely management interventions to halt declines before they are too difficult to reverse (Caughley and Gunn 1996; Lindenmayer et al. 2011). Our work highlights the importance of high-quality long-term monitoring for quantifying population trajectories of not just the rare species, but also those common species that are critical to retaining key ecological and functional processes in ecosystems. We recommend a precautionary approach to management of the eastern quoll based on the presumption that the decline will continue, and, ideally, before the capacity to restore has been lost. Indeed, subsequent monitoring has not yet provided any evidence of recovery, suggesting that timely management action is likely to be required to secure the future of the species in its last remaining stronghold.
Acknowledgements
We thank Sally Bryant, Stewart Blackhall, Menna Jones and Anne-Maree Pearse for comparative historical trapping data; Sam Fox and Stewart Huxtable (Save The Tasmanian Devil Program), Matt Pauza (Fox Eradication Branch) and Elise Dewar and Menna Jones (UTas.) for permission to use their bycatch trapping data; and Greg Hocking and Kris Carlyon (DPIPWE) for providing spotlighting data. We also thank Ken Rowe, Forestry Tasmania, Tasmanian Parks & Wildlife Service (Cradle Mountain–Lake St Clair National Park) and “Murrayfield”, Bruny Island for their cooperation in providing access to study sites. We particularly thank the many volunteers who kindly assisted with field work, in particular Rachel Harris, Isobel Thomas and Alison and Jim Fancourt. Our thanks to Chris Johnson and two anonymous reviewers for providing comments on the draft manuscript. Funding was provided by the Holsworth Wildlife Research Endowment, the Wildlife Preservation Society of Australia, the Royal Zoological Society of New South Wales (Ethel Mary Read grant) and the MA Ingram Trust. This research was carried out under the University of Tasmania Animal Ethics Approval Permit #A0011017 and with permission from DPIPWE under scientific permits FA10042 and FA10116.
References
Alldredge, M. W., Pacifici, K., Simons, T. R., and Pollock, K. H. (2008). A novel field evaluation of the effectiveness of distance and independent observer sampling to estimate aural avian detection probabilities. Journal of Applied Ecology 45, 1349–1356.| A novel field evaluation of the effectiveness of distance and independent observer sampling to estimate aural avian detection probabilities.Crossref | GoogleScholarGoogle Scholar |
Baillie, J. E. M., Hilton-Taylor, C., and Stuart, S. N. (Eds) (2004). ‘2004 IUCN Red List of Threatened Species: A Global Species Assessment.’ (IUCN: Gland, Switzerland.)
Barnett, A. G., van der Pols, J. C., and Dobson, A. J. (2005). Regression to the mean: what it is and how to deal with it. International Journal of Epidemiology 34, 215–220.
| Regression to the mean: what it is and how to deal with it.Crossref | GoogleScholarGoogle Scholar | 15333621PubMed |
Berry, O., Sarre, S. D., Farrington, L., and Aitken, N. (2007). Faecal DNA detection of invasive species: the case of feral foxes in Tasmania. Wildlife Research 34, 1–7.
| Faecal DNA detection of invasive species: the case of feral foxes in Tasmania.Crossref | GoogleScholarGoogle Scholar |
Blackhall, S. (1980). Diet of the eastern native-cat, Dasyurus viverrinus (Shaw), in southern Tasmania. Australian Wildlife Research 7, 191–197.
| Diet of the eastern native-cat, Dasyurus viverrinus (Shaw), in southern Tasmania.Crossref | GoogleScholarGoogle Scholar |
Bryant, S. L. (1986). Seasonal variation of plasma testosterone in a wild population of male eastern quoll, Dasyurus viverrinus (Marsupialia: Dasyuridae), from Tasmania. General and Comparative Endocrinology 64, 75–79.
| Seasonal variation of plasma testosterone in a wild population of male eastern quoll, Dasyurus viverrinus (Marsupialia: Dasyuridae), from Tasmania.Crossref | GoogleScholarGoogle Scholar | 1:CAS:528:DyaL28Xls1Ggsb8%3D&md5=89ae9211681e2432c5c2c4a979c16a5aCAS | 3557082PubMed |
Bryant, S. L. (1988). Seasonal breeding in the eastern quoll Dasyurus viverrinus (Marsupialia: Dasyuridae). Ph.D. Thesis, University of Tasmania, Hobart.
Burbidge, A. A., and Manly, B. F. J. (2002). Mammal extinctions on Australian islands: causes and conservation implications. Journal of Biogeography 29, 465–473.
| Mammal extinctions on Australian islands: causes and conservation implications.Crossref | GoogleScholarGoogle Scholar |
Burbidge, A. A., and McKenzie, N. L. (1989). Patterns in the modern decline of Western Australia’s vertebrate fauna: causes and conservation implications. Biological Conservation 50, 143–198.
| Patterns in the modern decline of Western Australia’s vertebrate fauna: causes and conservation implications.Crossref | GoogleScholarGoogle Scholar |
Caughley, G., and Gunn, A. (1996). ‘Conservation Biology in Theory and Practice.’ (Blackwell Science: Cambridge, USA.)
Dickman, C. R., Lunney, D., and Matthews, A. (2001). Ecological attributes and conservation of dasyurid marsupials in New South Wales, Australia. Pacific Conservation Biology 7, 124–133.
Driessen, M. M., and Hocking, G. J. (1992). Review and analysis of spotlight surveys in Tasmania: 1975–1990. Department of Parks, Wildlife and Heritage, Scientific Report 92/1, Hobart, Tasmania.
Driessen, M.M., Carlyon, K., Gales, R., Mooney, N., Pauza, M., Thurstans, S., Visoiu, M., and Wise, P. (2011). Terrestrial mammals of a sheep-grazing property on Bruny Island, Tasmania. Papers & Proceedings - Royal Society of Tasmania 145, 51–64.
Erwin, R. M. (1982). Observer variability in estimating numbers: an experiment. Journal of Field Ornithology 53, 159–167.
Fancourt, B. (2010). Spatial and temporal variation in declining eastern quoll (Dasyurus viverrinus) populations in Tasmania. B.Sc.(Honours) Thesis, University of Tasmania, Hobart.
Fleay, D. H. (1935). Breeding of Dasyurus viverrinus and general observations on the species. Journal of Mammalogy 16, 10–16.
| Breeding of Dasyurus viverrinus and general observations on the species.Crossref | GoogleScholarGoogle Scholar |
Fletcher, T. P. (1977). Reprodution in the native cat Dasyurus viverrinus (Shaw). B.Sc.(Honours) Thesis, University of Tasmania, Hobart.
Forman, R. T. T., and Alexander, L. E. (1998). Roads and their major ecological effects. Annual Review of Ecology and Systematics 29, 207–231.
| Roads and their major ecological effects.Crossref | GoogleScholarGoogle Scholar |
Gaston, K. J., and Fuller, R. A. (2008). Commonness, population depletion and conservation biology. Trends in Ecology & Evolution 23, 14–19.
| Commonness, population depletion and conservation biology.Crossref | GoogleScholarGoogle Scholar |
Gaston, K. J., Blackburn, T. M., Greenwood, J. J. D., Gregory, R. D., Quinn, R. M., and Lawton, J. H. (2000). Abundance–occupancy relationships. Journal of Applied Ecology 37, 39–59.
| Abundance–occupancy relationships.Crossref | GoogleScholarGoogle Scholar |
Godsell, J. (1982). The population ecology of the eastern quoll Dasyurus viverrinus (Dasyuridae, Marsupialia), in southern Tasmania. In ‘Carnivorous Marsupials’. (Ed. M, Archer,) pp. 199–207. (Royal Zoological Society of New South Wales: Sydney.)
Godsell, J. (1983). Ecology of the eastern quoll, Dasyurus viverrinus (Dasyuridae: Marsupialia). Ph.D. Thesis, Australian National University, Canberra.
Hawkins, C. E., Baars, C., Hesterman, H., Hocking, G. J., Jones, M. E., Lazenby, B., Mann, D., Mooney, N., Pemberton, D., Pyecroft, S., Restani, M., and Wiersma, J. (2006). Emerging disease and population decline of an island endemic, the Tasmanian devil Sarcophilus harrisii. Biological Conservation 131, 307–324.
| Emerging disease and population decline of an island endemic, the Tasmanian devil Sarcophilus harrisii.Crossref | GoogleScholarGoogle Scholar |
Hocking, G. J., and Driessen, M. M. (1992). Tasmanian spolighting survey manual. Department of Parks, Wildlife and Heritage, Hobart, Tasmania.
Hollings, T., Hocking, G., Mooney, N., Jones, M., and McCallum, H (2013). Ecosystem impacts of disease induced top predator decline: The Tasmanian devil and devil facial tumour disease (DFTD). Conservation Biology , .
Hughes, J. B., Daily, G. C., and Ehrlich, P. R. (1997). Population diversity: its extent and extinction. Science 278, 689–692.
| Population diversity: its extent and extinction.Crossref | GoogleScholarGoogle Scholar | 1:CAS:528:DyaK2sXmvVynsL4%3D&md5=95390f9acd7756463641c1f674a267d5CAS | 9381179PubMed |
IUCN (2001). IUCN Red List Categories and Criteria: Version 3.1. IUCN Species Survival Commission, Gland, Switzerland.
Johnson, C. (2006). ‘Australia’s Mammal Extinctions: a 50 000 year history.’ (Cambridge University Press: Melbourne.)
Johnson, C. N., and Isaac, J. L. (2009). Body mass and extinction risk in Australian marsupials: the ‘Critical Weight Range’ revisited. Austral Ecology 34, 35–40.
| Body mass and extinction risk in Australian marsupials: the ‘Critical Weight Range’ revisited.Crossref | GoogleScholarGoogle Scholar |
Jones, M. E. (1995). Guild structure of the large marsupial carnivores in Tasmania. Ph.D. Thesis, University of Tasmania, Hobart.
Jones, M. E. (2000). Road upgrade, road mortality and remedial measures: impacts on a population of eastern quolls and Tasmanian devils. Wildlife Research 27, 289–296.
| Road upgrade, road mortality and remedial measures: impacts on a population of eastern quolls and Tasmanian devils.Crossref | GoogleScholarGoogle Scholar |
Jones, M. E., and Barmuta, L. A. (1998). Diet overlap and relative abundance of sympatric dasyurid carnivores: a hypothesis of competition. Journal of Animal Ecology 67, 410–421.
| Diet overlap and relative abundance of sympatric dasyurid carnivores: a hypothesis of competition.Crossref | GoogleScholarGoogle Scholar |
Jones, M. E., and Rose, R. K. (1996). Preliminary assessment of distribution and habitat associations of the spotted-tailed quoll (Dasyurus maculatus maculatus) and eastern quoll (D. viverrinus) in Tasmania to determine conservation and reservation status. Report to the Tasmanian Regional Forest Agreement Environment and Heritage Technical Committee, Tasmanian Public Land Use Commission, Hobart, Tasmania.
Jones, M. E., Grigg, G. C., and Beard, L. A. (1997). Body temperatures and activity patterns of Tasmanian devils (Sarcophilus harrisii) and eastern quolls (Dasyurus viverrinus) through a subalpine winter. Physiological Zoology 70, 53–60.
| 1:STN:280:DyaK2sznsFSjsw%3D%3D&md5=0b78705749bbc33c0bef6ed6ab4886a5CAS | 9231376PubMed |
Klöcker, U., Croft, D. B., and Ramp, D. (2006). Frequency and causes of kangaroo–vehicle collisions on an Australian outback highway. Wildlife Research 33, 5–15.
| Frequency and causes of kangaroo–vehicle collisions on an Australian outback highway.Crossref | GoogleScholarGoogle Scholar |
Lindenmayer, D. B., Wood, J. T., McBurney, L., MacGregor, C., Youngentob, K., and Banks, S. C. (2011). How to make a common species rare: a case against conservation complacency. Biological Conservation 144, 1663–1672.
| How to make a common species rare: a case against conservation complacency.Crossref | GoogleScholarGoogle Scholar |
Maxwell, S., Burbidge, A. A., and Morris, K. (Eds) (1996). ‘The 1996 Action Plan for Australian Marsupials and Monotremes.’ (Wildlife Australia: Canberra.)
McCallum, H., Jones, M., Hawkins, C., Hamede, R., Lachish, S., Sinn, D. L., Beeton, N., and Lazenby, B. (2009). Transmission dynamics of Tasmanian devil facial tumour disease may lead to disease-induced extinction. Ecology 90, 3379–3392.
| Transmission dynamics of Tasmanian devil facial tumour disease may lead to disease-induced extinction.Crossref | GoogleScholarGoogle Scholar | 20120807PubMed |
McKnight, M. (2008). Dasyurus viverrinus. In ‘IUCN Red List of Threatened Species’. (Version 2012.2). Available at: http://www.iucnredlist.org/details/6296/0 [accessed 6 February 2013].
Mooney, N., Emms, C., and Bloomfield, T. E. (2005). Minimising the effects of 1080 fox baiting on non-target species and vice versa while maximising the risks to foxes in Tasmania. In ‘Proceedings of the 13th Australasian Vertebrate Pest Conference, Te Papa Wellington, New Zealand, 2–6 May 2005’, pp. 148–149.
Pearse, A. M. (1981). Aspects of the biology of Uropsylla tasmanica Rothschild (Siphonaptera). M.Sc. Thesis, University of Tasmania, Hobart.
R Development Core Team (2012). R: A language and environment for statistical computing. R Foundation for Statistical Computing, Vienna, Austria.
Ritchie, E. G., and Johnson, C. N. (2009). Predator interactions, mesopredator release and biodiversity conservation. Ecology Letters 12, 982–998.
| Predator interactions, mesopredator release and biodiversity conservation.Crossref | GoogleScholarGoogle Scholar | 19614756PubMed |
Sarre, S. D., Macdonald, A. J., Barclay, C., Saunders, G. R., and Ramsey, D. S. L. (2013). Foxes are now widespread in Tasmania: DNA detection defines the distribution of this rare but invasive carnivore. Journal of Applied Ecology 50, 459–468.
Saunders, G., Lane, C., Harris, S., and Dickman, C. (2006). Foxes in Tasmania: A report on the incursion of an invasive species. Invasive Animals Cooperative Research Centre, Canberra.
Short, J., and Smith, A. (1994). Mammal decline and recovery in Australia. Journal of Mammalogy 75, 288–297.
| Mammal decline and recovery in Australia.Crossref | GoogleScholarGoogle Scholar |
Sodhi, N. S., and Ehrlich, P. R. (2010). ‘Conservation Biology for All.’ (Oxford University Press: New York.)
Southwell, C., and Fletcher, M. (1985). Investigations into methods of improving the precision of spotlight surveys used for monitoring wallaby populations in Tasmania. Australian National Parks and Wildlife Service, Canberra.
Tasmanian Planning Commission (2009). State of the Environment Tasmania 2009. Available at: http://soer.justice.tas.gov.au/2009/ [accessed 4 March 2010].
Udevitz, M. S., Jay, C. V., and Cody, M. B. (2005). Observer variability in pinniped counts: ground-based enumeration of walruses at haul-out sites. Marine Mammal Science 21, 108–120.
| Observer variability in pinniped counts: ground-based enumeration of walruses at haul-out sites.Crossref | GoogleScholarGoogle Scholar |
Woinarski, J. C. Z., Armstrong, M., Brennan, K., Fisher, A., Griffiths, A. D., Hill, B., Milne, D. J., Palmer, C., Ward, S., Watson, M., Winderlich, S., and Young, S. (2010). Monitoring indicates rapid and severe decline of native small mammals in Kakadu National Park, northern Australia. Wildlife Research 37, 116–126.
| Monitoring indicates rapid and severe decline of native small mammals in Kakadu National Park, northern Australia.Crossref | GoogleScholarGoogle Scholar |