

Effect of mycotoxin deactivator product supplementation on dairy cows
K. Kiyothong A E , P. Rowlinson B , M. Wanapat C and S. Khampa DA Nakhonratchasima Animal Nutrition Research and Development Center, Nakhonratchasima 30130, Thailand.
B School of Agriculture, Food and Rural Development, University of Newcastle, Newcastle-upon-Tyne NE1 7RU, UK.
C Tropical Feed Resources Research and Development Center (TROFREC), Department of Animal Science, Faculty of Agriculture, Khon Kaen University, Khon Kaen 40002, Thailand.
D Faculty of Agricultural Technology, Rajabhat Maha Sarakham University, Maha Sarakham 44000, Thailand.
E Corresponding author. Email: kkiyothong@yahoo.co.uk
Animal Production Science 52(9) 832-841 https://doi.org/10.1071/AN11205
Submitted: 27 September 2011 Accepted: 2 March 2012 Published: 3 July 2012
Journal Compilation © CSIRO Publishing 2012 Open Access CC BY-NC-ND
Abstract
A total mixed ration (TMR) containing a blend of feedstuffs naturally contaminated with harmful mycotoxins was fed for 84 days to 24 primiparous and multiparous Holstein–Friesian × local dairy cows in a randomised complete block design. The dietary treatments consisted of a contaminated TMR diet plus various levels of the mycotoxin deactivator product (MDP) (0, 15, 30 or 45 g/head.day). Deoxynivalenol (DON), fumonisin B1 (FB1), zearalenone (ZON) and ochratoxin A (OTA) were found in the TMR at levels up to 720, 701, 541 and 501 μg/kg, whereas aflatoxin B1 (AfB1) and T-2 toxin (T-2) were found in the TMR at levels of 38 and 270 μg/kg, respectively. Rumen microbial ecology, ruminal volatile fatty acid (VFA) concentrations, ruminal microorganism populations, feed intake, total tract digestibility, milk yield, milk composition and serum immunoglobulin (Ig) concentrations were measured. The results revealed that the ruminal pH, ruminal ammonia nitrogen (NH3-N) concentration, total ruminal VFA concentrations and ruminal bacterial counts were significantly (P < 0.05) higher in supplemented than in non-supplemented cows. Ruminal protozoal counts were significantly (P < 0.05) lower in supplemented than in non-supplemented cows. DM intake, and digestibility of crude protein (CP) and neutral detergent fibre (NDF) were significantly (P < 0.05) higher in supplemented than in non-supplemented cows. Serum IgA concentrations were significantly (P < 0.05) higher in supplemented than in non-supplemented cows. Milk yield and milk protein were significantly (P < 0.05) higher in supplemented than in non-supplemented cows. On the basis of this experiment, it can be concluded that milk production and feed intake can be increased with the addition of MDP to cow diet in the presence of mycotoxins. These increases were accompanied by decreases in the negative effects of mycotoxins on rumen and immune function.
Additional keywords: digestibility, microorganism population, performance, rumen ecology, VFA concentration.
Introduction
Mycotoxin contamination of dairy feeds is a worldwide problem for farmers as mycotoxins can increase the incidence of disease and reduce production efficiency in cattle (Pier 1992; Coulombe 1993). AfB1 reduced cellulose breakdown and production of VFAs and NH3 both in in vivo and in vitro rumen model systems (Mertens 1977). Charmley et al. (1993) observed that 40 g/L fat-corrected milk tended to exhibit a quadratic response to DON concentration in the diet (0, 600 and 1200 μg/kg of DON in concentrate DM). Trenholm et al. (1985) recorded a trend towards decreased grain consumption in cows fed a DON-contaminated ration (640 μg/kg in a grain mix). Korosteleva et al. (2007) found that feeds naturally contaminated with Fusarium mycotoxins can affect the metabolic parameters and immunity of dairy cows. Whitlow and Hagler (2008) reported that mycotoxins affect dairy cows by reducing feed consumption, reducing nutrient utilisation, altering rumen fermentation, suppressing immune function, altering reproduction, irritating tissues and causing cellular death.
Mycofix Plus (Biomin GmbH, Herzogenburg, Austria) is one of several products used to counteract the effects of mycotoxins. This MDP is designed to be incorporated into dairy rations at a range between 15 and 30 g/head.day, depending on the mycotoxin contamination level of feedstuffs. Cheng et al. (2006), Diaz et al. (2005) and Politis et al. (2005) reviewed the effectiveness of this agent and concluded that it has efficacy in counteracting the negative effects of mycotoxins in poultry and swine. Its mode of action is allegedly constituted of three strategies. Polar mycotoxins (e.g. aflatoxins) are adsorbed by the inorganic components, namely, a blend of bentonites and diatomaceous earths in the product (Vekiru et al. 2007). Non-absorbable mycotoxins (e.g. trichothecenes, zearalenone) are biotransformed by biological constituents, namely, Eubacterium strain (BBSH 797) and a yeast strain affiliated to the Trichosporon genus (Trichosporon mycotoxinivorans MTV) (Schatzmayr et al. 2006). Finally, phycophytic substances derived from a species of sea alga (Ascophyllum nodosum) and plant (Silybum marianum) extracts act to compensate for the adverse conditions created by mycotoxins (Pietri et al. 2009). It was hypothesised that milk production and feed intake would increase with the addition of MDP to the cow’s diet in the presence of mycotoxins. It was further hypothesised that these increases would be accompanied by decreases in the negative effects of mycotoxins on the rumen and immune function. We investigated the dose–response of the inclusion of this agent on the rumen ecology, immune function and performance of lactating dairy cows fed a TMR containing a blend of feedstuffs naturally contaminated with harmful mycotoxins. These were, therefore, the objectives of the current study.
Materials and methods
Location of the experimental site, animals and diets
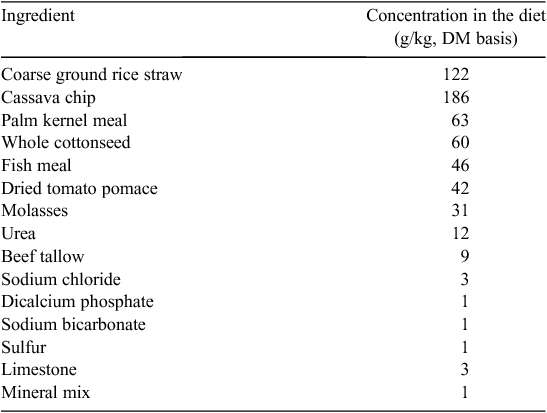
The experiment was conducted at the University farm of Rajamangala University of Technology Isan, Sakon Nakhon Campus, Sakon Nakhon, Thailand, during October 2007 – March 2008. Twenty-four primiparous and multiparous (Holstein–Friesian × Red Sindhi crossbred) dairy cows from the Campus dairy herd were enrolled in the study. The average bodyweight (BW) of the experimental animals was 420 kg, and the average daily milk production was 13.7 kg. Average days in milk at the commencement of the experiment ranged from 63 to 93 days. The experiment was a randomised complete block design, with four dietary treatments and six animals per treatment. At the beginning of the experiment, the cows were blocked according to their previous lactation and days in milk. Previous lactation milk productions were used as a covariate. Within a block, the animals were each randomly allocated to one of the four dietary treatments. The trial consisted of a 2-week adaptation period, followed by a 10-week experimental period. Diets were fed as a TMR containing a blend of feedstuffs naturally contaminated with harmful mycotoxins. Rice straw, cassava chip, palm kernel meal, whole cottonseed, fish meal and dried tomato pomace were the main naturally contaminated feedstuffs used in the TMR. The experimental diet was formulated to meet all the nutritional requirements of a 450-kg multiparous Holstein–Friesian crossbred cows producing 16 kg milk/day (NRC 2001). The ingredients of the experimental diet are presented in Table 1. The MDP used was obtained from Biomin GmbH. Dietary treatments consisted of an identical TMR diet, plus various levels of the MDP (0, 15, 30 or 45 g/head.day), as follows:
|
-
MDP0 = contaminated TMR (control);
-
MDP15 = contaminated TMR + MDP supplementation at 15 g/head.day;
-
MDP30 = contaminated TMR + MDP supplementation at 30 g/head.day; and
-
MDP45 = contaminated TMR + MDP supplementation at 45 g/head.day.
All cows received the control diet during the 2-week adaptation period. Cows were housed individually in a stall barn and fed a TMR twice daily at ~0900 hours and 1600 hours, in quantities to provide ~10% in excess of the expected daily intake for ad libitum consumption. The MDP was divided into two equal portions according to the respective treatments and top-dressed twice daily at ~0900 hours and 1600 hours (feeding of the TMR). Cows were given ad libitum access to water. Cows were milked twice daily at ~0400 hours and 1500 hours by a milking machine (SACCO 115B, SAC, SA Christensen & Co., Kolding, Denmark). Representative feed samples were taken at the beginning of the experiment and then twice monthly for mycotoxin and nutrient content analyses.
Analysis of dietary mycotoxin and nutrient content
Prior to the commencement of the trial, and then twice monthly, the TMR was analysed for the presence of the most important mycotoxins affecting animal performance and health, namely, AfB1, ZON, DON, T-2, OTA and FB1. High-performance liquid chromatography (HPLC; Model Water 600; UV detector, Millipore Corporation, Milford, MA, USA) was used for the analysis of all mycotoxins, except T-2, which was analysed using thin-layer chromatography. The non-detected concentrations are based on the detection limits of each toxin, as follows: AfB1 <4 μg/kg; ZON <32 μg/kg; DON <50 μg/kg; FB1 <100 μg/kg; T-2 <125 μg/kg; and OTA <2 μg/kg.
Feed samples were dried at 60°C in a forced-draught oven for 48 h and the percentage of DM was calculated. Dry samples were ground with a Wiley mill (2-mm screen) (Thomas Scientific, Swedesboro, NJ, USA). Feed samples were analysed for DM, organic matter (OM), ash, ether extract (EE) and N by the AOAC (1990) procedures. NDF, acid detergent fibre (ADF) and acid detergent lignin (ADL) were determined using the methods of Goering and Van Soest (1970).
Experimental measurements and laboratory analyses
BW and feed consumption
Cows were weighed on an electronic scale on two consecutive days every week at the same time of day, and the average of the two weights was calculated. Metabolic BW was calculated using the formula BW0.75 (NRC 2001). Amounts of TMR fed and feed refusals were individually recorded daily. DM intake as a percentage of BW and metabolic BW were also calculated.
Milk production and collection
Individual milk yield was recorded at every milking and summed for each day. About 50-mL samples of a thoroughly mixed composite of milk (morning and afternoon; 60 : 40 v/v) of individual cows were taken weekly for determination of milk composition. The milk samples were analysed for fat, protein, lactose, solids-not-fat, total solids, using the Milko-Scan FT 6000 (Foss Electric, Hillerod, Denmark); somatic cell counts (SCC) using the Fossomatic 5000 (Foss Electric, Hillerod, Denmark); and milk-urea N (MUN) using Sigma kits #640 (Sigma Diagnostics, St. Louis, MO) (Valadares et al. 1999).
Blood collection
Blood was collected from the coccygeal vasculature using the vacutainer system. On the last day of the experiment, one set of blood samples was collected in 6-mL EDTA-coated blood Vacutainer tubes (Becton Dickinson Vacutainer Systems, Franklin Lakes, NJ, USA) for determination of red blood cell (RBC) counts, white blood cell (WBC) counts, and preparation of slides for WBC differentiation. RBC and WBC counts were performed using an electronic cell counter (Sysmax K-800, Toa Medical Instruments, Kobe, Japan). Blood smears were examined microscopically to determine percentages of segmented neutrophil count, lymphocyte count, monocyte count, eosinophil count and basophil count in peripheral blood samples. Vacutainer tubes without anticoagulant were collected for determination of serum Ig concentrations. Blood samples were refrigerated for 1 h and then centrifuged at 3500g for 20 min. Aliquots of serum were harvested from Vacutainer tubes and frozen at −20°C, until analysed for IgG, IgM and IgA concentrations. Concentrations of IgA, IgM and IgG were determined using the radial immunodiffusion technique of Mancini et al. (1965). On the last day of the experiment, blood samples for analysis of blood-urea N (BUN) were obtained in 6-mL Vacutainer tubes without anticoagulant at 0 and 4 h post-feeding via jugular venipuncture (at the same time as ruminal fluid sampling). The blood samples were refrigerated for 1 h and then centrifuged at 3500g for 20 min. Aliquots of serum were harvested from Vacutainer tubes for the immediate determination of BUN concentration according to the method of Roseler et al. (1993).
Ruminal fluid collection
On the last day of the experiment, ruminal fluid samples (200 mL) were collected at 0 and 4 h post-feeding (morning feeding) from each cow. Ruminal fluid samples were collected via a stomach tube connected with a vacuum pump; pH and temperature were recorded using a portable pH and temperature meter (HANNA instrument HI 8424 microcomputer, Singapore). Ruminal fluid samples were then strained through three layers of cheesecloth. The strained fluid samples (10 mL) were collected for measurement of the number of total viable bacteria as well as cellulolytic, amylolytic and proteolytic bacteria by the roll-tube technique (Hungate 1969). The remaining strained fluid samples were then immediately mixed with 5 mL of 2 M H2SO4 to stop microbial activity. Ruminal fluid samples were then centrifuged at 3000g for 10 min and the supernatant (100 mL) was taken and divided into two portions. The first 50-mL portion was kept in a plastic bottle where 5 mL of 1 M H2SO4 was added and frozen (−20°C) for later NH3-N and VFA analyses. The second 50-mL portion was kept in a plastic bottle, immediately fixed with 10% formalin solution (1 : 9 v/v, ruminal fluid : 10% formalin) (Galyean 1989) and stored at 4°C for later measurement of the ruminal microbial populations. Ruminal fluid was analysed for NH3-N by using the hypochlorite–phenol procedure (Beecher and Whitten 1970) and VFA by using HPLC, according to the method of Samuel et al. (1997). The total direct counts of bacteria, protozoa (holotrichs and entodiniomorphs) and fungal zoospores were made using the methods of Galyean (1989) based on the use of a haemocytometer (Boeco, Hamburg, Germany).
Faecal collection
Faecal samples were collected daily from rectum for the last 3 days of the experiment from each cow. The faeces of each cow was mixed thoroughly, and a subsample (500 g) was dried at 60°C in a forced-draught oven for 48 h. Dry samples were ground with a Wiley mill (2-mm screen). Faecal samples were analysed for DM, OM, ash, EE, N, NDF, ADF (methods cited previously), and acid-insoluble ash by the procedure of Van Keulen and Young (1977), which was used as an internal indicator to calculate digestion coefficients of the feed.
Statistical analyses
Repeated-measures data over time and within animal were averaged before analysis. The various data were subjected to the ANOVA procedure for a randomised complete block design experiment using the general linear models of the SAS System for Windows (SAS Institute Inc. 1989), with the following model:

where yijk = an observation from the ith cow, jth parity, kth treatment; μ = the grand mean; Pi = effect of the ith parity; Tj = effect of the jth treatment; PTij = effect of the parity by treatment interaction; and Cijk = random experimental error.
Treatment means were compared using least significant difference (l.s.d.) test (Steel and Torrie 1980). Linear and quadratic effects of increasing levels of MDP in diets were tested using orthogonal contrasts. Significance was declared at P = 0.05. A trend was considered to exist if 0.05 < P ≤ 0.10. All means presented are least square means.
Results
Nutrient composition of the experimental diets
The OM, CP, NDF, ADF, ADL, EE and ash of the experimental diet were 925, 153, 380, 274, 29, 38 and 75 g/kg of DM, respectively. This finding indicates that nutrient composition of the experimental diet met all nutrient requirements of a 450-kg multiparous Holstein–Friesian crossbred cow producing 16 kg milk/day (NRC 2001).
Concentrations of major mycotoxins in the experimental diets
DON, FB1, ZON and OTA were the major contaminants found in the TMR at concentrations of up to 720, 701, 541 and 501 μg/kg, whereas AfB1 and T-2 were the minor contaminants found in the TMR at concentrations of 38 and 270 μg/kg, respectively. This finding is in agreement with Spahr et al. (1999), Whitlow and Hagler (2005) and Driehuis et al. (2008) who reported that DON has the greatest prevalence in feedstuffs. These findings suggest that the experimental diets are contaminated with harmful mycotoxins.
Rumen ecology, BUN and MUN
Table 2 shows the results obtained concerning the effects of the level of the MDP supplementation on rumen ecology, BUN and MUN. The ruminal pH was significantly (P < 0.05) higher in supplemented (6.6, 6.6 and 6.7, according to the supplement level) than in non-supplemented (6.1) cows, but there were no significant differences among the supplemented cows, and the pH increased linearly with the increasing level of MDP. Ruminal NH3-N concentration was significantly (P < 0.05) higher in supplemented than in non-supplemented cows, but there were no significant differences among supplemented cows; the concentration increased linearly with the increasing level of MDP. There was no difference among treatments for MUN.

|
VFA concentrations
The experimental data on VFA concentrations are shown in Table 3. Total ruminal VFA concentrations were significantly (P < 0.05) higher in supplemented than in non-supplemented cows, but there were no significant differences between MDP15 and MDP45 cows, and the VFA increased linearly with the increasing level of MDP. Molar proportions of ruminal acetate were significantly (P < 0.05) lower in supplemented than in non-supplemented cows, but there were no significant differences among supplemented cows; the proportions decreased linearly with the increasing level of MDP.

|
Conversely, molar proportions of propionate were significantly (P < 0.05) higher in supplemented than in non-supplemented cows, but there were no significant differences between MDP15 and MDP30 cows; the proportions increased linearly with the increasing level of MDP. There was no difference among treatments for molar proportions of butyrate. Inevitably, the results for the acetate : propionate ratio followed the trends for the acetate and propionate levels. The ruminal acetate : propionate ratio was significantly (P < 0.05) lower in supplemented than in non-supplemented cows, but there were no significant differences among supplemented cows, and the ratio decreased linearly with an increasing level of MDP. Acetate proportions were numerically higher, and propionate proportions were numerically lower for non-supplemented than for supplemented cows, causing an increased acetate:propionate ratio.
Populations of ruminal microorganisms
Ruminal bacterial counts were significantly higher, and increased linearly with the increasing level of MDP, whereas protozoal counts were lower, and decreased linearly with the increasing level of MDP, in supplemented than in non-supplemented cows, but there were no significant differences among supplemented cows. Ruminal fungal-zoospore counts were significantly higher in supplemented than in non-supplemented cows, but there were no significant differences between MDP30 and MDP45 cows, and the counts increased linearly with the increasing level of MDP. Total viable-bacterial counts were significantly higher in supplemented than in non-supplemented cows, but there were no significant differences between MDP30 and MDP45 cows. Amylolytic bacterial counts were significantly higher in supplemented than in non-supplemented cows, but there were no significant differences among supplemented cows. Proteolytic bacterial counts were significantly higher in supplemented than in non-supplemented cows, but there were no significant differences between MDP15 and MDP30, or MDP30 and MDP45 cows. Cellulolytic bacterial counts were significantly higher in supplemented than in non-supplemented cows, but there were no significant differences between MDP30 and MDP45 cows, and they increased linearly with the increasing level of MDP (Table 4).

|
Feed intake and changes in BW
Table 5 presents the experimental data on feed intake and liveweight change. The DM intake was significantly higher (P < 0.05) in supplemented than in non-supplemented cows, but there were no significant differences among the supplemented cows, and the DM intake increased linearly with the increasing level of MDP. There was no difference among treatments for BW changes.

|
Digestion coefficients
Table 6 shows digestion coefficients. There were no differences among treatments for the digestibility of DM, OM, ADF and EE; however, the digestibility of DM and OM tended to be higher for supplemented than for non-supplemented cows. The digestibility of CP and NDF was significantly higher (P < 0.05) in supplemented than in non-supplemented cows, but there were no significant differences between MDP30 and MDP45 cows, and the digestibility of CP and NDF increased linearly with the increasing level of MDP.

|
Haematology, serum immunoglobulin concentrations and SCC
The effect of the level of the MDP supplementation on haematology, serum immunoglobulin concentrations and SCC are presented in Table 7. There was no difference among treatments for the percentage of basophils. RBC counts were significantly (P < 0.05) higher in supplemented than in non-supplemented cows, but there were no significant differences between MDP15 and MDP30 cows, and RBCs increased linearly with the increasing level of MDP. WBC counts, and percentages of segmented neutrophils, eosinophil, lymphocyte and monocytes were significantly (P < 0.05) higher in supplemented than in non-supplemented cows, but there were no significant differences among supplemented cows, and they increased linearly with the increasing level of MDP.

|
There were no differences among treatments for serum IgG and IgM concentrations. Serum IgA concentrations were significantly (P < 0.05) higher in supplemented than in non-supplemented cows, but there were no significant differences between MDP30 and MDP45, and the serum IgA concentrations increased linearly with the increasing level of MDP. The SCC were significantly (P < 0.05) lower in supplemented than in non-supplemented cows, but there were no significant differences between MDP30 and MDP45 cows, and the SCC decreased linearly and quadratically with the increasing level of MDP.
Milk production and composition
Milk yield and milk protein were significantly (P < 0.05) higher in cows fed the supplemented diet than in those fed the control diet, but there were no significant differences among the supplemented cows, and milk yield and protein increased linearly with the increasing level of MDP. Milk production was numerically highest for the MDP45 cows (Table 8). There were no differences among treatments for milk fat, lactose, solids-not-fat or total solids; however, milk fat percentage tended to be higher for supplemented than for non-supplemented cows.

|
Discussion
Rumen ecology, BUN and MUN
It is interesting to note that the ruminal pH of non-supplemented cows was below 6.2, whereas supplemented cows were in the normal range (6.6–6.7) and stable. Lyle et al. (1981), Hoover (1986) and Firkins (1996) stated that the pH range for optimal ruminal microbial digestion is 6.5–7.0. The low ruminal pH of the non-supplemented cows may have led to lower NDF digestibility and reduced bacterial populations compared with supplemented cows (Tables 4, 6).
The higher NH3-N concentrations of supplemented cows may be reflected in greater numbers of rumen microbes. The greater number of rumen microbes in the supplemented cows may be explained by the fact that trichothecene toxins, ZON and OTA in experimental diets may be detoxified by the MDP and AfB1 may be adsorbed by the inorganic components, resulting in the removal of the suppression on microbial growth and activity. These microbes in turn ferment more feed, and generate more VFAs and a greater supply of microbial N for the supplemented cows. This also allows the supplemented cows to consume more feed as it is disappearing from the rumen faster. The experimental diet contained urea which is used as a N source for microbial protein synthesis in the rumen, and as more feed was consumed by supplemented cows, this lead to a higher ruminal NH3-N concentration. The present results show that the MDP supplementation increased the NH3-N concentration, with NH3 being the main N source for growth and protein synthesis by ruminal bacteria to achieve maximum fermentation. These results are in agreement with those of Dänicke et al. (2005) who reported an elevation in rumen NH3 concentration and a reduction in duodenal flow of microbial protein in cows fed DON. Another important finding was that supplementation with MDP in this trial resulted in ruminal NH3-N production close to the optimal ruminal NH3-N (15–30 mg/dL), as stated by Erdman et al. (1986), for increasing microbial protein synthesis, feed digestibility and voluntary feed intake. Overall, MUN concentrations were above the recommended maximum of 16 mg/dL (Ferguson et al. 1993).
VFA concentrations
The MDP supplementation had a positive influence in maintaining the ruminal VFA concentrations. The positive effects of the MDP supplementation on total VFA concentrations and molar proportions of individual VFAs could be due to reduced protozoal and increased bacterial populations, since acetate and butyrate are the major fermentation end products of protozoa (Jouany 1994). The higher propionate concentration may reflect increased propionate, and subsequently increased gluconeogenesis and a higher milk production observed (Table 8).
Populations of ruminal microorganisms
It is interesting to note that the populations of total bacteria, total fungal zoospores, total viable bacteria, amylolytic bacteria, proteolytic bacteria and cellulolytic bacteria increased, while protozoal population decreased when the diet was supplemented with MDP in the current trial. These results show that the MDP played an important role in changing ruminal microbial populations. A possible explanation for the greater numbers of rumen microbes in supplemented cows, and their subsequent effects have already been discussed previously. Lower populations of ruminal bacteria in non-supplemented cows in the current study were possibly associated with a fall in ruminal pH below 6.2 (Russell and Wilson 1996; Rode 2008). A fall in ruminal pH of non-supplemented cows may be explained by the fact that toxicity from harmful mycotoxins in contaminated feedstuffs may overwhelm the buffering and absorptive capacity of the animals, leading to reductions in ruminal pH. The lower ruminal pH of non-supplement cows may result from the large amount of fusaric acid produced by various Fusarium toxins in experimental diets, leading to reductions in ruminal pH. It seems possible that the higher ruminal pH of supplemented cows is due to various Fusarium contamination being detoxified by the MDP, resulting in a normal ruminal pH range (6.6–6.7). It is likely, therefore, that the absence of the ruminal protozoal population in supplemented cows in the current study could have affected ruminal microbial protein synthesis since the major negative impact of protozoa is their effect on ruminant’s protein metabolism (Leng 1990; Rode 2008).
Feed intake and changes in BW
The present findings are in agreement with those of Whitlow and Hagler (2008), who found that mycotoxins affect dairy cows by reducing feed consumption. Trenholm et al. (1985) recorded a trend towards decreased grain consumption in cows fed a DON-contaminated ration (640 μg/κg in a grain mix). BWs of cows in the current experiment were unaffected by diet. The cows used were mature; thus, all animals in all treatment groups could maintain liveweight throughout the experimental period.
Haematology, serum immunoglobulin concentrations and SCC
Immunoglobulin A is the major Ig in external secretions. In serum, it functions as a second line of defence, mediating the elimination of pathogens that have breached the mucosal surface (Woof and Kerr 2004). Milk SCC is a widely used marker for both udder health and milk quality (O’Brien et al. 2001).
The lower WBC counts, percentages of segmented neutrophils, eosinophil, lymphocytes, monocytes and concentrations of serum IgA in cows fed the control diet than in those fed the supplemented diet illustrate the immunosuppressive effect of mycotoxins. The higher SCC in cows fed the control diet than in those fed the supplemented diet illustrates the adverse effect of mycotoxins on the udder health of dairy cows. The immune system is a target of several important mycotoxins such as T-2, DON and aflatoxins (Bondy and Pestka 2000). Aflatoxins can have negative effects on functionality of the immune system, predisposing cattle to infectious diseases. The general effects of aflatoxins on the immune system are related either to cellular response (reduction in phagocytosis of macrophages, lymphoblast genesis, delay of coetaneous hypersensivity) or humoral factors (reduction of IgA and IgG plasma concentration, complement activity, and bactericidal activity of plasma) (CAST 2003).
The current results are in agreement with those of Whitlow and Hagler (2008) who found that mycotoxins affect dairy cows by suppressing immunity. Gentry et al. (1984) demonstrated a reduction in WBC and neutrophil counts in calves receiving T-2. Korosteleva et al. (2007) found that the reduction in concentrations of serum IgA in cows fed the contaminated diet illustrates the immunosuppressive effect of Fusarium mycotoxins (fumonisins and DON). Mann et al. (1982) showed a decline in total serum IgA in T-2 -treated calves. The results of the present study indicate that the MDP supplementation could positively affect the immune system function and health of dairy cows. The higher WBC counts, percentages of segmented neutrophils, eosinophils, lymphocytes, monocytes and concentrations of serum IgA in cows fed the supplemented diet than in those fed the control diet illustrate the effect of the MDP in supporting the immune system. The lower SCC in cows fed the supplemented diet than in those fed the control diet illustrates the better udder health of the supplemented group. The MDP is provided with a blend of selected brown algae (Ascophyllum nodosum) and plant (Silybum marianum) extracts that are able to eliminate toxin-related effects by supporting the immune system (Pietri et al. 2009). These findings seem to be consistent with Cheng et al. (2006), Diaz et al. (2005) and Politis et al. (2005), who reported that the MDP has proven efficacy in the counteraction of the negative impacts of mycotoxins in animal health.
Milk production and composition
These results from the current study indicate that contamination of various mycotoxins in experimental diets that got into the rumen reduced milk production, whereas the MDP supplementation had a positive influence, increasing the milk production. Cheng et al. (2006), Diaz et al. (2005) and Politis et al. (2005) all similarly reported that MDP counteracted the negative effects of mycotoxins on milk production. Whitlow et al. (1994) found that average milk production was correlated with the level of DON contamination of feedstuffs (500–900 μg/kg). Whitlow and Hagler (2008) reported that mycotoxins affect dairy cows by reducing milk production. However, these findings are in contrast with those of Korosteleva et al. (2007), who observed that feeding a TMR naturally contaminated with DON (32–36 μg/kg) for 56 days to lactating cows did not cause a reduction in milk production. This inconsistency may be due to the animals in the current trial being fed with a higher level of DON-contaminated TMR (720 μg/kg) and over a longer feeding period (84 days). The higher milk production of supplemented cows in the present study resulted from higher feed intake (Table 5), which was assumed to supply a higher level of nutrients than that of the non-supplemented cows.
Biologically optimal response
The biologically optimal response to MDP was at the 15 g/head.day dose. Consequently, this was also the economic optimum for the present study.
Conclusions and recommendations
On the basis of the results from the study, it can be concluded that feeds naturally contaminated with harmful mycotoxins can adversely affect the metabolic parameters, immune function and milk production of dairy cows. Milk production and feed intake can be increased with the addition of MDP to cow diet in the presence of mycotoxins. These increases were accompanied by decreases in the negative effects of mycotoxins on the rumen and immune function. As MDP has several potential active constituents, further experiments to ascertain which ones are responsible for which of the observed effects are required.
References
AOAC (1990) ‘Official methods of analysis.’ 15th edn. (Association of Official Analytical Chemists: Arlington, VA)Beecher GR, Whitten BK (1970) Ammonia determination: reagents modification and interfering compounds. Analytical Biochemistry 36, 243–246.
| Ammonia determination: reagents modification and interfering compounds.Crossref | GoogleScholarGoogle Scholar | 1:CAS:528:DyaE3cXkvVCnurc%3D&md5=bc2fc2008996d7186f84960399be2bdbCAS |
Bondy GS, Pestka JJ (2000) Immunomodulation by fungal toxins. Journal of Toxicology and Environmental Health, Part B 3, 109–143.
| Immunomodulation by fungal toxins.Crossref | GoogleScholarGoogle Scholar | 1:CAS:528:DC%2BD3cXjtVeks78%3D&md5=fb2b3ebbd2d6007945189f5423df5d72CAS |
CAST (2003) ‘Mycotoxins: risks in plant, animal, and human systems.’ Task Force Report 139. (Council for Agricultural Science and Technology: Ames, IA)
Charmley E, Trenholm HL, Thompson BK, Vudathala D, Nicolson JWG, Prelusky DB, Charmley LL (1993) Influence of level of deoxynivalenol in the diet of dairy cows on feed intake, milk production, and its composition. Journal of Dairy Science 76, 3580–3587.
| Influence of level of deoxynivalenol in the diet of dairy cows on feed intake, milk production, and its composition.Crossref | GoogleScholarGoogle Scholar | 1:CAS:528:DyaK2cXisFCk&md5=debc2b776d91128d5c89fb0a68411d8aCAS |
Cheng YH, Weng CF, Chen BJ, Chang MH (2006) Toxicity of different Fusarium mycotoxins on growth performance, immune responses and efficacy of a mycotoxin degrading enzyme in pigs. Animal Research 55, 579–590.
| Toxicity of different Fusarium mycotoxins on growth performance, immune responses and efficacy of a mycotoxin degrading enzyme in pigs.Crossref | GoogleScholarGoogle Scholar | 1:CAS:528:DC%2BD2sXislCltLc%3D&md5=9cb6c0147269ec9ca7c70c3cad2eafccCAS |
Coulombe RA (1993) Symposium: biological action of mycotoxins. Journal of Dairy Science 76, 880–891.
| Symposium: biological action of mycotoxins.Crossref | GoogleScholarGoogle Scholar | 1:CAS:528:DyaK3sXhs1amtrs%3D&md5=c5d13ffe301ed2ae5b78866adcc0cdbdCAS |
Dänicke S, Matthaus K, Lebzien P, Valenta H, Stemme K, Ueberschar KH, Razzazi-Fazeli E, Bohm J, Flachowsky G (2005) Effects of Fusarium toxin-contaminated wheat grain on nutrient turnover, microbial protein synthesis and metabolism of deoxynivalenol and zearalenone in the rumen of dairy cows. Journal of Animal Physiology and Animal Nutrition 89, 303–315.
| Effects of Fusarium toxin-contaminated wheat grain on nutrient turnover, microbial protein synthesis and metabolism of deoxynivalenol and zearalenone in the rumen of dairy cows.Crossref | GoogleScholarGoogle Scholar |
Diaz GJ, Cort’es A, Rold’an L (2005) Evaluation of the efficacy of four feed additives against the adverse effects of T-2 toxin in growing broiler chickens. Journal of Applied Poultry Research 14, 226–231.
Driehuis F, Spanjer MC, Scholten JM, Te Giffel MC (2008) Occurrence of mycotoxins in maize, grass and wheat silage for dairy cattle in the Netherlands. Food Additives and Contaminants 1, 41–50.
| Occurrence of mycotoxins in maize, grass and wheat silage for dairy cattle in the Netherlands.Crossref | GoogleScholarGoogle Scholar | 1:CAS:528:DC%2BD1cXhtVyrsLvO&md5=5ae0a26431269a4b5a7565cf698dbad5CAS |
Erdman RA, Proctor GH, Van Dersall JH (1986) Effect of rumen ammonia concentration on in situ rate and extent of digestion of feedstuffs. Journal of Dairy Science 69, 2312–2320.
| Effect of rumen ammonia concentration on in situ rate and extent of digestion of feedstuffs.Crossref | GoogleScholarGoogle Scholar | 1:STN:280:DyaL2s%2FlvVemsQ%3D%3D&md5=9a1b77c6a62159c5bec19e7d234b8c7dCAS |
Ferguson J, Galligan D, Blanchard T, Reeves M (1993) Serum urea nitrogen and conception rate the usefulness of test information. Journal of Dairy Science 76, 3742–3746.
| Serum urea nitrogen and conception rate the usefulness of test information.Crossref | GoogleScholarGoogle Scholar | 1:STN:280:DyaK2c7nvFKitQ%3D%3D&md5=3b04595a978a93f30db04d60913a19f2CAS |
Firkins JL (1996) Maximizing microbial protein-synthesis in the rumen. The Journal of Nutrition 126, 1347–1354.
Galyean M (1989) Laboratory procedure in animal nutrition research. Department of Animal and Life Science, New Mexico State University, Las Cruces, NM.
Gentry PA, Ross ML, Chan PKC (1984) Effect of T-2 toxin on bovine hematological and serum enzyme parameters. Veterinary and Human Toxicology 26, 24–28.
Goering H, Van Soest K (1970) ‘Forage fibre analysis. Agriculture hand book No.379.’ (United State Department of Agriculture: Washington, DC)
Hoover WH (1986) Chemical factors involved in ruminal fibre digestion. Journal of Dairy Science 69, 2755–2766.
| Chemical factors involved in ruminal fibre digestion.Crossref | GoogleScholarGoogle Scholar | 1:CAS:528:DyaL2sXhsleitw%3D%3D&md5=86b0984c7988a44754056ea8c002d3fdCAS |
Hungate RE (1969) A roll tube method for cultivation of strict anaerobes. In ‘Methods in microbiology. Vol. 3B’. (Eds JR Norris, DW Ribbons) pp. 117–132. (Academic Press: London)
Jouany JP (1994) Manipulation of microbial activity in the rumen. Archives of Animal Nutrition 46, 133–153.
Korosteleva SN, Smith TK, Boermans HJ (2007) Effects of feedborne Fusarium mycotoxins on the performance, metabolism and immunity of dairy cows. Journal of Dairy Science 90, 3867–3873.
| Effects of feedborne Fusarium mycotoxins on the performance, metabolism and immunity of dairy cows.Crossref | GoogleScholarGoogle Scholar | 1:CAS:528:DC%2BD2sXot1Olur4%3D&md5=7f84d5be8b519f471df2d867a1b581b9CAS |
Leng RA (1990) Forage utilisation by ruminants. Nutrition Research Reviews 3, 277–303.
| Forage utilisation by ruminants.Crossref | GoogleScholarGoogle Scholar | 1:STN:280:DC%2BD1M%2FktVSgsw%3D%3D&md5=d6d332699aa911f1e43a22dc394f23c5CAS |
Lyle RR, Johnson RR, Wilhite JV, Backus WR (1981) Ruminal characteristics in steers as affected by adaptation from forage to all concentrate diets. Journal of Animal Science 53, 1383–1388.
Mancini GA, Carbonara O, Heremans JF (1965) Immunochemical quantification of antigens by single radial immunodifusion. Immunochemistry 2, 235–254.
| Immunochemical quantification of antigens by single radial immunodifusion.Crossref | GoogleScholarGoogle Scholar | 1:CAS:528:DyaF2MXltVaitrg%3D&md5=de55c2a00a0aeaaa02de4aee322530adCAS |
Mann DD, Buening MGM, Hook BS, Osweiler GD (1982) Effect of T-2 toxin on the bovine immune system: humoral factors. Infection and Immunity 36, 1249–1252.
Mertens DR (1977) Biological effects of mycotoxins upon rumen function in lactating dairy cows. In ‘Interactions of mycotoxins in animal production’. pp. 118–136. (National Academy Press: Washington, DC)
NRC (2001) ‘Nutrient requirements of dairy cattle.’ 7th edn. (National Academy Press: Washington, DC)
O’Brien CN, Guidry AJ, Douglass LW, Westhoff DC (2001) Immunization with Staphylococcus aureus Lysate incorporated into microspheres. Journal of Dairy Science 84, 1791–1799.
| Immunization with Staphylococcus aureus Lysate incorporated into microspheres.Crossref | GoogleScholarGoogle Scholar | 1:CAS:528:DC%2BD3MXmtFaqurs%3D&md5=73ca7e3e917f1bc15c14a38a3cd84b66CAS |
Pier AC (1992) Major biological consequences of aflatoxicosis in animal production. Journal of Animal Science 70, 3964–3970.
Pietri A, Bertuzzi T, Piva G, Binder EM, Schatzmayr D, Rodrigues I (2009) Aflatoxin transfer from naturally contaminated feed to milk of dairy cows and the efficacy of a mycotoxin deactivating product. International Journal of Dairy Science 4, 34–42.
| Aflatoxin transfer from naturally contaminated feed to milk of dairy cows and the efficacy of a mycotoxin deactivating product.Crossref | GoogleScholarGoogle Scholar | 1:CAS:528:DC%2BD1MXosVehu7Y%3D&md5=510d3332bc70941392b682702d2aba07CAS |
Politis I, Fegeros K, Nitsch S, Schatzmayr G, Kantas D (2005) Use of Trichosporon mycotoxinivorans to suppress the effects of ochratoxicosis on the immune system of broiler chicks. British Poultry Science 46, 58–65.
| Use of Trichosporon mycotoxinivorans to suppress the effects of ochratoxicosis on the immune system of broiler chicks.Crossref | GoogleScholarGoogle Scholar | 1:STN:280:DC%2BD2M3gtFehtQ%3D%3D&md5=91a284f53e7a9124b0ea9615620a0668CAS |
Rode LM (2008) ‘Maintaining a healthy rumen – An overview.’ Available at http://www.wcds.afns.ualberta.ca/Proceedings/2000/Chapter10.htm [verified 5 August 2009].
Roseler DK, Ferguson JD, Sniffen CJ, Herrema J (1993) Dietary protein degradability effects on plasma and milk urea nitrogen and milk non-protein in Holstein cows. Journal of Dairy Science 76, 525
| Dietary protein degradability effects on plasma and milk urea nitrogen and milk non-protein in Holstein cows.Crossref | GoogleScholarGoogle Scholar | 1:CAS:528:DyaK3sXitFWrsrY%3D&md5=1c484bcb74b5ec0af38a4ae25c4b89caCAS |
Russell JB, Wilson DB (1996) Why are ruminal cellulolytic bacteria unable to digest cellulose at low pH? Journal of Dairy Science 79, 1503–1509.
| Why are ruminal cellulolytic bacteria unable to digest cellulose at low pH?Crossref | GoogleScholarGoogle Scholar | 1:CAS:528:DyaK28Xlsleltr4%3D&md5=6be7fbe5a911417b8be2c762f8194b25CAS |
Samuel M, Sagathewan S, Thomas J, Methen G (1997) An HPLC method for estimation of volatile fatty acid of ruminal fluid. Journal of Animal Science 67, 805–807.
SAS Institute Inc. (1989) ‘SAS/STAT user’s guide: version 6.’ 4th edn. (SAS Institute Inc.: Cary, NC)
Schatzmayr G, Zehner F, Schatzmayr D, Töaubel M, Binder EM (2006) Microbiologicals for deactivating mycotoxins in contaminated feed. Molecular Nutrition & Food Research 50, 543–551.
| Microbiologicals for deactivating mycotoxins in contaminated feed.Crossref | GoogleScholarGoogle Scholar | 1:CAS:528:DC%2BD28XmtFSmsr4%3D&md5=f22822192e8a20d243733e9b856893b6CAS |
Spahr U, Walther B, Sieber R, Gafner JL, Guidon D (1999) Occurrence of mycotoxins in feeds and carries over into milk. A review. Mitteilungen Lebensmittel und Hygiene 90, 575–609.
Steel RGD, Torrie JH (1980) ‘Principles and procedures of statistics: a biometrical approach.’ 2nd edn. (McGraw-Hill Inc.: New York)
Trenholm HL, Thompson BK, Hartin KE, Greenhalgh R, McAlister AJ (1985) Ingestion of vomitoxin (deoxynivalenol) contaminated wheat by nonlactation dairy cows. Journal of Dairy Science 68, 1000–1005.
| Ingestion of vomitoxin (deoxynivalenol) contaminated wheat by nonlactation dairy cows.Crossref | GoogleScholarGoogle Scholar | 1:CAS:528:DyaL2MXktVGisbk%3D&md5=2447bea5800d8f1bb1bb1860b3a777daCAS |
Valadares RFD, Broderick GA, Valadares Filho SC, Clayton MK (1999) Effect of replacing alfalfa silage with high moisture corn on ruminal protein synthesis estimated from excretion of total purine derivatives. Journal of Dairy Science 82, 2686–2696.
Van Keulen J, Young BA (1977) Evalution of acid insoluble ash as natural marker in ruminant digestibility studies. Journal of Animal Science 44, 282–287.
Vekiru E, Fruhauf S, Sahin M, Ottner F, Schatzmayr G, Krska R (2007) Investigation of various adsorbents for their ability to bind aflatoxin B1. Mycotoxin Research 23, 27–33.
| Investigation of various adsorbents for their ability to bind aflatoxin B1.Crossref | GoogleScholarGoogle Scholar | 1:CAS:528:DC%2BD2sXhtF2htrjN&md5=ce28243766936ca6e9219cad2f03ac1cCAS |
Whitlow LW, Hagler WM, Jr (2005) Mycotoxins: a review of dairy concerns. Available at https://www.sdstate.edu/vs/../Whitlow-Mycotoxins-MSRNC-2005.pdf [verified 1 June 2012]
Whitlow LW, Hagler WM, Jr (2008) ‘Mold and mycotoxin issues in dairy cattle: effects, prevention and treatment.’ Available at http://www.extension.org/pages/Mold_and_Mycotoxin_Issues_in_Dairy_Cattle:_Effects,_Prevention_and_Treatment [verified 1 August 2009]
Whitlow LW, Nebel RL, Hagler WM, Jr (1994) The association of deoxynivalenol in grain with milk production loss in dairy cows. In ‘Biodeterioration research 4: mycotoxins, wood decay, plant stress, biocorrosion, and general biodeterioration’. (Eds GC Liewellyn, WV Dashek, CE O’Rear) pp. 131–140. (Plenum Press: New York)
Woof JM, Kerr MA (2004) IgA function – variations on a theme. Immunology 113, 175–177.
| IgA function – variations on a theme.Crossref | GoogleScholarGoogle Scholar | 1:CAS:528:DC%2BD2cXot1Khsr8%3D&md5=17f216a14400771cd4830331847f4969CAS |