Triaxial versus Spherical Dark Matter Halo Profiles
Alexander Knebe A B and Volkmar Wießner AA Astrophysikalisches Institut Potsdam, 14482 Potsdam, Germany
B Corresponding author. E-mail: aknebe@aip.de
Publications of the Astronomical Society of Australia 23(3) 125-128 https://doi.org/10.1071/AS06013
Submitted: 26 April 2006 Accepted: 13 September 2006 Published: 24 November 2006
Abstract
When analyzing dark matter halos forming in cosmological n-body simulations, it is common practice to obtain the density profile utilizing spherical shells. However, it is also known that the systems under investigation are far from spherically symmetric but, rather, follow a triaxial mass distribution. In this study we present an estimator for the error introduced by spherically averaging an elliptical mass distribution. We systematically investigate the differences arising when using a triaxial density profile under the assumption of spherical symmetry. We show that the variance in the density can be as large as 50% in the outer parts of dark matter halos for extreme (but still credible) axis ratios of 0.55:0.67:1. The inner parts are less affected but still show a scatter at the 16% level for these prolate systems. For more moderate ellipticities, i.e. axis ratios of 0.73:0.87:1, the error is smaller but still as large as 10–20% depending on distance. We further provide a simple formula that allows estimation of this variance as a function of radius for arbitrary axis ratios. We conclude that highly prolate and/or oblate systems are better fit by analytical profiles that take into account the triaxial nature of cosmological objects.
Keywords: cosmology: theory
Introduction
The current standard model of structure formation, in which the Universe is dominated by cold dark matter, predicts that the radial density profile of dark matter halos is best described by the functional form proposed by Navarro, Frenk, & White (1997) (hereafter NFW):

with the two fitting parameters ρc and rs, and where α was found to be equal to unity, i.e. α = 1.
During the last decade great strides have been made in verifying and better understanding the origin of this density profile of dark matter halos forming in cosmological n-body simulations.The functional form proposed by NFW is independent of cosmology and the two fitting parameters ρc and rs are actually related. Eqn (1) therefore describes a one-parameter family of functions. While Navarro et al. (1997) still relied on systems containing of the order 104 particles (and hence resolving the profile down to about 10% of the virial radius, according to the convergence criteria of Power et al. 2003), studies containing about two orders of magnitude more particles within the virial radius were only able to confirm their findings (e.g. Fukushige & Makino 1997, 2001; Moore et al. 1998; Jing 2000; Jing & Suto 2000, 2002). However, there has been a debate about the exact value of the logarithmic inner slope, which ranges from α ∼ 1 to 1.5 (e.g. Navarro et al. 1997; Moore et al. 1999). Recently a great deal of effort has gone into even higher resolution simulations which have revealed density profiles of cold dark matter halos down to scales well below one percent of the virial radius (Fukushige, Kawai, & Makino 2004; Tasitsiomi et al. 2004; Navarro et al. 2004; Reed et al. 2005; Diemand, Moore, & Stadel 2004). The highest resolved simulation to date reached an effective mass resolution of about 130 million particles in a cluster-sized dark matter halo still supporting the evidence for a central cusp with a logarithmic inner slope of about α ∼ 1.2 (Diemand et al. 2005). However, these steep central density cusps are not supported by observations. By measuring the rotation curve of a galaxy, one can in principle infer the density profile of its dark matter halo. However, high resolution observations of low surface brightness galaxies are best fit by halos with a core of constant density (Simon et al. 2005; Swaters et al. 2003; de Block & Bosma 2002). This discrepancy between the prediction of theory and actual observations has caught the attention of cosmologists for nearly a decade now and is far from being resolved.
Aside from addressing the mass distribution of dark matter halos from a simulator’s point of view, a fair amount of labour went into a theoretical understanding of the origin of the NFW profile, Eqn (1). But only when making strong assumptions about a connection between the density and the velocity dispersion can one can make analytical predictions. For example, under the assumption that the phase-space density is a power law in radius, as suggested by Taylor & Navarro (2001), one can solve the spherical Jeans’ equation to obtain the density profile (Dehnen & McLaughlin 2005; Austin et al. 2005; Hansen 2004). These studies, guided by the results of the numerical simulations, confirm the inner logarithmic slope to be in the range α ∼ 1 to 2. But see also Hansen & Stadel (2006) for recent claims that equilibrated dark matter structures have a central slope of α ∼ 0.8.
It needs to be mentioned that (nearly) all these studies are based upon the assumption of spherical symmetry utilizing radially distributed shells. Jing & Suto (2002) already noted, however, that halo density profiles as found in cosmological simulations are better fit by applying an elliptical or triaxial modeling of dark matter halos. Detailed investigations of the distributions of shapes of halos forming in cosmological n-body simulations now demonstrate that the majority of objects have intrinsic shapes best characterized by axis ratios of about 1:0.74:0.64 (e.g. Kasun & Evrard 2005; Bailin & Steinmetz 2005; Allgood et al. 2006). Oguri et al. (2005), for instance, showed that such prolate mass distributions can have a significant influence on the interpretation of lensing signals observed in galaxy clusters, i.e. halo triaxiality may act to bias the profile constraints derived under the assumption of a spherically symmetric mass distribution. It therefore appears mandatory to systematically study the error introduced by the supposition that halo profiles are spherical while their actual distribution is triaxial. Can the debate about the central cusp be connected to this error? Answering this question is the major motiviation for the current study.
The Equations
A model for a triaxial NFW density profile is given by, for instance, Jing & Suto (2002) and reads as follows:

where the relations between the spherical and elliptical coordinates for a given Cartesian point x, y, z,

depend on the axes a < b < c of the ellipsoid and hence the degree of triaxiality T (e.g. Franx, Illingworth, & de Zeeuw 1991)

If we now average the triaxial density ρ(R) on the surface of a sphere with radius r

where ρ(R) = ρ(R(r, θ, φ)) is a function of r, θ, and φ through Eqn (3), we can obtain a measure for the error for the variation of the actual density ρ(R) by calculating the dispersion

We need to stress that this quantity is, per definition, the typical dispersion in the density for points on the surface of a sphere of a given radius due to the ellipticity of the halo. Hence there are parts on the sphere with values larger than the spherically averaged density as well as parts with lower densities. However, we refer to σ2(r) as the “error” measure (or error estimate) as it quantifies the mean deviation (either positive or negative) from the actual (triaxial) density distribution under the assumption of spherical symmetry.

|

|
The Results
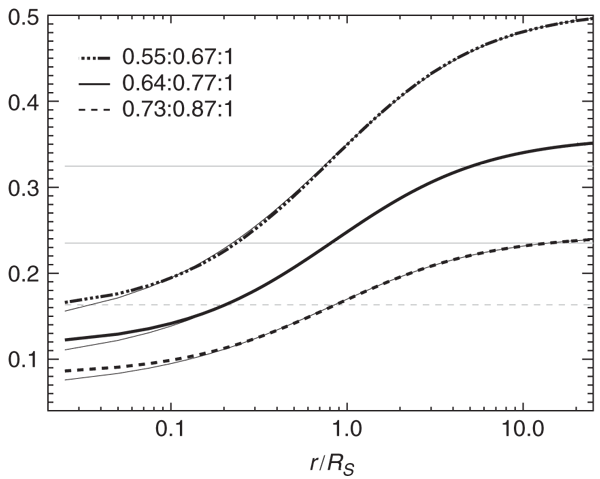
In Figure 1 we plot the error estimate as given by Eqn (6) (thick lines) for a number of axis ratios. The ratios chosen agree with the findings of cosmological n-body simulations as reported by Kasun & Evrard (2005). Their distributions are close to Gaussian and we chose to present Eqn (6) for axis ratios based upon the mean ratios <a/c> and <b/c> as well as the 1σ scatter about these values. This leaves us with the ratios <a/c> = 0.64 ± 0.09 and <b/c> = 0.77 ± 0.10. Hence we plot Eqn (6) for the ratios
-
a:b:c = 0.64:0.77:1 (mean),
-
a:b:c = 0.73:0.87:1 (+1σ), and
-
a:b:c = 0.55:0.67:1 (–1σ).
While the errors are rather small in the central parts we note a discrepancy of up to 50% in the outer regions of dark matter halos for the more triaxial axis ratios.
To better understand and gauge the functional behaviour of the curves presented in Figure 1, we calculated the error estimate Eqn (6) for the same axis ratios but using a simple isothermal density profile

The results can also be viewed in Figure 1, and are represented by faint horizontal lines for the respective axis ratios. We note that for a single power-law density profile the error is constant with radius. We further observe that the crossing point between the isothermal and the NFW profiles occurs about the scale radius (i.e. r/Rs ∼ 1) at which the NFW profile approximates the isothermal behaviour. This suggests fitting the radial dependence of the NFW error estimate with a curve of functional form similar to the logarithmic slope of the density profile itself, i.e. d log ρ/d log R. We found the following function to accurately describe the data

where A and β are free parameters. The best fit curves to the error equation, Eqn (6), are also shown in Figure 1 as thin solid lines.
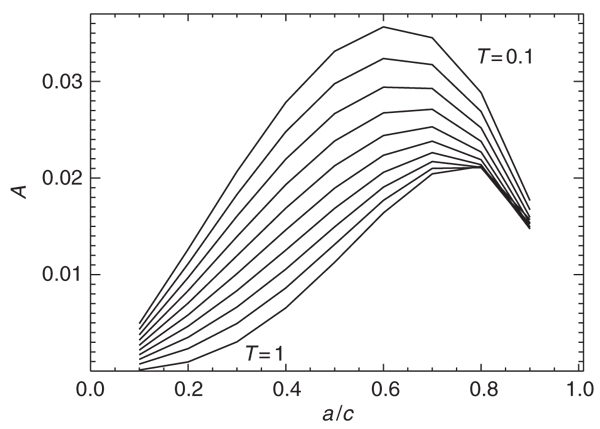
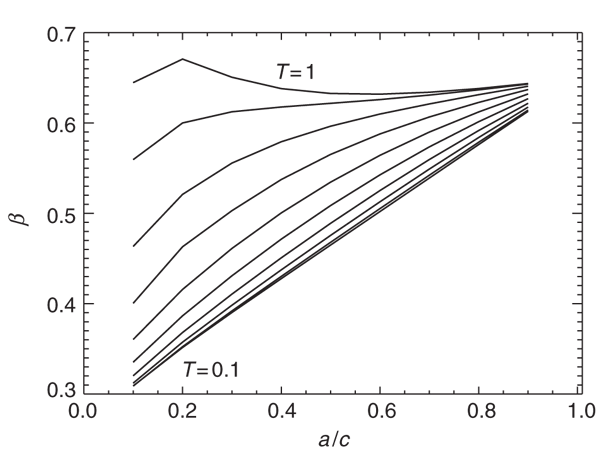
The question now arises about the dependency of the fitting parameters A and β on the axis ratios a:b:c and the triaxiality T, respectively. To this extent we show in Figure 2 and 3 how A and β vary as a function of a/c along lines of constant triaxiality T. We note that the variation in both parameters is rather small and the average value of the median values for constant T are <A> = 0.017 and <β> = 0.530. When adopting these parameters, Eqn (8) provides a (universal) formula for estimating the error introduced by spherically averaging an elliptical mass distribution for given axes ratios a/c and b/c, respectively.
Conclusions
Motivated by the findings of cosmological simulations that dark matter halos have triaxial mass distributions (e.g. Kasun & Evrard 2005; Bailin & Steinmetz 2005; Allgood et al. 2006), we investigated the errors in the derivation of the density profile under the assumption of spherical symmetry. This supposition is rather common and nearly all results presenting evidence for the “cuspy” behaviour of dark matter halos rely upon this premise. While others already showed that a spherical assumption will lead to discrepancies in the interpretation of observational data (e.g. Jing & Suto 2002; Oguri et al. 2005), we present an estimator to quantify this error.
We set out to shed light on the question of whether the discrepancy and debate about the exact value of the logarithmic central slope (e.g. Navarro et al. 1997; Moore et al. 1999) can be related to the error introduced by the simplifying assumption of spherical symmetry. We now conclude that the inner parts are only marginally affected and the error will be too small to explain variations in the logarithmic slope as large as ±0.5. A change in α from, for instance, 1.5 down to 1 entails a difference in the central density of a factor of about 3 (at approx. 10% of the scale radius) rather than the low percentage level indicated by Eqn (6) and seen in Figure 1. However, there are claims that dark matter halos tend to be more elliptical in the central regions (Dubinski & Carlberg 1991; Jing & Suto 2002; Kazantzidis et al. 2004; Bailin et al. 2005; Allgood et al. 2006; Power et al. 2006). But those shape changes are only minor and therefore will not be able to increase the error to the required level.
We further provide a fitting function that allows estimation of the error introduced by spherically averaging a triaxial mass distribution as a function of radius for (almost) arbitrary axis ratios a/c and b/c.
Acknowledgements
We benefitted from valuable discussions with Volker Müller. A.K. acknowledges funding through the Emmy Noether Programme by the DFG (KN 755/1).
Allgood B.,
Flores R. A.,
Primack J. R.,
Kravtsov A. V.,
Wechsler R. H.,
Faltenbacher A. and
Bullock J. S.
(2006)
MNRAS Vol. 367, 1781.
Austin C. G.,
Williams L. R.,
Barnes E. I.,
Babul A. and
Dalcanton J.
(2005)
ApJ Vol. 634, 756.
Bailin J. and
Steinmetz M.
(2005)
ApJ Vol. 627, 647.
Bailin J.
(2005)
ApJ Vol. 627, L17.
de Blok W. J. G. and
Bosma A.
(2002)
MNRAS Vol. 385, 816.
Dehnen W. and
McLaughlin D. E.
(2005)
MNRAS Vol. 363, 1057.
Diemand J.,
Moore B. and
Stadel J.
(2004)
MNRAS Vol. 353, 624.
Diemand J.,
Zemp M.,
Moore B.,
Stadel J. and
Carollo M.
(2005)
MNRAS Vol. 364, 665.
Dubinski J. and
Carlberg R. G.
(1991)
ApJ Vol. 378, 496.
Fukushige T. and
Makino J.
(1997)
ApJ Vol. 447, L9.
Fukushige T. and
Makino J.
(2001)
ApJ Vol. 557, 533.
Fukushige T.,
Kawai A. and
Makino J.
(2004)
ApJ Vol. 606, 625.
Franx M.,
Illingworth G. and
de Zeeuw T.
(1991)
ApJ Vol. 383, 112.
Jing Y. P.
(2000)
ApJ Vol. 535, 30.
Jing Y. P. and
Suto Y.
(2000)
ApJ Vol. 529, L69.
Jing Y. P. and
Suto Y.
(2002)
ApJ Vol. 574, 538.
Hansen S. H.
(2004)
MNRAS Vol. 352, L41.
Hansen S. H. and
Stadel J.
(2006)
JCAP
Kasun S. F. and
Evrard A. E.
(2005)
ApJ Vol. 629, 781.
Kazantzidis S.,
Kravtsov A. V.,
Zentner A. R.,
Allgood B.,
Nagai D. and
Moore B.
(2004)
ApJ Vol. 611, L73.
Moore B.,
Governato F.,
Quinn T.,
Stadel J. and
Lake G.
(1998)
ApJ Vol. 499, L5.
Moore B.,
Quinn T.,
Governato F.,
Stadel J. and
Lake G.
(1999)
MNRAS Vol. 310, 1147.
Navarro J. F.,
Frenk C. S. and
White S. D. M.
(1997)
ApJ Vol. 490, 493.
Navarro J. F.,
Hayashi E.,
Power C.,
Jenkins A.,
Frenk C. S.,
White S. M. D.,
Springel V.,
Stadel J. and
Quinn T. R.
(2004)
MNRAS Vol. 349, 1039.
Oguri M.,
Takada M.,
Umetsu K. and
Broadhurst T.
(2005)
ApJ Vol. 632, 841.
Power C.,
Navarro J. F.,
Jenkins A.,
Frenk C. S.,
White S. D. M.,
Springel V.,
Stadel J. and
Quinn T.
(2003)
MNRAS Vol. 338, 14.
Power C.,
Jenkins A.,
Frenk C. S.,
Hayashi E. and
Navarro J. F.
(2006)
MNRAS Vol. 352, L41.
Reed D.,
Governato F.,
Verde L.,
Gardner J.,
Quinn T.,
Stadel J.,
Merritt D. and
Lake G.
(2005)
MNRAS Vol. 357, 82.
Simon J. D.,
Bolatto A. D.,
Leroy A.,
Blitz L. and
Gates E. L.
(2005)
ApJ Vol. 621, 757.
Swaters R. A.,
Madone B. F.,
Van den Bosch F. C. and
Balcells M.
(2003)
ApJ Vol. 583, 732.
Tasitsiomi A.,
Kravtsov A. V.,
Gottlober S. and
Klypin A. A.
(2004)
ApJ Vol. 607, 125.
Taylor J. E. and
Navarro J. F.
(2001)
ApJ Vol. 563, 483.


