

Paper Productivity of Ground-based Large Optical Telescopes from 2000 to 2009
Sang Chul KimA Korea Astronomy and Space Science Institute, Daejeon, Republic of Korea
B Email: sckim@kasi.re.kr
Publications of the Astronomical Society of Australia 28(3) 249-260 https://doi.org/10.1071/AS11011
Submitted: 10 March 11 Accepted: 29 June 11 Published: 30 August 2011
Journal Compilation © Astronomical Society of Australia 2011
Abstract
We present an analysis of the scientific (refereed) paper productivity of the current largest (diameter > 8 m) ground-based optical (and infrared) telescopes during the ten-year period from 2000 to 2009. The telescopes for which we have gathered and analysed the scientific publication data are the two 10-m Keck telescopes, the four 8.2-m Very Large Telescopes (VLT), the two 8.1-m Gemini telescopes, the 8.2-m Subaru telescope, and the 9.2-m Hobby–Eberly Telescope (HET). We have analysed the numbers of papers published in various astronomical journals produced by using these telescopes. While the total numbers of papers from these observatories are largest for the VLT, followed by Keck, Gemini, Subaru, and HET, the number of papers produced by each component of the telescopes is largest for Keck, followed by VLT, Subaru, Gemini, and HET. In 2009, each telescope of the Keck, VLT, Gemini, Subaru, and HET observatories produced 135, 109, 93, 107, and 5 refereed papers, respectively. We have shown that each telescope of the Keck, VLT, Gemini, and Subaru observatories is producing 2.1 ± 0.9 Nature and Science papers annually and these papers make up 1.7 ± 0.8% of all refereed papers produced by using each of those telescopes. Extending this relation, we propose that this ratio of the number of Nature and Science papers to the total number of refereed papers that will be produced by future extremely large telescopes (ELTs) will remain similar. From a comparison of the publication trends of the above telescopes, we suggest that (i) having more than one telescope of the same kind at the same location and (ii) increasing the number of instruments available at the telescope are good ways to maximize the paper productivity.
Keywords: history and philosophy of astronomy — sociology of astronomy — astronomical databases: miscellaneous
1 Introduction
Astronomy is a science driven by discovery,1 and the essential components in astronomical discovery are telescopes and instruments. Since 1990, the world's largest optical telescopes, of 8 to 10 m in diameter, have appeared and given birth to new innovations in astronomy. After 10–20 years of use of the largest optical telescopes, the necessity for larger telescopes has increased and we are witnessing the development of 25–42-m extremely large telescopes (ELTs).
Table 1 lists the current largest ground-based optical telescopes (diameter D ≥ 8 m). There are five more-active telescopes, built mainly in the 20th century: the USA's two 10-m Keck telescopes; the four 8.2-m Very Large Telescopes (VLT) of the European Southern Observatory (ESO); the two 8.1-m Gemini telescopes of the consortium of USA, UK, Canada, Chile, Australia, Brazil, and Argentina; the 8.2-m Subaru telescope of Japan; and the 9.2-m Hobby–Eberly Telescope (HET). The three telescopes in the lower part of Table 1 were built later, in the 21st century, and are in the early part of their operations, which are the 10.4-m Gran Telescopio Canarias (GTC), the 10-m South African Large Telescope (SALT), and the two 8.4-m (on a single mount) Large Binocular Telescopes (LBT).

|
Table 2 lists the three planned ELT projects with diameters larger than 20 m. When these state-of-the-art telescopes are completed, what impact will they have on astronomical research? One of the methods to answer this question is to scrutinize the impact of the current largest telescopes since they were completed. The analysis of the major scientific papers published by using these telescopes is essential to determine this impact, as will be shown in this paper.

|
Counting the number of published papers or the number of citations of specific papers which used certain telescopes is one of the ways in which we can measure the impact and importance of these telescopes or facilities (e.g. Davoust & Schmadel (1987); Leverington (1996); Schulman et al. (1997); Abt (1998, 2000); Trimble & Ceja (2008); Crabtree (2008); Trimble (2009); Crabtree (2011)); and analyzing citations is a method of measuring the impact of a certain paper (Stanek 2008).
From analysis of 11,831 papers published in 20 journals of astronomy and astrophysics from 2001 to 2003, Trimble & Ceja (2008) suggested that the Hubble Space Telescope (HST) is responsible for the largest number of optical papers, while the most frequently cited optical papers come from the Sloan Digital Sky Survey (SDSS), Keck, and the Anglo-Australian Telescope (AAT). Grothkopf et al. (2005) also showed that the HST surpasses both VLT and Keck in the total number of papers, as well as in the numbers of papers per year (their figure 1; see Ringwald et al. (2003); Meylan et al. (2004); Apai et al. (2010); but also Leverington (1997b)).
By analysing papers resulting from optical telescopes larger than 2 m in diameter published in 1990–1991 and cited in 1993, Trimble (1995) and Trimble (1996) found that the largest numbers of papers and citations came from the 4-m class telescopes the Canada–France–Hawaii Telescope (CFHT) and AAT, followed by the Cerro–Tololo Inter-American Observatory (CTIO) 4-m telescope, while the largest impact factors (five or more citations per paper per year) came from the University of Hawaii's 2.2-m telescope and the Multi-Mirror Telescope in Arizona (Trimble & Ceja 2008). The analysis of papers published in 2001 and 2002, which is after the completions of the 8-m class telescopes, Trimble & Ceja (2007) showed that the largest optical telescopes are responsible for the largest numbers of papers, while 4-m class telescopes displayed continued fading, except for the infrared United Kingdom InfraRed Telescope (UKIRT) and InfraRed Telescope Facility (IRTF).
From the analysis of 1000 most highly cited papers published between 1991 and 1998 (125 from each year) and 452 astronomy papers published in Nature during 1989–1998, Benn & Sánchez (2001) showed that the bigger the telescope, the more the papers were cited, with citation fraction ∝ diameter2. Trimble, Zaich, & Bosler (2005) also suggested that big telescopes produce more papers and more citations per paper than small ones, from the analysis of 2100 papers produced in 2001. Ahn et al. (2008) suggested that the number of papers produced by a large (D ~ 3.6–10 m) telescope is roughly proportional to the diameter of its primary mirror (see also Leverington (1997a)). They also estimated the numbers of refereed and Nature/Science papers that might be produced by the Giant Magellan Telescope (GMT) annually to be 330 and 17, respectively: the former by using the rough equation of N/D ~ 14 (N is number of refereed papers and D is the diameter of a telescope in meters) and the filled aperture of the GMT (21.4 m), and the latter by using another rough equation of < n/A > ~ 0.05 (n is the number of Nature/Science papers published by Keck I and each VLT telescope, and A is the collecting area of the primary mirror). Frogel (2010) initiated a series of papers to investigate what effects the new facilities, data archives, and means of information exchange had on astronomical publications, first by analysing the 100 most cited papers in each year from 2000 to 2009.
In this paper, we present an analysis of the publications based on results from the largest ground-based optical telescopes of Keck, VLT, Gemini, Subaru, and HET telescopes during the years of 2000–2009. Using the data, we try to find (i) the temporal trend of the publications from the above telescopes, and (ii) if there is any correlation in the refereed paper publications and the Nature/Science paper publications, where the latter is assumed to be the paragon of high-impact journals. The paper is organized as follows: Sect. 2 describes the data utilized in this work; Sect. 3 presents the analysis results; Sect. 3.1 focuses on the total number of papers; and Sect. 3.2 focuses on the Nature and Science papers. Finally, Sect. 4 summarizes and discusses the results.
2 Data
Among the telescopes with diameter larger than 8 m in Table 1, we selected the Keck, VLT, Gemini, Subaru, and HET telescopes for the analysis of telescope productivity, because these telescopes might be considered as general-purpose telescopes and/or are well beyond completion and actively produce scientific papers. GTC, SALT, and LBT were completed after 2005, implying that they are still in the process of being shaken down (Trimble (2009); their table 9). Being completed in 1999 and producing many papers, HET is also included, although its structure is an unusual one: it sits at a fixed elevation angle of 55° and rotates in azimuth to access 81% of the sky visible from McDonald Observatory.2 Having a similar structure to that of HET, SALT3 also has many papers published4 since its completion in 2005.
The data on the papers published by the Keck telescopes were obtained from the online site of http://www2.keck.hawaii.edu/library/keck_papers.html; those from the VLT telescopes are from http://archive.eso.org/wdb/wdb/library/publications/form; those from the Gemini telescopes are from http://www.gemini.edu/science/publications/; those from the Subaru telescope are from http://subarutelescope.org/Observing/Proposals/Publish/index.html; and those from the HET are from http://www.as.utexas.edu/mcdonald/het/sci_pub.html. We consider only refereed papers in this study, and we exclude any symposium proceedings. For the Gemini Observatory papers, the observatory webpage provides two separate pages: (i) “papers by users” which are based on data taken with the Gemini telescopes or from the Gemini Science Archive; and (ii) “papers by Gemini staff” which are science and engineering papers published by the staff in journals and conference proceedings. From the two sources we collected all the refereed papers which have used Gemini Observatory data for their researches, excluding any overlap papers.
The five databases obtained from these five observatories are then merged together and scrutinized to find any overlapped papers. All these overlap papers appearing in more than one database are carefully examined in the full texts. If these papers are actually produced based on data obtained at multiple telescopes, then the information is kept, while it is discarded if not. The detailed cases where two (or more) papers are kept in the final list are: (1) when two telescopes appear in the title (e.g. Venn et al. (2001)); (2) when two telescopes appear in the footnote attached to the title (e.g. Zheng et al. (2000)); (3) when one telescope appears in the footnote attached to the title and another telescope in the footnote attached to author(s) as an affiliation (e.g. Hu et al. (2002)); (4) when one telescope appears in the footnote attached to the title and another telescope in the section describing the observations (usually Section 2) (e.g. Vreeswijk et al. (2004)); (5) when one telescope appears in the footnote attached to the title and public-use data and/or any existing data from another telescope is used (e.g. Schaye et al. (2000); Dessauges-Zavadsky et al. (2002)); (6) when two telescopes appear in footnotes attached to authors (e.g. Drory et al. (2001)); (7) when two telescopes appear in the paper's abstract (e.g. Da Rocha et al. (2002)); and (8) when two telescopes appear in the main text, in the section describing the observations (e.g. De Breuck et al. (2001)).
There are several cases which are excluded from the final list: (1) One telescope is kept in the final list when data of the telescope are used in the analysis, while another telescope is not kept if only a previous study that used the telescope is cited (e.g. Pettini & Bowen (2001); Barth et al. (2003)); (2) When a paper used data from a telescope, while another telescope is only mentioned because a large program aims to get data in the future with all of these telescopes, only the former is kept (e.g. Fischer et al. (2005)); (3) When a different telescope in an observatory is actually used instead of the large (D > 8 m) telescope, it is excluded from the list (e.g. Höeflich et al. (2004)). In spite of the careful inspection of each of the overlap papers, in a small fraction of papers (typically ![]() 1%) it remains ambiguous whether the telescope listed has actually contributed to the paper.
1%) it remains ambiguous whether the telescope listed has actually contributed to the paper.
Since it takes a long time for optical telescopes today to ramp up to normal operations (Trimble 2009); it is worthwhile to check the operation start years of the selected telescopes. The two Keck telescopes were built in May 1993 and October 1996.5 The first light for the VLT unit 1 telescope (‘Antu’) was obtained in late May 1998, and it went into routine scientific operation on 1999 April 1.6 The first lights for the units 2, 3, and 4 of the VLT telescopes (named ‘Kueyen’, ‘Melipal’, and ‘Yepun’, respectively) were obtained on 1 March 1999,7 26 January 2000,8 and 3 September 2000,9 respectively. Gemini North saw first light in 1999, and began scientific operations in 2000,10 while Gemini South opened a year later than its twin in 2000.11 Subaru telescope saw first light on 28 January 1999.12 Since the beginning of operations of the Keck telescopes was 1993, it could be reasonably deduced that the Keck telescopes were already in the process of normal operation and paper production in 2001 as seen in table 9 of Trimble (2009), while naturally having more than one telescope brought about synergies.
On the other hand, the VLT, Gemini, Subaru, and HET telescopes, built in 1998–2000, 1999–2000, 1999, and 1999, respectively, should still be in their early phases in 2000 and 2001, which is confirmed in Figure 2 in the next Section.
|
|
Table 3 shows the final paper productivities of the Keck, VLT, Gemini, Subaru, and HET observatories during the period 2000–2009. The number fraction of the excluded papers to the total number of papers provided on the Web by each observatory is typically ![]() 1%.
1%.

|
3 Results
3.1 Total Number of Papers
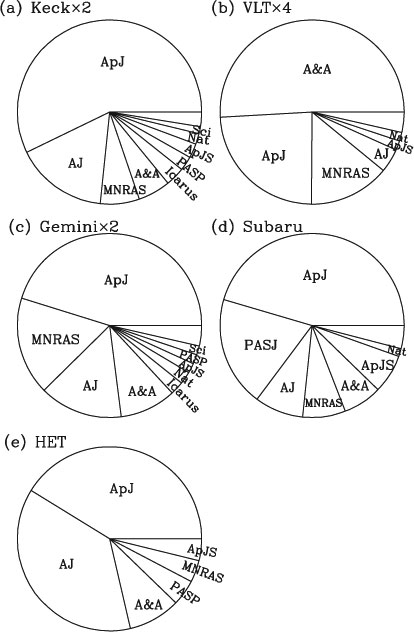
Figure 1 shows the pie charts for the papers produced by using the Keck, VLT, Gemini, Subaru, and HET telescopes, displaying the percentages of various journals, where the journals with percentages larger than 1% are labeled. While Astrophysical Journal Supplements (ApJS) is shown separately, Astrophysical Journal (ApJ) includes the Astrophysical Journal Letters (ApJL) publications (see Frogel (2010) for the history of the separation of ApJ and ApJL). Keck telescopes published 57.2% of papers in ApJ (including ApJL) (it becomes 59.7% if ApJS is also included), and 75.9% in the American journals ApJ, ApJS, and Astronomical Journal (AJ). While the Gemini telescopes published 45.2% of papers in ApJ, the value becomes 59.8% if AJ is also included. The Subaru telescope has 60.9% of papers published in the American journals ApJ, ApJS, and AJ, while 19.3% of papers are published in the Publications of the Astronomical Society of Japan (PASJ). HET published 78.6% of papers in ApJ and AJ, and 82.4% in the American journals ApJ, AJ, and ApJS. The ESO VLT observatory, however, has published dominantly in the European journal Astronomy and Astrophysics (A&A) (50.9%) and the UK journal Monthly Notices of the Royal Astronomical Society (MNRAS) (14.2%), while 29.8% of its papers are published in the American journals ApJ, AJ, and ApJS (Abt 2010). While 12.5% of Keck telescope papers are published in A&A and MNRAS, 29.8% of VLT papers are published in the American journals. While Abt (2010) notes that most (55%) of the astronomical articles in journals with impact factors (Frogel 2010) greater than 2.0 are published in the four journals A&A, AJ, ApJ (including ApJL and ApJS), and MNRAS, the percentages of papers published in these journals by using the Keck, VLT, Gemini, Subaru, and HET telescopes are 88.5%, 94.9%, 88.7%, 75.2%, and 95.4%, respectively. If PASJ is also included, the percentage for the Subaru increases to 94.5%.
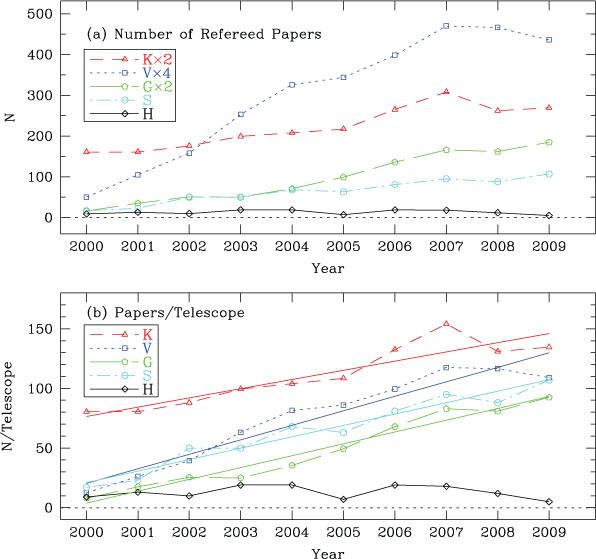
Figure 2 (a) shows the yearly distribution of the refereed papers produced by using the Keck (triangles), VLT (squares), Gemini (pentagons), Subaru (circles), and HET (diamonds) observatories for the period 2000–2009. The two Keck telescopes (‘K×2’, triangles) show a very stable but still ascending slope in the number of papers up to 2007 (N(2007) = 308), after which it slightly decreases. The four VLT telescopes (‘V×4’, squares) show rapid increase in the number of papers from 2000 to 2007 and again the value for 2007 (N = 470) is a maximum for these ten years. In 2003, the number of papers produced by using VLT crossed over that by using Keck (Grothkopf et al. 2005; Trimble & Ceja 2008). Built in 1999 and 2000, the two Gemini telescopes also show a rapid increase in the number of papers from 2000 (N = 16) to 2009 (N = 185), while the latter is the maximum number in the period. Having only a single 8.2-m telescope, unlike the others above, the Subaru telescope shows a steady increase in the number of papers, and the maximum value is reached in 2009 (N = 107). Unlike the above telescopes, the 9.2-m HET shows an almost steady value of 13.1 ± 5.4 for the number of papers each year from 2000 to 2009. While Abt (2010) showed that the astronomical research rates in the US, the UK, and Europe have not reached a maximum and seem still to be increasing, data will need to be gathered for at least a few more years in the future to see if it is the same for the publications from the above telescopes since some telescopes show a levelling-off or even decrease in the number of papers after 2007. It is worth noting here that Frogel (2010) (his figure 1) found that the rise in the total number of authors for the top 100 papers during the period 2000–2009 is steep from 2000 to 2007 and levels off from 2007 to 2009. As he writes that it is not easy to determine if such a rise is typical for all astronomical articles or is confined to the top 100 for each year, it could be interesting to find out whether there is any correlation in the levelling-off of both the total number of papers from the largest optical telescopes and the total number of authors for the top 100 papers after 2007.
Since the Keck, VLT, and Gemini observatories have two, four, and two telescopes, respectively, it is not fair to compare them with each other and also with the Subaru and the HET. Therefore, we divided the total number of papers produced by the Keck, VLT, and Gemini observatories by 2, 4, and 2, respectively, and showed the result in Figure 2 (b), which shows the number of papers produced using each individual telescope. Each telescope of the Keck observatory (‘K’) shows the largest values in the numbers of papers. After 2002, the VLT keeps the top position among the three 8-m class telescopes of VLT, Subaru, and Gemini. While each data point is connected by broken lines, we show the non-weighted least squares fit by solid lines and obtain the slopes for each of the Keck, VLT, Gemini, and Subaru telescopes as 7.7 ± 1.2, 12.1 ± 1.2, 9.9 ± 0.7, and 9.6 ± 0.8, respectively. VLT shows the largest value in the slope, and Gemini, Subaru, and Keck follow. VLT could have the largest slope, probably because it has (i) VLTI (VLT interferometer): the capability of combining all its telescopes, also using smaller auxiliary telescopes (~4 % of VLT papers are from the VLTI); (ii) a powerful suite of instruments; (iii) data reduction pipelines; (iv) a queue-based observing system (about half the time); (v) a data archive; (vi) the synergy of having largest number of the same telescopes at the same place; and/or (vii) good (especially technical) support (Grothkopf et al. 2005). The reality is that it is probably some combination of these possibilities, and of course the common factor is ESO's larger operations budget. The fact that each of the 10-m Keck telescopes produces a larger number of papers than any of the other 8-m class telescopes is consistent with the finding of Ahn et al. (2008) that N ∝ D for large optical telescopes (where N is the number of refereed papers and D is the diameter of the telescope in meters) (see also Abt (1980); Leverington (1997a)). This, on the other hand, could result from the fact that almost every aspect of a telescope project scales with the telescope diameter: its construction budget, its operational budget, the user community, the level of user support, and so on.
The order of the slope values of the fittings of the number of refereed papers over years for each of the telescopes could be explained by other parameters, like the number of instruments of the telescopes. Currently, the number of instruments of the five telescopes are : VLT – 12 (FORS1, FORS2, ISAAC, UVES, NCAO, VIMOS, FLAMES, VISIR, SINFONI, CRIRES, HAWK-I, and X-shooter); Gemini – 11 (Altair, GMOS, GNIRS, Michelle, NIFS, NIRI, FLAMINGOS-2, GMOS, NICI, Phoenix, and T-ReCS); Keck – 9 (HIRES, LRIS, NIRC, DEIMOS, ESI, NIRC2, NIRSPEC, NIRSPAO, and OSIRIS); Subaru – 8 (AO188, COMICS, FMOS, FOCAS, HDS, IRCS, MOIRCS, and Suprime-Cam); and HET – 3 (LRS, MRS, and HRS). This decreasing order of the number of instruments from VLT (12) to HET (3) is almost similar to that of the slopes above, i.e. VLT (12.1 ± 1.2); Gemini (9.9 ± 0.7); Subaru (9.6 ± 0.8); Keck (7.7 ± 1.2); and the almost-flat HET. The existence of data archives for the observatories of VLT (http://archive.eso.org/), Gemini (http://www3.cadc-ccda.hia-iha.nrc-cnrc.gc.ca/gsa/), and Subaru (http://smoka.nao.ac.jp/) coincide with the highest values for the slopes of these three telescopes, especially for the Subaru having a larger slope than does Keck.
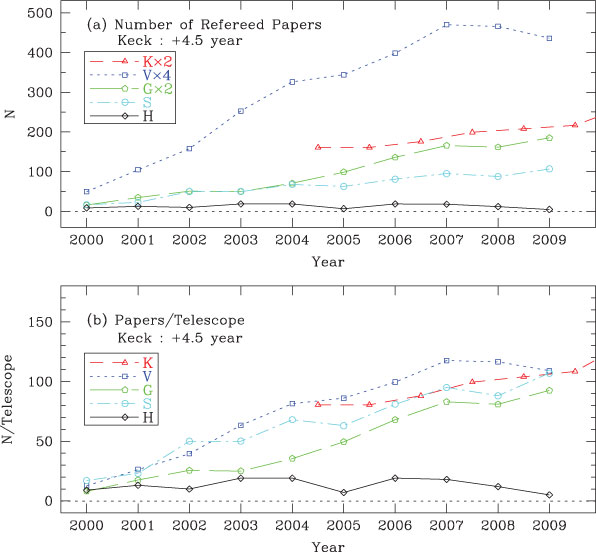
The fact, however, that Keck shows the largest values in the number of refereed papers per unit telescope could also be the result of the earlier starts of the Keck telescopes than those of other telescopes, so that they could be in more stable operations. This is confirmed in Figure 3; where the data for Keck are shifted forward +4.5 years (the mean of the start years of the two Keck telescopes of 1993 and 1996 is taken to be 1994.5), assuming that VLT, Gemini, Subaru, and HET started at around 1999. Panel (b) of Figure 3 shows that, if the telescopes of VLT, Gemini, and/or Subaru have a similar amount of time for them to be stable enough for scientific operations as in the case of Keck, each component of them would have almost similar productivity as that of each of the Keck telescopes, especially for the four VLT telescopes.
|
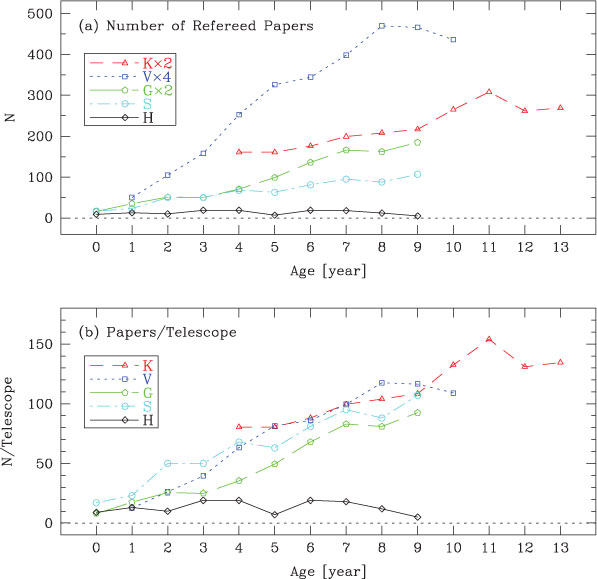
Another way to compare the productivities of telescopes is to look at the number of papers as a function of age, where the ‘age’ is set to zero when the first paper using the telescope is published (Keck – January 1996; VLT – March 1999; Gemini – December 2000; Subaru – February 2000; HET – January 2000). This variation versus the different ages is shown in Figure 4. Figure 4 (a) shows almost the same results as shown in Figure 3 (a). Figure 4 (b), however, shows good progress for each of the Keck telescopes while, for the near futures of VLT, Subaru, and Gemini, more data is needed to see whether they will show an increase in productivity as for the ages of [9, 11] of Keck or leveling off as for the ages of [11, 13] of Keck.
|
3.2 Nature and Science papers
Citations of papers are usually considered as the typical measure of the impact of journals/papers (e.g. Apai et al. (2010)) and Frogel (2010) showed that Nature and Science are not included in the five journals (A&A, AJ, ApJ, ApJS, and MNRAS) that account for 80 to 85% of the total citations for each year. These two journals, however, still hold the highest impact factors,13 and are generally regarded as the paragons of high-impact journals (see, e.g., Metcalfe (2005)). Here, we assume that publications in Nature and Science are the ideal high-impact papers in astronomy, meaning any new discoveries, breakthroughs in a specific field of astronomy, or new findings for celestial objects or phenomena. It is true, however, that there are opposite opinions on the journals Nature and Science: that they are too sensational. In spite of the fact that these two journals are highly ranked by Thomson Reuters, the Thomson Reuters Institute for Scientific Information (ISI) uses citation metrics only as one indicator among others to predict Nobel prizewinners, Since “of the 28 physics Nobel prizewinners from 2000 to 2009, just 5 are listed in ISI's top 250 most-cited list for that field” (Frey & Osterloh 2010).
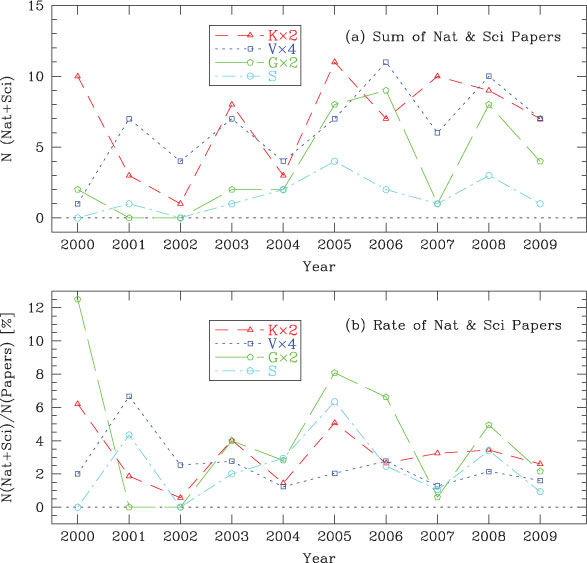
Figure 5 (a) shows the yearly distribution of the number of papers published in Nature and Science using the Keck, VLT, Gemini, and Subaru telescopes for the period 2000–2009, and Figure 5 (b) shows the rate of Nature and Science papers among all the refereed papers produced using the telescopes. Table 4 shows the statistics of these papers, where the upper part is for the number of papers and the lower part is for the rate of Nature and Science papers among all the refereed papers produced using the telescopes. The Keck telescopes produce the largest mean (N = 6.9 ± 1.1, σ = 3.4) number of Nature and Science papers, and the VLT (mean N = 6.4 ± 0.9, σ = 2.9) follows. The Gemini shows a somewhat larger fluctuation, like Keck (mean N = 3.6 ± 1.1, σ = 3.5), and the Subaru shows a rather low, but still steady distribution (mean N = 1.5 ± 0.4, σ = 1.3). The mean rates of Nature and Science papers among all the refereed papers produced by these observatories are between 2.4 and 4.2, while the median values are 2.1 (VLT), 2.5 (Subaru), 3.2 (Keck), and 4.0 (Gemini). Gemini still shows a larger value of dispersion (σ = 4.0) in the rate of Nature and Science papers among all the refereed papers than the other observatories (σ = 1.6, 1.7, and 2.0 for VLT, Keck, and Subaru, respectively). The reason why there are no Nature and/or Science papers from the HET could be attributed, among other reasons, to the small number of papers based on the HET data and possibly to the fact that its structure is designed in a very special way (see Section 1), specifically for spectroscopy, at very low cost.
|

|
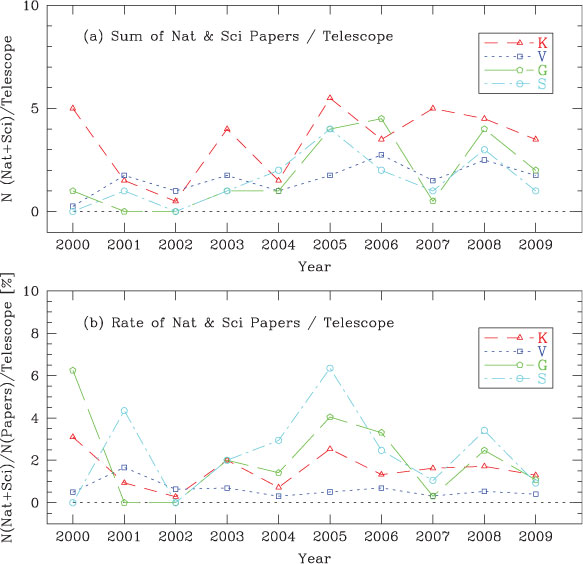
In Figure 5 (a) the primary reason why the Subaru Observatory shows the least number of Nature and Science papers compared to the other observatories is because the number of component telescopes is different. We, therefore, plotted in Figure 6 (a) the yearly distribution of the number of papers published in the two journals Nature and Science by using each of the Keck, VLT, Gemini, and Subaru telescopes for the period of 2000–2009. Figure 6 (b) shows the rate of Nature and Science papers among all the refereed papers produced by using each of the telescopes. Table 5 shows the statistics of these papers, where the upper part is for the number of papers and the lower part is for the rate of Nature and Science papers among all the refereed papers produced by using each of the telescopes.
|

|
Compared to the other 8-m class telescopes (mean values of N = 1.5–2.3, median N = 1–1.8), the 10-m Keck telescope shows the largest mean (N = 3.5 ± 0.5, σ = 1.7) and median (N = 4) number of papers. While each telescope of the observatories shows a similar rate of Nature and Science papers among all the refereed papers produced by using each of the telescopes (mean N = 0.7–2.3, median N = 0.6–2.5), VLT shows the lowest rate and Subaru shows the highest rate. Since the total numbers of refereed papers produced by each of the VLT telescopes is not small (see Figure 2 (b)), it could be concluded that the users of the VLT telescopes tend to publish more papers in the usual astronomical journals than in the journals Nature and Science. From each of the Keck, VLT, Gemini and Subaru telescopes, the overall mean and median values in Table 5 are N = 2.1 ± 0.9 and N = 2.0 ± 1.4, respectively, for the number of Nature and Science papers, and 1.7 ± 0.8% and 1.6 ± 0.9%, respectively, for the rates. Therefore, we could conclude that each of the current 8- to 10-m class telescopes is producing 2.1 ± 0.9 Nature and Science papers annually and the rate of these papers among all the refereed papers produced by using that telescope is 1.7 ± 0.8%.
It is necessary to note that these statistics represent only the current trend considering the number of the active, forefront astronomical facilities including the largest (D > 8 m) ground-based optical telescopes, space telescopes, specially designed and special purpose telescopes, and the policies of Nature and Science regarding the balance among the different disciplines represented in the journals. In the next decade, some, many, or most of the above optical and infrared telescopes currently producing many Nature and Science papers will be probably substituted by ELTs in the sense that the ELTs will likely be producing more new discoveries and doing the highest impact science at that time.
Telescopes smaller than ELTs could get some ideas on their long-term performance from the case of CFHT. CFHT is one of the most competitive telescopes among the 4-m class (Benn & Sánchez 2001), and has produced around 130 refereed papers in 2010 (Veillet 2011) in the current era of large (D ~ 8–10 m) optical telescopes despite being only 3.6 m in diameter. The annual number of refereed publications based significantly on CFHT has been more or less over 50 since 2000, and this number became larger than 100 in 2007.14 This productive trend of results might be based on the efforts made by the Observatory like the following:
-
Queued Service Observing (QSO) mode affords as much real observing time as requested by the observers. The QSO personnel select the observing conditions according to the sky clearance and seeing so that the optimum conditions are given to every successful observing proposal.
-
The obtained data are provided to the principal investigators after the preprocessing is finished, so that observers do not need to spend time on it.
-
CFHT affords high-performance wide-field imagers (field of view of 0.96° × 0.94° in optical, and 20′ × 20′ in near-infrared wavebands), which is a big advantage making it possible for this telescope to achieve high levels of paper production (Cuby et al. 2007).
-
CFHT carries out large programs and collaborative observing projects with many other facilities, which maximize the value of the telescope.
4 Summary and Discussion
We have analysed the ten-year (2000–2009) publication record of the current largest (D > 8 m) ground-based optical telescopes of Keck, VLT, Gemini, Subaru, and HET. During the ten-year period, the telescopes of Keck, VLT, Gemini, and Subaru showed increasing numbers of refereed papers, and this tendency is still preserved when we divided the number of papers by the number of telescope components (2 for Keck and Gemini, and 4 for the VLT telescopes). Each telescope of the Keck, VLT, Gemini, Subaru, and HET observatories produced 135, 109, 93, 107, and 5 refereed papers, respectively, in 2009. For the ten-year period, the number of papers produced by each of the telescopes is largest for the Keck, while the largest slope in the change of the annual number of papers is for the VLT. It is worthwhile to note that the impact of papers based on archival data can have a significant impact on a telescope's productivity. For example, almost half of papers published using HST data are based on at least some archival data,15 and this could be also a factor for VLT, Gemini, and Subaru as mentioned in §3.1. While the astronomical literature continues to grow exponentially by 2–3% (Frogel 2010), 4% (Abt 1998), 5% (White 2007; Trimble & Ceja 2008), 6–7% (Abt 2010), or 8.8% (Abt 1995) annually, we will need more data for the next several years to see if the number of papers produced by using the telescopes will still increase or not, since some of the telescopes (Keck and VLT) show somewhat fewer publications in 2008 and 2009 than in 2007 (see Figure 2(a)).
For papers published in the two multi-disciplinary, high-impact journals Nature and Science (Frogel 2010), we have shown that each telescope of the Keck, VLT, Gemini, and Subaru observatories is producing 2.1 ± 0.9 Nature and Science papers annually and the rate of these papers among all the refereed papers produced by using that telescope is 1.7 ± 0.8%. Extending this relation obtained from the current largest ground-based optical telescopes, we may be able to conclude that this ratio of the number of Nature and Science papers over the number of whole refereed papers that will be produced by future ELTs of GMT, TMT and E-ELT will remain similar. If, therefore, one of the future larger telescopes produces, for example, 330 refereed papers annually, the above simple calculation suggests that ~6 Nature and/or Science papers might be included in these publications annually.
From the comparison of the publication trends of the telescopes, we may conclude the followings:
-
While the telescope productivity means papers per telescope, it is expected that the more telescopes of the same kind at the same location, the more synergies occur. This includes the effectiveness of maintenance, smaller numbers of observatory personnel, less cost for the facilities and more chances to use the instruments that are made to be attached to the same telescope. Although this fact might not be the critical factor for telescope productivity, the specific example of the VLT is worth noting. The four VLT telescopes currently have the largest number of instruments (12 ; see § 3.1 – four of the instruments can be used at the same time), the largest number of papers among the telescopes considered in this study, and the largest slope value (12.1 ± 1.2) of the fitting of the number of refereed papers per year.
-
The important factors that influence the growth rate of paper production are a ramp-up in efficient operations, reliable instruments, useful instruments, and the number of good instruments available at the telescope. The latter point might be supported by the fact that the order of the number of instruments is almost the same as that of the slope values of the fitting of the number of refereed papers per year: VLT (12, 12.1 ± 1.2); Gemini (11, 9.9 ± 0.7); Keck (9, 7.7 ± 1.2); Subaru (8, 9.6 ± 0.8); and HET (3, almost flat); where (number of instruments, the slope value).
Although it might not be possible to have more than one telescope at a site to maximize the productivity, it is a natural and necessary way to increase the number of good instruments available and to allow an archive to maximize the use of the data. There are also many other items that affect the productivity of telescopes, such as :
-
the user base of the telescope;
-
the publication traditions of journals (e.g. US versus European journals) (Schulman et al. 1997; Abt 1998, 2010; Frogel 2010); and
-
support for the telescope users (pool of the management personnel);
investigation of which in the future might provide more lessons, although it is not easy to get some of the relevant data (e.g. budget). The first item above, the user base of the telescope, might be correlated with the telescope subscription rate. Frogel (2010) showed (in his figure 1) that the membership numbers for the American Astronomical Society (AAS) have stayed flat for the last 10–20 years (cf. Abt (2000)), while those for the International Astronomical Union increased about 20% over the same period. This almost constant number of AAS membership shows no correlation with the increase in the numbers of papers for the US telescopes of Keck, HET (90% portion for US) and Gemini (48% portion for US) as shown in this study. This indicates that the analysis of the user base of the large optical telescopes might need the database of actual telescope users, needless to say that of optical astronomers of the countries that operate the telescopes, specifically for VLT, Gemini, and HET which are being operated by two or more countries. The rather detailed analysis on the journal of AJ by Bracher (1999) might indicate the possibilities of studies of the publication traditions of journals.
Acknowledgments
The author would like to thank the referee, Dennis Crabtree, for providing prompt and thoughtful comments and detailed comments on English that greatly helped to improve the original manuscript. The author is also grateful to Dr. Hong Soo Park for his kind help in using the SuperMongo and helpful discussion, and to Drs. Jaemann Kyeong and A-Ran Lyo for their kind encouragements. The author is a member of the Dedicated Researchers for Extragalactic AstronoMy (DREAM) team in the Korea Astronomy and Space Science Institute (KASI).
References
Abt, H. A., 1980, PASP, 92, 249Abt, H. A., 1995, ApJ, 455, 407
| Crossref | GoogleScholarGoogle Scholar |
Abt, H. A., 1998, PASP, 110, 210
| Crossref | GoogleScholarGoogle Scholar |
Abt, H. A., 2000, PASP, 112, 1417
| Crossref | GoogleScholarGoogle Scholar |
Abt, H. A., 2010, PASP, 122, 955
| Crossref | GoogleScholarGoogle Scholar |
Ahn, S.-H., Park, B.-G., Kim, Y.-S., Chun, M.-Y., Kim, H.-I., Sung, H.-I., Lee, D.-W., & Kim, S. C. 2008, PKAS, 23, 123 (Erratum: 2010, PKAS, 25, 51)
Apai, D., Lagerstrom, J., Reid, I. N., Levay, K. L., Fraser, E., Nota, A. and Henneken, E., 2010, PASP, 122, 808
| Crossref | GoogleScholarGoogle Scholar |
Barth, A. J., Sari, R., Cohen, M. H., Goodrich, R. W., Price, P. A., Fox, D. W., Bloom, J. S., Soderberg, A. M. and Kulkarni, S. R., 2003, ApJ, 584, L47
| Crossref | GoogleScholarGoogle Scholar | 1:CAS:528:DC%2BD3sXhvFCgsbY%3D&md5=ccb453f2352a21716a54b61c3f66689bCAS |
Benn, C. R. and Sánchez, S. F., 2001, PASP, 113, 385
| Crossref | GoogleScholarGoogle Scholar |
Bracher, K., 1999, AJ, 117, 12
| Crossref | GoogleScholarGoogle Scholar |
Crabtree, D., 2008, SPIE, 7016, 70161A
| Crossref | GoogleScholarGoogle Scholar |
Crabtree, D., 2011, AAS, 217, 15719
Cuby, J.-G., et al. 2007, A preparatory document to the 2007 CFHT Users' Meeting (http://www.cfht.hawaii.edu/UM2007/UM07_Prep.pdf)
Da Rocha, C., Mendes de Oliveira, C., Bolte, M., Ziegler, B. L. and Puzia, T. H., 2002, AJ, 123, 690
| Crossref | GoogleScholarGoogle Scholar |
Davoust, E. and Schmadel, L. D., 1987, PASP, 99, 700
| Crossref | GoogleScholarGoogle Scholar |
De Breuck, C., 2001, AJ, 121, 1241
| Crossref | GoogleScholarGoogle Scholar |
Dessauges-Zavadsky, M., Prochaska, J. X. and D'Odorico, S., 2002, A&A, 391, 801
| Crossref | GoogleScholarGoogle Scholar | 1:CAS:528:DC%2BD38XnvVymsr4%3D&md5=9ec3a3fff71c59d3e7564d9cbbb534b7CAS |
Drory, N., 2002, ApJ, 562, L111
| Crossref | GoogleScholarGoogle Scholar |
Fischer, D. A., 2005, ApJ, 620, 481
| Crossref | GoogleScholarGoogle Scholar | 1:CAS:528:DC%2BD2MXisVerurY%3D&md5=a7daeab30bcb96e57242228795c94410CAS |
Frey, B. S. and Osterloh, M., 2010, Natur, 465, 871
Frogel, J. A., 2010, PASP, 122, 1241
| Crossref | GoogleScholarGoogle Scholar |
Grothkopf, U., Leibundgut, B., Macchetto, D., Madrid, J. P. and Leitherer, C., 2005, The Messenger, 119, 45
Höflich, P., 2004, ApJ, 617, 1258
| Crossref | GoogleScholarGoogle Scholar |
Hu, E. M., 2002, ApJ, 568, L75
| Crossref | GoogleScholarGoogle Scholar | 1:CAS:528:DC%2BD38XjsFaiu7o%3D&md5=fb3a7c58b35141f271ce4ef991e95174CAS |
Leverington, D., 1996, QJRAS, 37, 643
Leverington, D., 1997a, Natur, 385, 196
| Crossref | GoogleScholarGoogle Scholar | 1:CAS:528:DyaK2sXls1KhtA%3D%3D&md5=3e178b2f7a141e49c3fed37eddd4bcd4CAS |
Leverington, D., 1997b, Natur, 387, 12
| Crossref | GoogleScholarGoogle Scholar | 1:CAS:528:DyaK2sXivFOkur4%3D&md5=031b0a873cd588b1280fe3942076dc73CAS |
Meylan, G., Madrid, J. P. and Macchetto, D., 2004, PASP, 116, 790
| Crossref | GoogleScholarGoogle Scholar |
Metcalfe, T. S., 2005, BAAS, 37, 555
Pettini, M. and Bowen, D. V., 2001, ApJ, 560, 41
| Crossref | GoogleScholarGoogle Scholar | 1:CAS:528:DC%2BD3MXot12lt74%3D&md5=8b284e8578b3d0d28407336c1cf012b3CAS |
Ringwald, F. A., Culver, J. M., Lovell, R. L., Kays, S. A. and Torres, Y. V., 2003, BAAS, 35, 1063
Schaye, J., Rauch, M., Sargent, W. L. W. and Kim, T.-S., 2000, ApJ, 541, L1
| Crossref | GoogleScholarGoogle Scholar | 1:CAS:528:DC%2BD3cXnslGhtbw%3D&md5=a9d89c9aa90423f069968f24df3bdd59CAS |
Schulman, E., French, J. C., Powell, A. L., Eichhorn, G., Kurtz, M. J. and Murray, S. S., 1997, PASP, 109, 1278
| Crossref | GoogleScholarGoogle Scholar |
Stanek, K. Z. 2008, (arXiv:0809.0692)
Trimble, V., 1995, PASP, 107, 977
| Crossref | GoogleScholarGoogle Scholar |
Trimble, V., 1996, Sciem, 36, 237
Trimble, V., 2009, ExA, 26, 133
Trimble, V., Zaich, P. and Bosler, T., 2005, PASP, 117, 111
| Crossref | GoogleScholarGoogle Scholar |
Trimble, V. and Ceja, J. A., 2007, AN, 328, 983
Trimble, V. and Ceja, J. A., 2008, AN, 329, 632
Veillet, C. 2011, private communication
Venn, K. A., 2001, ApJ, 547, 765
| Crossref | GoogleScholarGoogle Scholar | 1:CAS:528:DC%2BD3MXhvFems74%3D&md5=fa738c64352560c8fc693a513efbb209CAS |
Vreeswijk, P. M., 2004, A&A, 419, 927
| Crossref | GoogleScholarGoogle Scholar | 1:CAS:528:DC%2BD2cXosVyhtrg%3D&md5=257a2f4e18f87e528c02541145f77182CAS |
White, S. D. M., 2007, RPPh, 70, 883
Zheng, W., 2000, AJ, 120, 1607
| Crossref | GoogleScholarGoogle Scholar |
1
2
3
4
5
6
7
8
9
10
11
12
13 The impact factors for Nature and Science for the years of 2006, 2007, 2008, and 2009 are 26.681, 28.751, 31.434, and 34.480 and 30.028, 26.372, 28.103, and 29.747, respectively, which is released by Journal Citation Reports, Thomson Reuters.
14 CFHT Annual Report 2007:
15