

Characterization Methods for Starch-Based Materials: State of the Art and Perspectives
Alex C. Wu A B , Torsten Witt A B and Robert G. Gilbert A B CA Tongji School of Pharmacy, Huazhong University of Science and Technology, Wuhan, 430030, China.
B Centre for Nutrition and Food Sciences, Queensland Alliance for Agricultural and Food Innovation, The University of Queensland, Brisbane, Qld 4072, Australia.
C Corresponding author. Email: b.gilbert@uq.edu.au

Alex C. Wu received his B.Sc. in 2009 from the University of Queensland (UQ) with majors in mathematics and chemistry, and first-class honours in applied science in 2010. He is doing his Ph.D. at UQ on precise mathematical models for the relations between starch biosynthesis and structure. |

Torsten Witt was awarded first-class honours by the University of Queensland in 2009, and has completed his Ph.D. at that institution on the theory and experimental exploration of the relations between higher and lower levels of starch structure. |

Robert (‘Bob’) Gilbert is Research Professor at the University of Queensland, and also at Huazhong University of Science and Technology at the Biolake Hi-Tech campus in Wuhan, China, under the Foreign Experts program. He is the author of about 400 papers on chemical dynamics, emulsion polymerization, and the biosynthesis–structure–property relations of complex branched glucose polymers of importance to human health. |
Australian Journal of Chemistry 66(12) 1550-1563 https://doi.org/10.1071/CH13397
Submitted: 27 July 2013 Accepted: 25 September 2013 Published: 23 October 2013
Abstract
Improving starch-containing materials, whether food, animal feed, high-tech biomaterials, or engineering plastics, is best done by understanding how biosynthetic processes and any subsequent processing control starch structure, and how this structure controls functional properties. Starch structural characterization is central to this. This review examines how information on the three basic levels of the complex multi-scale structure of starch – individual chains, the branching structure of isolated molecules, and the way these molecules form various crystalline and amorphous arrangements – can be obtained from experiment. The techniques include fluorophore-assisted carbohydrate electrophoresis, multiple-detector size-exclusion chromatography, and various scattering techniques (light, X-ray, and neutron). Some examples are also given to show how these data provide mechanistic insight into how biosynthetic processes control the structure and how the various structural levels control functional properties.
Introduction
At the simplest level, starch is ‘simply’ a branched homopolymer of glucose. Starch comprises glucose monomer units (actually anhydroglucose) with both α-(1→4) (linear) and α-(1→6) (branched) linkages. There is a single reducing end per molecule and non-reducing ends at the terminus of each chain from a branch point (Fig. 1). Two types of polymer with this molecular structure are present in a typical starch sample: amylopectin and amylose; see Fig. 2. Amylose has a few long-chain branches and a broad distribution of molecular weights, typically averaging ~106, and sizes; amylopectin also has a broad distribution of molecular weights and sizes, but the average molecular weight is about two orders of magnitude higher than amylose, while the chains from a branch point are much shorter and vast in number.
|
|
Branched polymers are inherently complex: a general mathematical description of the structure of a sample of branched polymers requires an infinitely hierarchical function.[1] Moreover, the complexity does not end there. Overall, starch has extraordinary structural complexity, with multiple hierarchical levels of structure on many different distance scales.[2] While there is no agreed terminology for the different structural features, one such categorization is sketched in Fig. 3 (note that this sketch is illustrative rather than quantitative: for example, the branching frequency in amylose is ~10–3–10–4, while there are typically 3–5 chains per cluster – e.g. fig. 7 in Jane et al.[3]). Level 1 comprises the individual chains. Level 2 comprises the whole branched molecules, considered as individual (molecularly dispersed) entities. Closely-linked branches of amylopectin, known as clusters (Fig. 2), form crystalline lamellae, which are found in layers with amorphous lamellae (formed from amylose and sections of amylopectin chains not within a crystalline lamella); this is the Level 3 structure. Level 4 comprises growth rings, perhaps created on a diurnal basis.[4] In turn, these assemble as granules (Level 5). The final level, Level 6, comprises the whole grain, which includes non-starch material such as proteins, lipids, and non-starch polysaccharides.

|
This review looks at the ways information on Levels 1–3 are obtained from experiment, as summarized in Fig. 4. Various examples are provided illustrating how such structural information is used to obtain relations between biosynthesis, processing, structure, and functional properties. The experimental techniques used for structural characterization of each level will be considered, noting that within a level, there is usually no simple way to write down a full structural description; for example, as noted above, Level 2 is fully specified only by an infinitely hierarchical distribution function. As a result, one can obtain only some average of the full structural description experimentally: using Level 2 as an example, appropriate techniques (e.g. size-exclusion chromatography) can yield an average weight of molecules as a function of size. Obtaining such a quantity from experiment in turn must perforce invoke certain assumptions, which are considered on a case-by-case basis in the subsequent sections.
|
As shown in Fig. 5, structural data are used to obtain information on the relations between (i) the biosynthetic processes which form the starch in the sample, (ii) any structural changes caused to that starch by processing, and (iii) whatever functional properties are of interest; these properties can include how the starch is degraded by any further process, such as digestion of a food or biodegradation of a starch-containing material.
|
In the following sections, the techniques used to characterize structure at Levels 1–3 are examined, and the assumptions involved in inferring structural information from the techniques are considered. Examples are then given of the use of this structural characterization, based on the paradigm of Fig. 5.
Level 1: Individual Chains
Techniques and Assumptions
The Level 1 distribution is expressed as the chain-length distribution (CLD) of chains from a branch point: Nde(X), the number of chains (obtained after enzymatic digestion of the starch by the isoamylase-type debranching enzyme) with degree of polymerization (DP) X, which is the number of glucose units in the branch; see Fig. 4.
A series of pretreatment is required to obtain Nde(X) from starch or starch-containing samples (i.e. flour). Starch is purified (if starting from flour) and solubilized before the release of oligosaccharides (or glucan chains) from debranching the starch. It is essential to check that the pretreatment does not cause selective loss of glucan chains; e.g. a solubilization procedure involving alkaline solution at elevated temperature can cause systematic loss of longer glucan chains, compared with solubilization using dimethyl sulfoxide solution. The long glucan chains may be cleaved by hydrolysis of α-(1→4) linkages. In principle, hydrolysis can be observed using NMR spectroscopy to find the relative number of α- and β-glucose reducing ends to the number of total α-(1→4) linkages in a sample before and after the pretreatment.[5] This is limited in practice because of the relatively small number of reducing ends compared with the α-(1→4) linkages and the difficulty in detecting the reducing ends quantitatively in whole starches. Debranching of starch is done using an isoamylase-type debranching enzyme.[6] It is important to check that the debranching technique used is quantitative (i.e. all α-(1→6) linkages are hydrolyzed). NMR spectroscopy can be used to check for any remnant α-(1→6) linkages.[7,8]
Three methods are commonly used to obtain Nde(X) from the glucan chains: fluorophore-assisted carbohydrate electrophoresis (FACE),[9,10] high performance anion exchange chromatography (HPAEC),[11–13] and size-exclusion chromatography[14] (SEC, also sometimes termed GPC, gel-permeation chromatography).
FACE involves derivatizing the glucan chains at the reducing end (Fig. 1; there is exactly one reducing end per glucan chain) with a charged fluorophore through reductive amination. The fluorophore APTS, 8-amino-1,3,6,pyrenetrisulfonic acid, is well suited because its absorption and emission characteristics are ideal for many standard laser-induced fluoresence (LIF) detectors.[6] Other labels have also been tested with some advantages under various circumstances.[15] It is essential to ensure that the radiolabelling technique has a consistent labelling efficiency regardless of chain length (evaluation has been carried out for APTS up to a DP of 135[10]). The radiolabelled glucans chains are then separated using capillary electrophoresis (CE), and the relative fluorosence intensity (RFI) measured with a LIF detector. The RFI as a function of migration time is the raw signal, the electropherogram. FACE has the great advantage that individual glucan chains appear as separated peaks in the electropherogram (e.g. O’Shea and Morell[6]). Such baseline resolution, up to the 100th peak or higher, depending on the pretreament of the sample and the condition of the CE, is ideal for analyzing amylopectin CLD. Calibration is simple: one adds a marker of known DP, such as maltohexaose (DP6); because each DP is baseline-resolved, the DP corresponding to each peak in the sample is obtained merely by counting, because each peak corresponds to a sequential DP.
The area under the peaks in the electropherogram gives Nde(X) directly. Some FACE CLD data are shown in Fig. 6. These unpublished data from our laboratory were obtained with a PA 800 plus Pharmaceutical Analysis System (Beckman Coulter, China) and cover a much more extended range of DP (6 and up to 165) than is usually found in the literature (which typically range over 6 to 50–60 (e.g. O’Shea et al.[10]). The data are presented both as Nde(X) and as log10Nde(X).[16] While the former is what is frequently used for presenting CLD data in the literature, the logarithmic representation of the same data brings out features at higher DPs which are not obvious in the conventional presentation (CLD of higher DPs is at least one to two orders of magnitude less than of the lowest DPs), as well as being a form based on mechanistic precepts.[1,16–18] The conventional treatment of Nde(X) is the difference plot, where one CLD is subtracted from another. However, difference plots require particular care not to introduce artefacts from incorrect normalization.[16] A quantitative treatment of Nde(X) has been shown to provide in-depth understanding of starch biosynthesis (see below).
|
Like FACE, HPAEC also offers baseline resolution of individual peaks and yields Nde(X) directly. CLD data from HPAEC are more common in the literature than those from FACE, because the instrumentation is more widely available. However, a problem with HPAEC is that the detector used, pulsed amperometric detection (PAD), gives a different response for chains of different length. Therefore, the peak area in a HPAEC chromatogram does not directly reflect the CLD,[19] and thus data are only semiquantitative. Wong et al.[20] devised a method that can potentially overcome the detection problem with PAD. An additional postcolumn enzyme reactor with immobilized amyloglucosidase (AMG) converts HPAEC-separated glucan chains to glucose before analysing with PAD. This HPAEC-ENZ-PAD system was shown to detect glucan chains with a DP up to 77. However, the disadvantage of the system is that the conversion of glucan chains into glucose may not be quantitative, because short glucan chains such as maltose and maltotriose are more resistant to AMG hydrolysis.
SEC is also more common than FACE. It is essential to ensure that the SEC eluent and operating conditions used do not induce artefacts caused by retrogradation (partial crystallization of linear glucan chains from debranching of starch before or during the separation and detection steps); see for example Hernandez et al.[21] SEC has the great advantage over FACE and HPAEC that the signal of the most common type of detector, differential refractive index (DRI), is proportional to molecular weight for linear glucans, and thus SEC can detect DPs orders of magnitude greater than is possible with FACE or HPAEC; however, SEC data suffer from band broadening and thus cannot reveal the fine structure apparent in both FACE and HPAEC (see below). The signal obtained using a DRI detector in SEC is not Nde(X) itself, but instead is given by the corresponding SEC weight distribution, wde(log X). The two are related by Eqn 1:[22,23]

For a linear glucan, the relation between molecular weight and DP is:

Here 162.2 is the molar mass of the anhydroglucose monomeric unit and 18.0 that of the additional water in the end groups.
The actual relation between DRI signal SDRI(Vel) at a given elution volume Vel and wde(log X) requires some data processing:[22–24]
and is usually performed by the SEC software. The dependence of elution volume (which depends on the experimental set-up and operating conditions) on molecular weight (which is a molecular quantity, independent of running conditions), is the calibration curve, Vel(log M). This is obtained using a range of narrowly dispersed molecular weight samples. The factor of X2 in Eqn 1 arises from two effects. The first is, as stated, that the DRI signal is proportional to mass, which accounts for one of the factors of X in Eqn 1. The second is because the calibration curve Vel(M) is approximately linear in log M over a significant range, and the second factor of M (or X) in Eqn 1 comes from the dVel/dlog M term in Eqn 3, this term then being proportional to M.
The standards used for calibration of SEC for starch are not highly monodisperse linear glucans from debranching of starch, as these are unavailable. Instead pullulan standards are usually employed. This means that the molecular weight axis is in fact that of the standard, not of the starch. There are two ways around this problem.
The first is to measure the molecular weight of the eluting sample at a given elution volume directly, using a multiple-angle laser light scattering (MALLS) detector. This in turn requires the value of the variation of refractive index with polymer concentration in the eluent, dn/dc. While a good MALLS signal is hard to obtain at low molecular weights, recent advances in MALLS detectors make this possible in systems in which the value of dn/dc is not too low, such as aqueous eluents[25] (note however that the value of dn/dc used in this reference was found with an amylodextrin of low DP obtained by degrading starch with HCl; this is a branched molecule, and because the value of dn/dc depends on the branching structure, the value is incorrect for the analyte, which is unbranched).
The second is to use the universal calibration assumption[26,27] that the SEC separation is solely a function of the analyte’s hydrodynamic volume (Vh), not its composition or structure. For SEC, Vh is proportional to the product of the weight-average intrinsic viscosity and the number-average molecular weight[26–29] of a given sample:
For linear polymers, one has:
where K and a are the Mark–Houwink parameters for the particular type of polymer, solvent, and temperature in question. These in turn can be found by viscosity measurements, including use of an in-line viscometric detector in the SEC.
SEC suffers a major disadvantage compared with FACE and HPAEC: band broadening. This is an unavoidable effect arising because, no matter how good the column, an eluted sample in a narrow slice of elution volume will always contain a narrow but significant range of hydrodynamic volumes, due to diffusion. While this does not have much effect on average quantities such as the weight-average molecular weight ( ), it significantly affects the actual distributions, as illustrated for example in Castro et al.[30] and in van Berkel et al.[31] While methods for overcoming this problem have been developed,[30,32–36] these have yet to be routinely implemented for starch CLD. It is also important to be aware that the extent of band broadening varies with the SEC set-up and indeed can vary from day to day within a given set-up.
Two common averages of the CLD are the degree of branching (DB) and amylose content. The DB is given by
This quantity can also be measured directly by NMR spectroscopy.[5,8]
Amylose content can be measured by several techniques, including debranched SEC,[37] concanavalin A precipitation,[38,39] iodine colourimetry,[40] and a new 2D SEC × SEC method.[41] The debranched SEC method involves a somewhat arbitrary definition of DP 100 as the lower limit for amylose chains, which is most applicable for rice CLDs.[41,42]
Some Structure–Property Relations
The CLD shows several features, as illustrated by the letters on the data for a Nipponbare rice starch shown in Fig. 6 (unpublished data, extraction and sample preparation using the method of Li et al.[43]). These features are as follows.
Feature A is a small shoulder, or sometimes just a change in slope at very low DP, which arises from the way that starch branching enzymes (SBEs) act.[17,18] An SBE cleaves a branch into two segments; the donor segment is transferred to an α-(1,6) position, forming a new branch on the same or another branch. Both the donor and residual segments continue to elongate (through a starch synthase). There is a minimal chain-length requirement on both the donor and the residual segments, denoted Xmin and X0, respectively.[17,44–46] Thus SBE cannot cleave chains with a DP less than Xmin + X0. Feature A is due to the minimum chain-length requirement for the residual segment.
Feature B is the global maximum, which lies between Xmin and Xmin + X0,[17] followed by a decreasing slope, typically over DP 13–33. Features A and B correspond to typical branch lengths that are confined to a single lamella. DPs around the global maximum are predominantly formed by an action of a set of starch-biosynthesis enzymes, denoted enzyme set (i).[17,18] An ‘enzyme set’ comprises one particular type of starch synthase (one of SSI, SSII, SSIII, and SSIV), one particular type of branching enzyme (SBEIIa, SBEIIb, …), and one particular type of debranching enzyme.
A small shoulder after the global maximum in this range (Feature C, at DP 15 to 18) is frequently apparent, which is where chains formed from a second enzyme set become significant. The small change in the shape of log10Nde(X) after this small shoulder suggests that this enzyme set (ii) acts similarly to enzyme set (i).
For DPs 32–34, there is a second maximum or shoulder with distinctly different shape (made up of Features D and E), corresponding to chains which span two crystalline lamellae.[18] Features D and E for these crystalline-lamella spanning chains are likely to arise from similar enzymatic mechanisms to those that gave Features B and C for single-lamella ones (see above). In the example shown in Fig. 6, Features F and G show the chains that span three crystalline lamellae. Again, it is expected that the enzymatic mechanisms for Features F and G are similar to that for Features B and C. Feature H appears as a monotonically decreasing slope and is approaching the chain length for that of amylose, where there is no apparent feature (e.g. Fig. 7). Features F and beyond are only apparent because the data of Fig. 6 span a significantly larger range of DP than is normal for FACE.
|
Fig. 7 shows CLD data (a different rice starch to that of Fig. 6; the experimental details are the same as those in Syahariza et al.[47]) obtained using SEC; these data are shown both as log10Nde(X) with a linear X axis, and as the corresponding weight distribution wde(log X) with a logarithmic X axis. These are obtained from the experimental SEC distribution using Eqns 1, 3, and 4. One sees that a monotonically decreasing Nde(X) will have a maximum as wde(log X): e.g. the common form Nde(X) = exp(–αX) (found in free-radical polymerization[22]) becomes wde(log X) = X2exp(–αX).
The following features are apparent in Fig. 7. The amylopectin CLD is seen at low DP; this is similar to the FACE data in Fig. 6, but the band broadening inherent in SEC means that fine structural features apparent from FACE data are not seen. At DPs above 100, one sees the amylose chains. A feature which is seen in published data but has only been commented on recently[47] is the presence of at least three separate maxima in the amylose chains, at X ~250, 1 × 10³, and 5 × 10³, on the wde(log X) plot. This suggests more than one set of enzymatic processes for the amylose biosynthetic process.
CLDs have been studied extensively to understand the functions and mechanisms of biosynthetic enzymes. Various studies on different types of soluble starch synthases (SSs) suggest they have specific roles in amylopectin synthesis.[48,49] Granule-bound starch synthase (GBSS) is the enzyme responsible for the synthesis of amylose chains. Loss of GBSS in waxy varieties results in a large decrease or disappearing of amylose.[50,51] Mutation in rice starch branching enzyme IIb (SBEIIb), referred to as the amylose extender, showed a decrease in the short amylopectin chains with 6 ≤ X ≤ 36 together with an excess of long amylopectin chains with X ≥ 37,[52] and as such it seems that rice SBEIIb is responsible for short amylopectin branch production. The debranching enzymes isoamylase 3 and pullulanase are most likely to be involved in removal of short chains during degradation, since the removal of both enzymes resulted in an excess of chains with 3 ≤ X ≤ 5 in Arabidopsis.[53,54] Mutations in isoamylase debranching enzymes (ISA1 and ISA2) resulted in decreased or abolished starch synthesis and is replaced by a water-soluble polysaccharide, phytoglycogen.
A quantitative model for amylopectin CLD has been developed,[17,18] based on the conclusions from the studies summarized in the preceding paragraphs. The model provides in-depth understanding of starch biosynthesis. It is the first tool for parameterizing starch CLD with mechanistically based enzymatic rate ratios which can replace the current empirical treatment of starch CLD. The model also shows that only certain enzyme rate ratios can result in normal starch formation, and thus only limited changes in the starch biosynthetic pathway are viable for starch synthesis. The model has potential in exploring new ways to alter the structure of starch to produce starches with altered properties and functionality for food, human health, or industrial applications
Various uses of Level 1 data for obtaining structure–property relations are now exemplified. The property and functionality of starch in the food manufacturing and health industries are intimately related to its CLD. One important nutritional quality is enzyme digestion rate; a slow rate of glucose release and absorption is important for avoiding and managing health complications, especially obesity, diabetes, and colo-rectal cancers.[55,56] A general consensus is that starches with long branches display this nutritional quality due to the ability of long chains to form double helices (a type of recrystallization and retrogradation), which slows down the rate of digestion.[57,58] The amylose-extender mutant, defective in SBEIIa, produced high amylose starch.[59] Down-regulation of rice SBEIIb caused an increase in both long amylopectin chains and amylose chains,[52] and starch containing these long chains can undergo retrogradation during digestion. Retrograded starch inhibits susceptibility to further enzyme attack, which can also reduce the rate of digestion.[60,61] Starch with a higher proportion of long chains is usually termed a ‘high-amylose’ starch. High amylose starches are correlated with a type of resistant starch (RS).[62] RS is not digested in the small intestine and instead reaches the large intestine, where it is fermented to produce short-chain fatty acids, which have a role in maintaining bowel health and can assist in the prevention and treatment of colonic disease.[63,64]
The starch gelatinization temperature (GT) is an important trait affecting the rate of the processes required to drive the transition from flour to gel (e.g. in cooking). Rices are classified as either having a high or low GT.[65] The difference in GT can be explained by their differences in the amylopectin CLD. Starch with a CLD containing a lower portion of DP of 6 to 12 and higher portion of DP of 12 to 24 exhibits high GT.[66] Mutations in SSIIa have been associated with these differences:[67] e.g. a plant with inactive SSIIa produces starch with a lower GT.
In general, waxy cereal starches (i.e. with very low amylose content) have lower pasting temperatures. Waxy starch has a greater swelling power, because these short chains have weak interactions and are thus more readily hydrated.[68] Waxy mutants, defective in GBSSI, produce starch with a low amylose content (reviewd in Ball et al.[50]). It has been suggested that GBSSI is involved in the extension of long amylopectin chains.[69]
Level 2: Whole Branched Molecules
Complete specification of Level 2 structure requires a complicated distribution function which expresses the number of molecules in which a branch is found at DP X1 from the reducing end, and then after x1 monomer units there starts a secondary branch of DP X11, from which there is a branch x11 units from its end of DP X111, etc., while the original chain has a second branch point x2 units from the previous branch, the new branch having DP X12, and so ad infinitum.[1] This infinitely hierarchical distribution is denoted N(X1, x1, X11, x11, X12,…, X111,…, x111, X12, …; B), where B is the total number of chains in that molecule; see Fig. 4.
While the Level 1 distribution function can be measured directly experimentally (except for artefacts such as band broadening or mass bias), the complete distribution function for Level 2 cannot. Instead, various experimentally measurable ‘projections’ of this can be obtained, all of which can be written as appropriate integrals of the complete distribution function.[1]
Techniques and Assumptions
An essential requirement for characterizing the whole-molecule (fully branched) structure of a starchy material is that one has complete molecular dissolution without aggregation or degradation. This is not trivial: for example, starch from a grain is easy to dissolve fully in basic aqueous solution, but this can readily cause degradation, to a degree which depends on the pH. This problem has been considered in detail by several authors.[70–72] In brief, the initial extraction needs to use a solvent system which is effective at breaking hydrogen bonding while unlikely to cause chemical degradation; dimethyl sulfoxide with a small amount of lithium bromide is held to be optimal in this regard. Multi-step procedures are then required to remove lipids, proteins, and non-starch polysaccharides. The basic procedure given in these references needs to be tested and usually modified for a given type of substrate (e.g. lightly ground grains), always checking for loss of starch, aggregation etc., as described for example by Syahariza et al.[72]
The simplest measurable Level 2 quantities are the weight-average molecular weight and the z-average radius of gyration (Rg,z), both of which are obtained from MALLS (also termed static light scattering, or SLS) of molecularly dispersed starch, e.g. using Zimm or Berry plots.[73–75] A Berry plot is better for the high-molecular-weight component (amylopectin) while a Zimm plot is preferred for amylose.[76] Another technique is dynamic light scattering (DLS, also called photon correlation spectroscopy, PCS), which yields an effective size (usually termed hydrodynamic radius, although the same term is used in different contexts with a meaning that depends on the measurement method[77]). It is essential to be wary of experimental artefacts which can invalidate such measurements. The scattered light intensity varies approximately as the sixth power of the size, and thus measurements are highly sensitive to impurities such as aggregates. Thus it is important to check the reproducibility of values of and Rg,z by repeating the measurements on different days with replicate samples. The same holds for DLS, for which it is essential to carry out measurements at as low an angle as possible. This is because deducing an average size from the technique involves assuming that the ‘twinkling’ of scattered intensity is due to Brownian motion of the whole molecule (centre-of-mass motion, i.e. as if the molecule were rigid). In actuality, there are many dynamical modes of a molecule such as starch, from centre-of-mass motion through to motions of individual chains, clusters, etc. The DLS signal is only dominated by centre-of-mass motion at low angles (say, below 35°);[78,79] there are several commercial DLS devices which use back scattering, where the angle is large, and such devices can never yield a reliable value for an average size of starch without additional data. Another essential point to be aware of is that many commercial light-scattering devices report a size distribution. These are obtained from the scattering data making various assumptions, such as the form of the distribution. These reported distributions require additional information before they can be deemed even qualitatively reliable: for example, testing the assumed form of the distribution and the integration range used by the manufacturer’s software, if that is possible (for example, what is termed ‘research mode’ in one commercial package). Otherwise the technique can all too easily lead to artificial results for starch.[80,81] Let the buyer beware (‘Caveat emptor’)!
Other experimentally observable Level 2 distribution functions are the various one-dimensional ones that are obtained from multiple-detector size separation, such as SEC or asymmetric-flow field-flow fractionation (AF4). The ‘universal calibration’ assumption[26,27] is that these techniques separate by a size parameter, which by the IUPAC definition[77] is always termed hydrodynamic volume, Vh (or the corresponding hydrodynamic radius Rh, with Vh = 4/3πRh3), which is not the same as Rg. For SEC, the Vh is given by Eqn 4.
For AF4, different modes of separation are possible,[82] and it is essential to ensure that the AF4 flow parameters used are such that separation is actually by size (which in this case is that inferred from the centre-of-mass diffusion using the Stokes–Einstein relation[82]). Unfortunately, it has been shown[70] that the conditions whereby size separation can be achieved with AF4 for amylopectin are such that the signal-to-noise ratio from a mass-sensitive detector is very poor, so AF4 cannot be used for amylopectin without major technical advances. However, it has been used correctly for amylose and for degraded amylopectin (e.g. Rolland-Sabaté[83]). A potential way around the AF4 problem for amylopectin has recently been developed.[84]
For complex branched polymers such as starch, it is essential to be aware that there is no unique relation between size (the separation parameter Vh) and molecular weight (M). This is because there are an infinite number of branching structures that a complex branched polymer with a given molecular weight could exhibit, and it is these branching structures that determine the size. This is not the case for a linear polymer, where there is obviously only a single unique branch for a given molecular weight.
In size separation, one obtains a signal from a detector (see below) as a function of elution volume Vel (or equivalently elution time). The relation between the separation parameter Vh, which is a molecular property and thus independent of the characterization device, and Vel (which depends on the experimental set-up) is found by calibration. For SEC, the universal calibration assumption means that this can be done using a linear polymer, as follows. One takes a monodisperse sample of a linear polymer with molecular weight Mlinear polymer, measures its viscosity and thus finds the corresponding Vh, using Eqn 4. Then one determines the elution volume for each of a series of such monodisperse linear polymers, and thus constructs the calibration curve Vel(Mlinear polymer) and thus Vel(Vh). This must be done for the particular eluent and temperature at which SEC characterization is performed. There are significant limitations on this for Level 2 distributions of starch,[85] particularly the absence of linear standards of high molecular weight of a polymer (typically pullulan) which is soluble in the eluent of choice for starch (e.g. DMSO/LiBr), and also the impossibility of avoiding shear scission for polymers in the amylopectin size range. These currently put an upper boundary of ~50 nm on the sizes of starch molecules which can be characterized by SEC without significant technical advances.[85]
Multiple detection following size separation is usually with three types of detectors: viscometric, differential refractive index (DRI), and MALLS.
-
The viscometric detector yields the number distribution of the fully branched starch,[1,86] N(Vh), the (relative) number of molecules with hydrodynamic radius Rh. One has the following relation between the signal, which is the specific viscosity (ηsp) of the eluting polymer solution, and the number distribution:[1,86]
-
-
The DRI detector yields the ‘SEC weight distribution’ w(log Vh), which is the (relative) weight of molecules with a hydrodynamic radius in the range log Vh to log Vh + d(log Vh). The reason for this apparently strange definition is that w(log Vh) is the DRI signal that would be obtained using an ideal SEC where there is no band broadening and where the calibration curve of Vel(Mlinear polymer) is linear in log Mlinear polymer. The relation between DRI signal and weight distribution is given by the equivalent of Eqn 3:
-
-
MALLS detection, together with dn/dc, gives the Rh dependence of both weight-average molecular weight and z-average radius of gyration:
(Rh) and Rg,z(Rh). The well known method for going from the light-scattering signals at different angles and and Rg,z is given, for example, in a recent review.[14] It is noted that an accurate determination of dn/dc is essential in this regard; this is best done using differential refractometry, for which commercial instruments are available.
While for linear (homo)polymers, these four distributions – N(Vh), w(log Vh), (Vh), and Rg,z(Vh) – are trivially related, that is not the case for a complex branched polymer such as starch. For complex branched polymers, each type of distribution provides independent information which could be used to learn about the biosynthesis–processing–structure–properties relations of Fig. 5.
In addition to these four one-dimensional distributions, it has recently become possible to obtain (with considerable effort) two-dimensional distributions, where one dimension is the length of individual chains and the other is the total size of the branched molecule.[41,87,88] This involves size separation of the fully branched molecule using preparative SEC, followed by collection of fractions with different (relatively narrow) Vh ranges, debranching these fractions, and then performing further SEC on these debranched fractions.
Some Structure–Property Relations
To date, there have been relatively few applications of Level 2 structural characterization to starch biosynthesis–processing–structure–properties relations. Some examples from the authors’ group are summarised here.
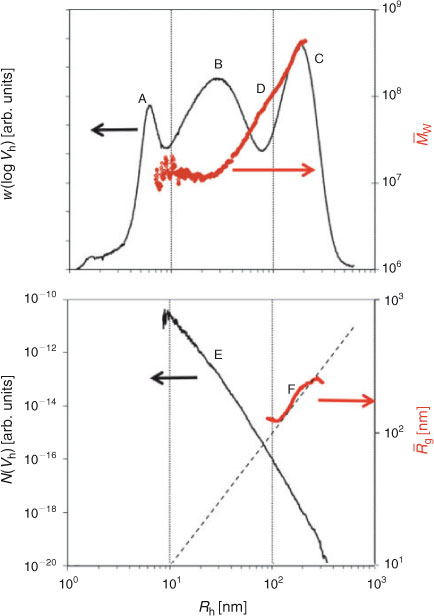
Fig. 8 (unpublished data, with experimental details of the multi-detector SEC set-up the same as those of Sullivan et al.[89]) shows the four independent one-dimensional distributions for a sample of barley starch. One sees the following features, as indicated by letters in this figure. Note that the size ranges shown for the four distributions given in this figure exclude data from the ranges with poor signal-to-noise ratios. Furthermore, problems with both size calibration (lack of large standards) and shear scission in the system mean that the Rh axis is only semiquantitative for sizes above ~50 nm.
|
The SEC weight distribution w(log Vh) shows an artefact due to the presence of unremoved protein at low Rh, Feature A. Feature B is the amylose peak, while Feature C is that for amylopectin. It is noted that it is hard to obtain good size separation for both of the features with the same set of columns, because of band broadening. It is for this reason that it is far better to use debranched SEC data to obtain the amylose-to-amylopectin ratio, rather than the fully branched distribution as in Fig. 8. The size distribution of (which is of course an increasing function of Rh), Feature D, shows an approximate power-law behaviour, from which one can obtain the de Gennes exponent νg:[90]

if it is assumed that Rh ~ Rg, which will be seen to be a reasonable approximation for amylopectin. This exponent gives information on polymer architecture and conformation.[91]
The number distribution, Feature E, is monotonically decreasing. It can be fitted to an approximate exponent n of 6 in:

The reason for the value of 6 for this exponent is the presence of Vh2 ~ Rh6 in the denominator of the relation between viscometric signal and N(Vh), Eqn 7; the other terms in this relation vary much less strongly with size. Number distribution data have only been exploited in a handful of cases (e.g. Sullivan et al.[92]) but have considerable potential to yield new knowledge. The form of N(Vh) is controlled by the events which stop growth of a whole starch molecule (not just individual chains), about which there is very little knowledge (there seems to be only one exploration of this in the literature[93]). The lack of a maximum or shoulder in the N(Vh) shows that whatever the growth-stopping event(s) is (are), there is no size specificity over the size range shown.
One might wonder why N(Vh) does not show some noticeable change over the range where w(log Vh) shows the change from amylose to amylopectin. This is because N(Vh) is the number distribution while w(log Vh) is the weight distribution. The weight distributions of amylopectin and amylose have maxima at very different sizes, and therefore the sum of these, i.e. the observed weight distribution w(log Vh), has two separate maxima. The number distribution of each as a function of size is not known, but probably both are monotonically decreasing, and the sum, i.e. the observed number distribution N(Vh), will thus not show separate maxima or a shoulder.
Finally, Feature F is the dependence of (z-average) radius of gyration on hydrodynamic radius (note that the range of this distribution where there is a good signal-to-noise is relatively small with the particular set-up used for obtaining these data). While there is no a priori reason for the two measures of size, Rg and Rh, to be related (the former is the square root of the mass average of the square of position, while Rh is found through Vh in Eqn 4, and is related to viscosity), it is seen that the two are close over the size range for which data are available, which is essentially that of amylopectin.[14]
Some structure–property relations from Level 2 data are now given. Processing of starch-related materials by both milling (as in flour-making) and extrusion (as in making pasta and, in combination with appropriate additional substances, in making biomaterials) involves significant changes in Level 2 structural features. The most straightforward is simple reduction in size of the whole molecule. Studies on the evolution of both Level 2 and Level 1 structures during these processes[94,95] show first that amylopectin is preferentially degraded compared with amylose, which is unsurprising because of its larger size. In addition, it is found that this degradation brings the starch down to a maximum stable size (which depends on the mechanical conditions). This is qualitatively and quantitatively similar to the maximum droplet size achieved when an emulsion (e.g. of oil in water) is subjected to high shear. The resulting high-shear size distribution is around a maximum size which is a function of shear rate, interfacial tension, and viscosity of the discrete phase.[85,96] The maximum size of degraded amylopectin is often in the amylose size region, but the branching structure of these two components (relatively undegraded amylose and degraded amylopectin) is quite different, and thus their functional properties, such as rheological ones and digestibility, are also very different.
Another example is in degradation during enzymatic digestion which, as discussed above, is of considerable importance in the amelioration of some human health problems due to the desirability of a reduced digestion rate. A reduced digestion rate is found in foods which contain resistant starch in significant quantities, and so-called high-amylose starches are advantageous in this regard. Examination of the evolution of Level 1 and 2 structures during in vitro digestion[97] shows that this RS is ~2.5 nm in size, and formed by the breaking of longer chains from both amylose and potentially the longer chains of amylopectin.
It is also important to be aware that some structural characteristics may have no effect on certain functional properties. Just to give one of many examples, overall has negligible effect on in vitro digestibility,[98] simply because digestibility is influenced by structural characteristics such as the CLD (Level 1) and crystallinity (Level 3), which are not influenced by this particular Level 2 structural characteristic (i.e ).
Level 3: Crystalline and Amorphous Lamellae
Level 3 starch structure encompasses many different structural features that are related to the aggregation of starch chains with one another. The structures can be seen as increasing in the hierarchy of order in the following manner: starch chains aggregate into pairs of starch molecules which become entwined in a helical structure; the helices aggregate to form crystallites; finally the crystallites form layered crystalline-amorphous lamella.
The helical structures of starch can be described in two ways: the type of helix, i.e. double or single helices, can be defined as well as the proportion of starch chains that are involved in helices. The double helices are left handed parallel stranded helices that include six glucose units per turn;[99] the single helices are left handed and the number of glucose units per turn varies with the complexing agent used in the production of the single helices. Native starch is typically complexed with lipids and displays six glucose unit turns.[100,101] The single helices form V-type crystallites while the double helices can produce A- or B-type crystallites. V-type crystallites involve lipid complexes.[99,102] A-type crystallites have a monoclinic unit cell[103,104] and B-type crystallites are formed by a hexagonal unit cell which contains a large water channel.[105,106] C-type crystallinity is a mixture of both A- and B-type crystallites, with A-type crystallites typically localized at the granule periphery and B-type closer to the centre.[107]
The full distribution function describing Level 3 structure is Ncryst(RA, RB, RF, Ramorph, R′A, R′B, R′F, R′amorph): the probability of being at a point, RA, where there is A-type crystallinity and finding A-type crystallinity at a point R, B-type crystallinity at R, etc. Various experimental techniques give different averages of this distribution, as shown in Fig. 4.
Techniques and Assumptions
Solid-state 13C cross-polarized magic angle-spinning (13C CP/MAS) NMR spectroscopy can be used to observe the different helical polymorphs (A-, B- and V-types).[108–110] When used with an amorphous starch reference spectrum that is subtracted from the total spectra, it is possible to produce spectra which represent the order in a starch sample. The results from these methods are averaged over the entire sample set, so there may be a great deal of hidden variation between granules as well as within granules. For example, it is impossible to determine the difference between a population of granules which each contain 2.5 % single helices, compared with a population of granules, half of which contain 5 % single helices. The method is sensitive to the subtraction of the amorphous signal to avoid underestimation of the helical content, which can be strongly influenced by starch ageing.[111]
Fourier transform infrared (FTIR) spectroscopy is a technique which can be used to examine some of the same properties as those observed by 13C CP/MAS NMR spectroscopy, such as the helical order within the starch sample. FTIR can be used to observe the relative height of peaks related to ordered and amorphous starch resulting in a measure of the samples’ helical content; these peaks are at 1000 and 1022 cm–1 respectively.[112,113] However, the ratios of these peaks are quite sensitive to water content, as there is a large overlap between water peaks and the peaks of interest.[112,114] This makes the production of absolute values using FTIR quite difficult, as the positioning of the baseline for analysis is crucial. Finally the technique is unable to distinguish between the different crystalline polymorphs of starch.[115] Despite these downsides, FTIR can, unlike 13C CP/MAS NMR spectroscopy, be used to observe changes due to the gelatinization of starch in water,[114] as well as potentially observe the surface, rather than bulk, of the starch sample.[115]
X-Ray diffraction (XRD), frequently used interchangeably with the similar wide-angle X-ray scattering (WAXS), measures the type and average proportion of crystallinity within a starch sample. Traditionally the method used to determine crystallinity with XRD has been to use a two-phase concept that assumes that relatively perfect crystalline areas are interspersed in amorphous regions. This model is not compatible with more complex structures possible in a polymeric system, such as lamellar crystalline growths, lattice dislocations, and chain folding. The crystalline-defect model takes into account the fact that a portion of the X-ray scattering from crystalline domains is diffuse and contributes to the amorphous background of the two-phase model.[116] A further refinement of this model separates the poorly formed crystallites from perfectly formed ones, in an attempt to define the whole crystallite structure more thoroughly.[117] As with the proportion of helices, the proportion of crystallinity is an average value of the whole sample and, as such, is unable to differentiate between different distributions of crystallites in different locations. This is particularly important for C-type crystallites, as it has been shown that there is a tendency for a greater amount of B-type crystallites to be in the interior of the granule than the exterior.[107] This raises the question about the consistency of crystallites throughout single crystallite type granules.
The next level of the structural hierarchy is the aggregation of the starch crystallites into crystalline-amorphous lamellae. The lamellae can only be observed using small-angle X-ray or neutron scattering (SAXS or SANS). The analyses of SAXS and SANS data are similar. The major difference in treatment between the two techniques is due to the differences in their scattering. X-rays scatter by interacting with electron density, which increases with atomic number, while neutrons scatter when they interact with nuclei, which change with isotopic content. The smaller chance of scattering against nuclei, as opposed to electron density, results in a dramatically worse signal-to-noise ratio for SANS, although this effect also gives neutrons a more penetrating power, which allows them to be used to perform in situ experiments that are not possible with X-rays. The observation of the in situ changes of the crystalline-amorphous lamella properties of starch in a rapid visco analyser are made possible by the greater penetrative power of a neutron beam.[118] The use of contrast matching in neutron experiments by altering the isotopic content of the sample, usually done using H2O and D2O, allows a more thorough probing of the scattering density differences of different starch structures, such as the differences in water content in the different lamellar regions.[119] The data treatment of both techniques is, however, broadly similar, so from this point forward only SAXS will be considered.
SAXS patterns of starches typically display a broad scattering peak, which represents the repeating crystalline-amorphous lamella structure found in native starch. This broad scattering peak is reciprocally related to the average thickness of the crystalline-amorphous lamella repeat,[120] which is typically 9–10 nm in size.[121–125] There are several different modelling methods to analyse SAXS data that can provide more information than just this average repeat distance. There is a variety of different paracrystalline models that differ in the number of parameters they attempt to fit. The model of Cameron et al.[126] treats the lamellar structure of starch as arising from three contrast differences: crystalline and amorphous lamellae in a finite stack embedded in an infinite amorphous background. Daniels et al. refined this model in an attempt to take into account the differences in scattering that arise from changes in ideally formed lamellae caused by layer bending and non-smooth lamellar layers.[127] While much is to be learned from these fitting methods, there are significant levels of uncertainty in the individual parameters because of the increase in the number of parameters.[120]
Another method is based on the application of correlation functions to the Fourier transform of SAXS intensity data. This can be interpreted to produce structural parameters that describe the repeat distance, crystalline and soft amorphous block thicknesses, the width of the transition layer, and electron density contrast.[120] The repeat distance as measured by correlation functions has been noted to be consistently smaller than that from intensity profile analysis. This is attributed to the assumption that there is a well defined Guinier region that can describe the low q regions of the scattering data. In reality this area is affected by larger granule structures such as growth rings and surface scattering.[120]
Another method that can be used is an empirical method that fits the data to equations that describe the SAXS peak and any underlying diffuse and interfacial scattering. This approach fits the peak data with a Gaussian or Lorentzian curve while accounting for the diffuse background scattering using a power law function.[128] In this way the Gaussian curve describing the peak can provide information on the repeat distance (the inverse of the q-space position of the peak), lamellar dispersity (the width of the peak), and amount of order and difference in electron density (the height of the peak).
The direct examination of the crystalline portion of the crystalline-amorphous lamellae is possible under appropriate conditions when using differential scanning calorimetry (DSC). DSC measures the amount of energy that is required to increase the temperature of a sample with reference to a material with known temperature change. In the case of starch in excess water, there are two endothermic peaks apparent in the DSC thermogram. The first is attributed to the melting of the crystalline-amorphous lamellae, while the second is attributed to the melting of amylose-lipid complexes. The endotherm that represents the melting of the crystalline-amorphous lamellae can be interpreted using the van’t Hoff equation to infer structural information on the cooperative unit of the crystallites within the starch. The properties of the crystallite within the crystalline-amorphous lamellae can then be inferred. The van’t Hoff equation requires that there is a low starch concentration to avoid the effect of polymer aggregation, and a low rate of temperature change to avoid any kind of thermal lag effect.[129] This provides an estimate of the length of crystalline lamellae, and allows a direct comparison with the paracrystalline modelling results from SAXS. Yuryev et al. found that the values provided by the two different methods were within the same range, but there was no direct correlation between the parameters.[130]
As with all of the other methods discussed thus far, both SAXS and DSC produce results that are averaged over the entire sample. Any significant variation within a sample will not be seen unless separation occurs before analysis. With any kind of separation it is necessary to check that no artefacts are introduced into the results by the separation process.
Some Structure–Property Relations
The most significant uses of the understanding of Level 3 structures have been found in gelatinization, annealing, and hydrothermal treatment of starches and digestion of starches.
Gelatinization and annealing are the most common type of non-chemical structural modification performed on starch. Gelatinization removes all or most native Level 3 structure. Annealing produces a sharper crystalline peak in WAXS and an increase in the gelatinization temperature of the native starch without any structure loss.[131] The behaviour of starch in water with the application of heat is explained largely by the application of these Level 3 structural elucidation techniques. Cameron et al. used SAXS to observe the change in electron densities in the amorphous growth region, crystalline lamellae, and amorphous lamellae. They found that as gelatinization progressed, the amorphous growth region rapidly absorbed water, followed by the amorphous lamellae, and finally a disruption to crystallites was seen.[126] The further removal of structural order is explained by the side-chain liquid-crystalline polymer model.[132] In situations with excess water, there is a single transition during gelatinization. This is because in excess water, the helix–helix dissociation is the rate-determining step, after which the helix unwinding is rapid. In limiting water a greater amount of energy is required to cause helix unwinding than to disrupt helix–helix interactions; for this reason two transitions are seen in DSC. This is applicable in limited water as the loss of the SAXS peak is observed during the first transition; the loss of helical order as determined by the loss of birefringence occurs during the second DSC transition.[132]
Annealing and hydrothermal treatment are both methods of processing granular starch in the presence of heat and water that increase its gelatinization temperature. Annealing occurs in excess water and at temperatures below the gelatinization onset, while heat moisture treatment is at limiting water concentrations and much higher temperatures. The effect of annealing and heat moisture treatment was studied by Vermeylen et al.[133] using WAXS, SAXS, and DSC. It was found that annealing resulted in no change in crystallinity, while a sharpening of the crystalline-amorphous lamella peak occurred; this indicates that the increase in gelatinization temperature was related to more efficient packing of crystallites in the crystalline-amorphous lamellae. In contrast, heat moisture treatment results in the production of diffuse background scattering in the SAXS plot, indicating a disruption of the normal lamellar stacking. Combined with the increases in crystallinity being largely of A-type rather than the native potato starch B-type crystallites, this indicates that the change in crystallite type was most relevant for this starch treatment. A general example of the utility of the analysis of the Level 3 structures is that it provides a tool to discriminate between starches in relation to their processing properties. For example, if an application requires a starch that is not cooked until it reaches a relatively high temperature, the gelatinization temperatures can be measured and a starch with crystallites that melt at an appropriately high temperature could be chosen. In addition, if an improvement in the amount of crystallinity for a process is required, the starch with the greatest crystallinity after annealing could be chosen. While making these selection processes, it is important to ensure that a proper mechanistic explanation exists to underpin any decisions that are made.
Application of SAXS, WAXS, and DSC to the in vitro digestion of starch[134] showed that the process of digestion is similar to that of water entry into granules: first the amorphous growth regions are digested, followed by digestion of the amorphous lamella. These changes were observed as an increase in the proportion of crystallinity and an increase in the onset temperature of gelatinization with small decreases in the intensity of the small-angle scattering peak. The loss of intensity was ascribed to the freeing of starch crystallites from the crystalline-amorphous lamellae, which remain intact.
Together with the results from annealing and water absorption, a framework to select starches for applications related to starch digestion is now provided. Two potential examples are: (1) Two granular starches can have different digestion properties due to the rate of water transfer into each of them, so attempted improvements to this water transfer rate could be monitored by SAXS. (2) The production of highly crystalline starch by enzyme or acid hydrolysis could be accomplished by selecting a starch with greater crystallinity and crystalline-amorphous lamellar content, as measured by SAXS peak intensity, or by altering a starch so that these properties are more strongly exhibited.
Due to the averaging effect of the Level 3 analysis techniques, using other methods of separation can lead to interesting results. This is exemplified by Vermeylen et al.[135] who produced two separate wheat starch granules from single populations, one with large granules and the other small. These granules displayed different Level 3 structural properties. The larger granules had a higher proportion of B-type crystallites as well as an increase in crystallinity, while the smaller starch granules had more intense SAXS scattering patterns with decreased lamellar repeat distances. This was attributed to an increased crystalline lamellar density, containing longer double helices with shorter branching connectors inhabiting the amorphous lamellae. These results were supported by the increased gelatinization temperatures and narrower helix–coil transitions exhibited by the small granules. This serves as an example that the characterization of the Level 3 properties of starch contain significant potential for the advancement of the understanding of the biosynthesis, properties, and processability of starches.
Conclusions and Perspectives
Producing starch-containing materials (whether they be for human food, animal feed, biomedical polymers, or engineering plastics) with improved properties is best done following the paradigm of Fig. 5: understanding what structural characteristics are needed for the desired property, then seeing how these can be produced through choice (or breeding) of the starch-producing plant, and choosing optimal processing conditions. This review looks at the central plank in this platform: characterization of the three lowest structural levels (Fig. 3).
The characterization methods for Level 1 are well established, although some technical improvements are needed for amylose chains. There is a wealth of data and inferences on structure–property relations for this level for many functional properties, although effects of amylose chains have been neglected and offer considerable potential for new understanding. There is also a lot to be learnt by applying detailed biosynthesis models to extant and new data.
The methods for Level 2 are still under development, although the basic techniques have been well established. Obtaining systematic data on this structural level and using it in the biosynthesis–processing–structure–properties paradigm is still in its infancy, and offers considerable potential for future applications. Indeed, there is very little knowledge or understanding of just what functional properties depend on Level 2 structural characteristics.
The methods for Level 3 structural characterization are also well established, although there is considerable dependence on model assumptions in interpreting the raw data. There is a considerable literature on the corresponding structure–property relations. While there is a significant number of papers on how processing affects this structural level, there is very little knowledge as to how this structural level in native starch is determined by the underlying biosynthetic processes.
Unquestionably, the greatest advances in making starch-containing substances with improved functional properties will be when a unified, mechanistically based, biosynthesis–processing–structure–properties picture emerges, incorporating all three levels together.
Acknowledgements
TW gratefully acknowledges the support of a postgraduate scholarship from the Australian Institute of Nuclear Science and Engineering; ACW acknowledges the support of a CSIRO Postgraduate Scholarship. The support of an Australian Research Council Discovery Grant, DP130102461, is gratefully acknowledged.
References
[1] A. Gray-Weale, R. G. Gilbert, J. Polym. Sci., Part A: Polym. Chem. 2009, 47, 3914.| Crossref | GoogleScholarGoogle Scholar | 1:CAS:528:DC%2BD1MXntlGgs7g%3D&md5=061ae1bac4cdb558c4e287b92c1fddadCAS |
[2] A. Buleon, P. Colonna, V. Planchot, S. Ball, Int. J. Biol. Macromol. 1998, 23, 85.
| Crossref | GoogleScholarGoogle Scholar | 1:CAS:528:DyaK1cXksV2jtbo%3D&md5=d51c819999b135a94f3b86d93ba97fd8CAS | 9730163PubMed |
[3] J.-l. Jane, K.-s. Wong, A. E. McPherson, Carbohydr. Res. 1997, 300, 219.
| Crossref | GoogleScholarGoogle Scholar | 1:CAS:528:DyaK2sXjs1ent7o%3D&md5=f5f8f87d61d2b04ebf83f7e98f746ecfCAS |
[4] P. J. Jenkins, A. M. Donald, Int. J. Biol. Macromol. 1995, 17, 315.
| Crossref | GoogleScholarGoogle Scholar | 1:CAS:528:DyaK28Xlt1Ciuw%3D%3D&md5=bbef03c17bd24461951a67e294d7e812CAS | 8789332PubMed |
[5] M. J. Gidley, Carbohydr. Res. 1985, 139, 85.
| 1:CAS:528:DyaL2MXitVGlurc%3D&md5=852b1eeff3688333f9d656b7ea7a4c2bCAS |
[6] M. G. O’Shea, M. K. Morell, Electrophoresis 1996, 17, 681.
| Crossref | GoogleScholarGoogle Scholar | 1:CAS:528:DyaK28XjvVajtrk%3D&md5=4924170e224f1db63c9609cd4a4fa957CAS | 8738327PubMed |
[7] R. M. Ward, Q. Gao, H. de Bruyn, R. G. Gilbert, M. A. Fitzgerald, Biomacromolecules 2006, 7, 866.
| Crossref | GoogleScholarGoogle Scholar | 1:CAS:528:DC%2BD28XhsVSqsLg%3D&md5=6fb31269c6b9617375706e79cc7a90f8CAS | 16529425PubMed |
[8] M. J. Tizzotti, M. C. Sweedman, D. Tang, C. Schaeffer, R. G. Gilbert, J. Agric. Food Chem. 2011, 59, 6913.
| Crossref | GoogleScholarGoogle Scholar | 1:CAS:528:DC%2BC3MXmvF2ls7g%3D&md5=5361db51aeeba495ba34f1b7cd23a9dfCAS | 21608525PubMed |
[9] M. K. Morell, M. S. Samuel, M. G. O’Shea, Electrophoresis 1998, 19, 2603.
| Crossref | GoogleScholarGoogle Scholar | 1:CAS:528:DyaK1cXnvFWntLk%3D&md5=2cb67aad10d03ee0719e9f71561b3b3dCAS | 9848667PubMed |
[10] M. G. O’Shea, M. S. Samuel, C. M. Konik, M. K. Morell, Carbohydr. Res. 1998, 307, 1.
| Crossref | GoogleScholarGoogle Scholar | 1:CAS:528:DyaK1cXkt1Srtrc%3D&md5=fa0829974041b16524b2818846ae10b3CAS |
[11] S.-H. Yoo, J. Jane, Carbohydr. Polym. 2002, 49, 307.
| Crossref | GoogleScholarGoogle Scholar | 1:CAS:528:DC%2BD38XjtF2lurc%3D&md5=3fcf7e400052eb9b5e8f8ee63ef469deCAS |
[12] K. L. Tomlinson, J. R. Lloyd, A. M. Smith, Plant J. 1997, 11, 31.
| Crossref | GoogleScholarGoogle Scholar | 1:CAS:528:DyaK2sXhtFGjs7c%3D&md5=4ca39fce1df003cf5fd5a8368b7e1ca4CAS |
[13] G. S. Nilsson, S. Richardson, A. Huber, N. Torto, T. Laurell, L. Gorton, Carbohydr. Polym. 2001, 46, 59.
| Crossref | GoogleScholarGoogle Scholar | 1:CAS:528:DC%2BD3MXkslWktr8%3D&md5=8f21dab369e082447b31e072b0e4a8f7CAS |
[14] F. Vilaplana, R. G. Gilbert, J. Sep. Sci. 2010, 33, 3537.
| Crossref | GoogleScholarGoogle Scholar | 1:CAS:528:DC%2BC3cXhsVCjs7vE&md5=46893232307a871a0d65498dd3602653CAS | 20960448PubMed |
[15] M. Breadmore, E. Hilder, A. Kazarian, in Capillary Electrophoresis of Carbohydrates: From Monosaccharides to Complex Polysaccharides (Ed. N. Volpi) 2011, pp. 23–52 (Humana Press: New York, NY).
[16] J. V. Castro, C. Dumas, H. Chiou, M. A. Fitzgerald, R. G. Gilbert, Biomacromolecules 2005, 6, 2248.
| Crossref | GoogleScholarGoogle Scholar | 1:CAS:528:DC%2BD2MXjs1KitL8%3D&md5=8126cc2637032553943f8d58edd498caCAS | 16004469PubMed |
[17] A. C. Wu, R. G. Gilbert, Biomacromolecules 2010, 11, 3539.
| Crossref | GoogleScholarGoogle Scholar | 1:CAS:528:DC%2BC3cXhtlyks77E&md5=ede64ecf460598cd8cb81735e36e27d5CAS | 21058715PubMed |
[18] A. C. Wu, M. K. Morell, R. G. Gilbert, PLoS ONE 2013, 8, e65768.
| Crossref | GoogleScholarGoogle Scholar | 1:CAS:528:DC%2BC3sXhtVSku7%2FP&md5=5e28f0c19a0ea310e8368e40fe6e1210CAS | 23762422PubMed |
[19] K. Koch, R. Andersson, P. Aman, J. Chromatogr. A 1998, 800, 199.
| Crossref | GoogleScholarGoogle Scholar | 1:CAS:528:DyaK1cXhs1Ghsb4%3D&md5=06b305597ea046be6a95bec101806e57CAS |
[20] K. S. Wong, J. Jane, J. Liquid Chromatogr. Relat. Technol. 1997, 20, 297.
| Crossref | GoogleScholarGoogle Scholar | 1:CAS:528:DyaK2sXhsFeht7Y%3D&md5=38c3e4557282261c068b810b6e56f5deCAS |
[21] J. M. Hernandez, M. Gaborieau, P. Castignolles, M. J. Gidley, A. M. Myers, R. G. Gilbert, Biomacromolecules 2008, 9, 954.
| Crossref | GoogleScholarGoogle Scholar | 1:CAS:528:DC%2BD1cXitlOms74%3D&md5=c8657ae93d19ccba1e2fa2ef97ce9640CAS | 18293900PubMed |
[22] P. A. Clay, R. G. Gilbert, Macromolecules 1995, 28, 552.
| Crossref | GoogleScholarGoogle Scholar | 1:CAS:528:DyaK2MXivVeku7g%3D&md5=df91bb96a8715b6ba64432648d80074bCAS |
[23] J. V. Castro, R. M. Ward, R. G. Gilbert, M. A. Fitzgerald, Biomacromolecules 2005, 6, 2260.
| Crossref | GoogleScholarGoogle Scholar | 1:CAS:528:DC%2BD2MXjs1KitLw%3D&md5=f4bca4fa183496140234135eaadd442cCAS | 16004470PubMed |
[24] M. Gaborieau, R. G. Gilbert, A. Gray-Weale, J. M. Hernandez, P. Castignolles, Macromol. Theory Simul. 2007, 16, 13.
| Crossref | GoogleScholarGoogle Scholar | 1:CAS:528:DC%2BD2sXhslyhu7Y%3D&md5=5a2e1fd47708354a0af45d98ce33ff56CAS |
[25] A. H.-M. Lin, Y.-H. Chang, W.-B. Chou, T.-J. Lu, J. Agric. Food Chem. 2011, 59, 5890.
| Crossref | GoogleScholarGoogle Scholar | 1:CAS:528:DC%2BC3MXlslCisLs%3D&md5=4aa908775aed94833d5f0723bd0facf4CAS |
[26] Z. Grubisic, P. Rempp, H. Benoit, J. Polym. Sci. Polym. Lett. 1967, 5, 753.
| Crossref | GoogleScholarGoogle Scholar |
[27] Z. Grubisic, P. Rempp, H. Benoit, J. Polym. Sci., Part B: Polym. Phys. 1996, 34, 1707.
| Crossref | GoogleScholarGoogle Scholar | 1:CAS:528:DyaK28XjvVKqsr8%3D&md5=9c27c8c7b3fd3ab303bae7ba89dfe81aCAS |
[28] A. E. Hamielec, A. C. Ouano, J. Liq. Chromatogr. 1978, 1, 111.
| Crossref | GoogleScholarGoogle Scholar | 1:CAS:528:DyaE1cXhtlOisr0%3D&md5=31f56a208f1d893cbd278203ea4b4029CAS |
[29] T. Kuge, K. Kobayashi, H. Tanahashi, T. Igushi, S. Kitamura, Agric. Biol. Chem. 1984, 48, 2375.
| Crossref | GoogleScholarGoogle Scholar | 1:CAS:528:DyaL2cXlvVOhsb4%3D&md5=0ad685d3f5355ba0f15a989d1f7602ddCAS |
[30] J. V. Castro, K. Y. van Berkel, G. T. Russell, R. G. Gilbert, Aust. J. Chem. 2005, 58, 178.
| Crossref | GoogleScholarGoogle Scholar | 1:CAS:528:DC%2BD2MXisVWlt78%3D&md5=da12285509c70101d13f674687f0f02cCAS |
[31] K. Y. van Berkel, G. T. Russell, R. G. Gilbert, Macromolecules 2005, 38, 3214.
| Crossref | GoogleScholarGoogle Scholar | 1:CAS:528:DC%2BD2MXisVSgs7Y%3D&md5=2f07204f2f090de8bda41fd4b97c80ebCAS |
[32] D. Konkolewicz, J. W. Taylor, P. Castignolles, A. A. Gray-Weale, R. G. Gilbert, Macromolecules 2007, 40, 3477.
| Crossref | GoogleScholarGoogle Scholar | 1:CAS:528:DC%2BD2sXjsVGqsrk%3D&md5=aacbb56c4df73f9bb7d83b229c8d893aCAS |
[33] I. Schnöll-Bitai, Macromol. Symp. 2005, 215–7, 357.
[34] J. R. Vega, I. Schnoell-Bitai, J. Chromatogr. A 2005, 1095, 102.
| Crossref | GoogleScholarGoogle Scholar | 1:CAS:528:DC%2BD2MXht1SrtbfN&md5=0e985f6bebf25f52f58612d2c7271687CAS | 16275289PubMed |
[35] I. Schnöll-Bitai, J. Chromatogr. A 2005, 1084, 160.
| Crossref | GoogleScholarGoogle Scholar | 16114249PubMed |
[36] C. Mader, I. Schnoell-Bitai, Macromol. Chem. Phys. 2005, 206, 649.
| Crossref | GoogleScholarGoogle Scholar | 1:CAS:528:DC%2BD2MXjtlSms7k%3D&md5=a97c46a9c5b53bf72803effbc82d4ab6CAS |
[37] M. A. Fitzgerald, C. J. Bergman, A. P. Resurreccion, J. Muller, R. Jimenez, R. F. Reinke, M. Martin, P. Blanco, F. Molina, M.-H. Chen, V. Kuri, M. V. Romero, F. Habibi, T. Umemoto, S. Jongdee, E. Graterol, K. R. Reddy, P. Z. Bassinello, R. Sivakami, N. S. Rani, S. Das, Y. J. Wang, S. D. Indrasari, A. Ramli, R. Ahmad, S. S. Dipti, L. Xie, N. T. Lang, P. Singh, D. C. Toro, F. Tavasoli, C. Mestres, Cereal Chem. 2009, 86, 492.
| Crossref | GoogleScholarGoogle Scholar | 1:CAS:528:DC%2BD1MXht1GjtrfF&md5=8c5dcb926dbf4f13c863637a7c941d91CAS |
[38] S. H. Yun, N. K. Matheson, Starch – Stärke 1990, 42, 302.
| Crossref | GoogleScholarGoogle Scholar | 1:CAS:528:DyaK3cXlslSmtbg%3D&md5=62369e6b254fdb6e384d7232fa85050dCAS |
[39] T. S. Gibson, V. A. Solah, B. V. McCleary, J. Cereal Sci. 1997, 25, 111.
| Crossref | GoogleScholarGoogle Scholar | 1:CAS:528:DyaK2sXisVartrg%3D&md5=8723002d0228da725bbc607070e07b5dCAS |
[40] B. O. Juliano, C. M. Perez, A. B. Blakeney, T. Castillo, N. Kongseree, B. Laignelet, E. T. Lapis, V. V. S. Murty, C. M. Paule, B. D. Webb, Starch – Stärke 1981, 33, 157.
| Crossref | GoogleScholarGoogle Scholar | 1:CAS:528:DyaL3MXksVSqsbY%3D&md5=dd28cca4140476a4fbc2872bfaea1040CAS |
[41] F. Vilaplana, J. Hasjim, R. G. Gilbert, Carbohydr. Polym. 2012, 88, 103.
| Crossref | GoogleScholarGoogle Scholar | 1:CAS:528:DC%2BC38XhtFKqsL8%3D&md5=e623dd342a5815916b2be8cde62e09afCAS |
[42] International Standardization Organization, ‘Determination of Amylose Content. ISO 6647-2’ 2011.
[43] E. Li, J. Hasjim, S. Dhital, I. D. Godwin, R. G. Gilbert, J. Cereal Sci. 2011, 53, 328.
| Crossref | GoogleScholarGoogle Scholar | 1:CAS:528:DC%2BC3MXnt1Kkurw%3D&md5=cda1faafef875dd2ac5f5b1253f592e2CAS |
[44] H. Guan, P. Li, J. Imparl-Radosevich, J. Preiss, P. Keeling, Arch. Biochem. Biophys. 1997, 342, 92.
| Crossref | GoogleScholarGoogle Scholar | 1:CAS:528:DyaK2sXjsVOgurs%3D&md5=4ea94a5592be622ba44f9178dad3f656CAS | 9185617PubMed |
[45] Y. Nakamura, Y. Utsumi, T. Sawada, S. Aihara, C. Utsumi, M. Yoshida, S. Kitamura, Plant Cell Physiol. 2010, 51, 776.
| Crossref | GoogleScholarGoogle Scholar | 1:CAS:528:DC%2BC3cXmtFOgs7Y%3D&md5=b300350b3ef0a66b07408fdfa01840e1CAS | 20305271PubMed |
[46] T. H. Nielsen, L. Baunsgaard, A. Blennow, J. Biol. Chem. 2002, 277, 20249.
| Crossref | GoogleScholarGoogle Scholar | 1:CAS:528:DC%2BD38XkslWgsbk%3D&md5=c1a481ee530383f0833a81614f4117cdCAS | 11919198PubMed |
[47] Z. A. Syahariza, S. Sar, M. Tizzotti, J. Hasjim, R. G. Gilbert, Food Chem. 2013, 136, 742.
| Crossref | GoogleScholarGoogle Scholar | 1:CAS:528:DC%2BC38Xhs1Wisb3N&md5=0d40a077782f3c7460e4d04edc6078c9CAS | 23122122PubMed |
[48] H. P. Guan, P. L. Keeling, Trends Glycosci. Glycotechnol. 1998, 10, 307.
| Crossref | GoogleScholarGoogle Scholar | 1:CAS:528:DyaK1cXmsVekurc%3D&md5=40ff0e3e16ae4b37006b836b9e5fce87CAS |
[49] M. K. Morell, B. Kosar-Hashemi, M. Cmiel, M. S. Samuel, P. Chandler, S. Rahman, A. Buleon, I. L. Batey, Z. Li, Plant J. 2003, 34, 173.
| Crossref | GoogleScholarGoogle Scholar | 1:CAS:528:DC%2BD3sXjvFOgt70%3D&md5=f883cb4341cb0fe9fd5c0c45928c360dCAS | 12694593PubMed |
[50] S. G. Ball, M. H. B. J. van de Wal, R. G. F. Visser, Trends Plant Sci. 1998, 3, 462.
| Crossref | GoogleScholarGoogle Scholar |
[51] M. van de Wal, C. D’Hulst, J. P. Vincken, A. Buleon, R. Visser, S. Ball, J. Biol. Chem. 1998, 273, 22232.
| Crossref | GoogleScholarGoogle Scholar | 1:CAS:528:DyaK1cXlvValsL8%3D&md5=bf4ce662d6543b4186474ceca9504213CAS | 9712837PubMed |
[52] V. M. Butardo, M. A. Fitzgerald, A. R. Bird, M. J. Gidley, B. M. Flanagan, O. Larroque, A. P. Resurreccion, H. K. C. Laidlaw, S. A. Jobling, M. K. Morell, S. Rahman, J. Exp. Bot. 2011, 62, 4927.
| Crossref | GoogleScholarGoogle Scholar | 1:CAS:528:DC%2BC3MXhtlejs77I&md5=ecb249b665103e47a60081bd5d4bf138CAS | 21791436PubMed |
[53] T. Delatte, M. Trevisan, M. L. Parker, S. C. Zeeman, Plant J. 2005, 41, 815.
| Crossref | GoogleScholarGoogle Scholar | 1:CAS:528:DC%2BD2MXisleitro%3D&md5=8e4683a7245e6d9c7e13d5203350ee32CAS | 15743447PubMed |
[54] F. Wattebled, V. Planchot, Y. Dong, N. Szydlowski, B. Pontoire, A. Devin, S. Ball, C. D’Hulst, Plant Physiol. 2008, 148, 1309.
| Crossref | GoogleScholarGoogle Scholar | 1:CAS:528:DC%2BD1cXhsVSnurvE&md5=e3a0eb97a333f9d2a71007c14c75621aCAS | 18815382PubMed |
[55] G. Zhang, B. R. Hamaker, Cereal Chem. 2010, 87, 331.
| Crossref | GoogleScholarGoogle Scholar | 1:CAS:528:DC%2BC3cXhtVejtbvF&md5=5e3632d380e520de76572ed8d55ff419CAS |
[56] R. A. King, M. Noakes, A. R. Bird, M. K. Morell, D. L. Topping, J. Cereal Sci. 2008, 48, 526.
| Crossref | GoogleScholarGoogle Scholar | 1:CAS:528:DC%2BD1cXhtVarsLnN&md5=1a795341e5f261259ef31c140e62d0c5CAS |
[57] G. E. Vandeputte, J. A. Delcour, Carbohydr. Polym. 2004, 58, 245.
| Crossref | GoogleScholarGoogle Scholar | 1:CAS:528:DC%2BD2cXhtVKltbfP&md5=a886b5f5f15ae3b64d29f0fa81d05a38CAS |
[58] L.-J. Zhu, Q.-Q. Liu, Y. Sang, M.-H. Gu, Y.-C. Shi, Food Chem. 2010, 120, 94.
| Crossref | GoogleScholarGoogle Scholar | 1:CAS:528:DC%2BD1MXhsFClu7jM&md5=f0b4e7e6999afbfd6e83efbd321c2f81CAS |
[59] A. Regina, A. Bird, D. Topping, S. Bowden, J. Freeman, T. Barsby, B. Kosar-Hashemi, Z. Li, S. Rahman, M. Morell, Proc. Natl. Acad. Sci. USA 2006, 103, 3546.
| Crossref | GoogleScholarGoogle Scholar | 1:CAS:528:DC%2BD28XivFWjtbY%3D&md5=362b22d49acfb797fe9dd1adb7c1fb5eCAS | 16537443PubMed |
[60] Z. H. Ao, S. Simsek, G. Y. Zhang, M. Venkatachalam, B. L. Reuhs, B. R. Hamaker, J. Agric. Food Chem. 2007, 55, 4540.
| Crossref | GoogleScholarGoogle Scholar | 1:CAS:528:DC%2BD2sXkvFKmur4%3D&md5=1f0a0405f93fb977179dd7155de337afCAS |
[61] G. Zhang, M. Sofyan, B. R. Hamaker, J. Agric. Food Chem. 2008, 56, 4695.
| Crossref | GoogleScholarGoogle Scholar | 1:CAS:528:DC%2BD1cXmsFCrtLk%3D&md5=a8caeaf5c9693933a042b26508a0da6bCAS | 18512933PubMed |
[62] G. Zhang, Z. Ao, B. R. Hamaker, J. Agric. Food Chem. 2008, 56, 4686.
| Crossref | GoogleScholarGoogle Scholar | 1:CAS:528:DC%2BD1cXmsFalsL4%3D&md5=7b954fd62d99a71cfff350c483505819CAS | 18512943PubMed |
[63] J. M. Clark, A. R. Bird, D. L. Topping, L. Cobiac, Am. J. Clin. Nutr. 2007, 86, 1146.
[64] C. Fassler, C. I. R. Gill, E. Arrigoni, I. Rowland, R. Amado, Nutr. Cancer 2007, 58, 85.
| Crossref | GoogleScholarGoogle Scholar | 17571971PubMed |
[65] R. P. Cuevas, V. D. Daygon, H. M. Corpuz, L. Nora, R. F. Reinke, D. L. E. Waters, M. A. Fitzgerald, Funct. Plant Biol. 2010, 37, 439.
| Crossref | GoogleScholarGoogle Scholar | 1:CAS:528:DC%2BC3cXlsFKmsr8%3D&md5=233b17d3a450f976039f6bcc84fc1d5bCAS |
[66] Y. Nakamura, A. Sakurai, Y. Inaba, K. Kimura, N. Iwasawa, T. Nagamine, Starch – Stärke 2002, 54, 117.
| Crossref | GoogleScholarGoogle Scholar | 1:CAS:528:DC%2BD38XjtlGrtbw%3D&md5=00d3dd961c1839a4f3bb2652021095a0CAS |
[67] T. Umemoto, N. Aoki, H. X. Lin, Y. Nakamura, N. Inouchi, Y. Sato, M. Yano, H. Hirabayashi, S. Maruyama, Funct. Plant Biol. 2004, 31, 671.
| Crossref | GoogleScholarGoogle Scholar | 1:CAS:528:DC%2BD2cXlvFGqsrk%3D&md5=684e22a638cfca7f9fca190916ab950eCAS |
[68] G. E. Vandeputte, V. Derycke, J. Geeroms, J. A. Delcour, J. Cereal Sci. 2003, 38, 53.
| Crossref | GoogleScholarGoogle Scholar | 1:CAS:528:DC%2BD3sXkvVaqt7o%3D&md5=085703b611208850e1778f6b7b473d35CAS |
[69] F. Wattebled, A. Buleon, B. Bouchet, J. P. Ral, L. Lienard, D. Delvalle, K. Binderup, D. Dauvillee, S. Ball, C. D’Hulst, Eur. J. Biochem. 2002, 269, 3810.
| Crossref | GoogleScholarGoogle Scholar | 1:CAS:528:DC%2BD38XmsVSitbw%3D&md5=4eacce6c119c683b2c2c3f2fac4936caCAS | 12153578PubMed |
[70] R. G. Gilbert, Anal. Bioanal. Chem. 2011, 399, 1425.
| Crossref | GoogleScholarGoogle Scholar | 1:CAS:528:DC%2BC3cXhsVymsbbN&md5=6f25e35e1467e78c4a3b474f43778462CAS | 21107973PubMed |
[71] S. Schmitz, A. C. Dona, P. Castignolles, R. G. Gilbert, M. Gaborieau, Macromol. Biosci. 2009, 9, 506.
| Crossref | GoogleScholarGoogle Scholar | 1:CAS:528:DC%2BD1MXmvVCrsLg%3D&md5=2c765e4be6cd8fb7ded61f71796770dbCAS | 19089874PubMed |
[72] Z. A. Syahariza, E. Li, J. Hasjim, Carbohydr. Polym. 2010, 82, 14.
| Crossref | GoogleScholarGoogle Scholar | 1:CAS:528:DC%2BC3cXosV2lt7o%3D&md5=2e9f395503ea24c8229de26e31f27928CAS |
[73] E. F. Casassa, G. C. Berry, in Comprehensive Polymer Science (Ed. G. Allen) 1988, pp. 71–120 (Pergamon: New York, NY).
[74] B. Chu, Laser Light Scattering, 2nd edn 2007 (Dover: Boston, MA).
[75] P. J. Wyatt, Anal. Chim. Acta 1993, 272, 1.
| Crossref | GoogleScholarGoogle Scholar | 1:CAS:528:DyaK3sXotFKrtg%3D%3D&md5=938016c1b07c197f1a2d95f5d37c5d1cCAS |
[76] M. Andersson, B. Wittgren, K.-G. Wahlund, Anal. Chem. 2003, 75, 4279.
| Crossref | GoogleScholarGoogle Scholar | 1:CAS:528:DC%2BD3sXltVWltb8%3D&md5=0096b44dfa6acd183b9ab194a1fe3659CAS | 14632147PubMed |
[77] R. G. Jones, J. Kahovec, R. Stepto, E. S. Wilks, M. Hess, T. Kitayama, W. V. Metanomski, Compendium of Polymer Terminology and Nomenclature. IUPAC Recommendations 2008 2009 (Royal Society of Chemistry: Cambridge).
[78] G. Galinsky, W. Burchard, Macromolecules 1997, 30, 6966.
| Crossref | GoogleScholarGoogle Scholar | 1:CAS:528:DyaK2sXmsFymt7Y%3D&md5=f9be620289bf17b776caa55053f5803fCAS |
[79] C. Yang, B. Meng, M. Chen, X. Liu, Y. Hua, Z. Ni, Carbohydr. Polym. 2006, 64, 190.
| Crossref | GoogleScholarGoogle Scholar | 1:CAS:528:DC%2BD28XjvFynur4%3D&md5=2fd281f6c603631d9ecdadee030411ecCAS |
[80] A. Dona, C.-W. W. Yuen, J. Peate, R. G. Gilbert, P. Castignolles, M. Gaborieau, Carbohydr. Res. 2007, 342, 2604.
| Crossref | GoogleScholarGoogle Scholar | 1:CAS:528:DC%2BD2sXht1Oqs7nP&md5=1c9136ddbce333efb48096d8d1f7ca16CAS | 17892866PubMed |
[81] H. Chiou, C. M. Fellows, R. G. Gilbert, M. A. Fitzgerald, Carbohyd. Polym. 2005, 61, 61.
| Crossref | GoogleScholarGoogle Scholar | 1:CAS:528:DC%2BD2MXltFSmu70%3D&md5=11dc5826171d1b7e3635e83b45f8abe6CAS |
[82] J. C. Giddings, Science 1993, 260, 1456.
| Crossref | GoogleScholarGoogle Scholar | 1:CAS:528:DyaK3sXkvVSrsrc%3D&md5=34d2bb257a359aa8dbb54191bd6dd789CAS | 8502990PubMed |
[83] A. Rolland-Sabaté, M. G. Mendez-Montealvo, P. Colonna, V. Planchot, Biomacromolecules 2008, 9, 1719.
| Crossref | GoogleScholarGoogle Scholar | 18547102PubMed |
[84] R. G. Gilbert, A. C. Wu, M. A. Sullivan, G. E. Sumarriva, N. Ersch, J. Hasjim, Anal. Bioanal. Chem. 2013,
| Crossref | GoogleScholarGoogle Scholar | 23842899PubMed |
[85] R. A. Cave, S. A. Seabrook, M. J. Gidley, R. G. Gilbert, Biomacromolecules 2009, 10, 2245.
| Crossref | GoogleScholarGoogle Scholar | 1:CAS:528:DC%2BD1MXovFKlsLw%3D&md5=183d75a04cfa63acc32e80c747c112cdCAS | 19627139PubMed |
[86] J. M. Goldwasser, in ACS Symposium Series – Chromatography of Polymers: Characterization by SEC and FFF (Ed. T. Provder) 1993, Vol. 521, pp. 243–251 (ACS: Washington, DC).
[87] F. Vilaplana, R. G. Gilbert, Macromolecules 2010, 43, 7321.
| Crossref | GoogleScholarGoogle Scholar | 1:CAS:528:DC%2BC3cXpvVGnsrc%3D&md5=79a62825c9066c7b2df82fd422b94fa5CAS |
[88] F. Vilaplana, R. G. Gilbert, J. Chromatogr. A 2011, 1218, 4434.
| Crossref | GoogleScholarGoogle Scholar | 1:CAS:528:DC%2BC3MXotVGmsLs%3D&md5=9b3d5531b8fe3e6a2e3daa49efed7511CAS | 21641606PubMed |
[89] M. A. Sullivan, F. Vilaplana, R. A. Cave, D. I. Stapleton, A. A. Gray-Weale, R. G. Gilbert, Biomacromolecules 2010, 11, 1094.
| Crossref | GoogleScholarGoogle Scholar | 1:CAS:528:DC%2BC3cXisF2jsbs%3D&md5=77852928ccdde3bb3e1eb12fa9c3624dCAS | 20196533PubMed |
[90] P.-G. de Gennes, Scaling Concepts in Polymer Physics 1979 (Cornell University: Ithaca, NY).
[91] P. J. Flory, Principles of Polymer Chemistry 1953 (Cornell University Press: Ithaca, NY).
[92] M. A. Sullivan, J. Li, C. Li, F. Vilaplana, L. Zheng, D. Stapleton, A. A. Gray-Weale, S. Bowen, R. G. Gilbert, Biomacromolecules 2011, 12, 1983.
| Crossref | GoogleScholarGoogle Scholar | 1:CAS:528:DC%2BC3MXmt1Krs7k%3D&md5=dbf67e5ff7b330f0070783d88dbf830cCAS | 21591708PubMed |
[93] E. Li, J. Hasjim, V. Singh, M. Tizzotti, I. D. Godwin, R. G. Gilbert, Cereal Chem. 2013, 90, 223.
| Crossref | GoogleScholarGoogle Scholar | 1:CAS:528:DC%2BC3sXotlymt7g%3D&md5=374e7db7fa8b34dc105c18f2f5866be0CAS |
[94] T. T. B. Tran, K. J. Shelat, D. Tang, E. Li, R. G. Gilbert, J. Hasjim, J. Agric. Food Chem. 2011, 59, 3964.
| Crossref | GoogleScholarGoogle Scholar | 1:CAS:528:DC%2BC3MXjs1Cht7Y%3D&md5=1dbb939052664cd8c59ae474b401e2d7CAS |
[95] W.-C. Liu, P. J. Halley, R. G. Gilbert, Macromolecules 2010, 43, 2855.
| Crossref | GoogleScholarGoogle Scholar | 1:CAS:528:DC%2BC3cXitlartLc%3D&md5=8875bcfb427bfc727e344a5e2a99b7b6CAS |
[96] C. A. Sleicher, AIChE J. 1962, 8, 471.
| Crossref | GoogleScholarGoogle Scholar |
[97] T. Witt, M. J. Gidley, R. G. Gilbert, J. Agric. Food Chem. 2010, 58, 8444.
| Crossref | GoogleScholarGoogle Scholar | 1:CAS:528:DC%2BC3cXnvVeiurw%3D&md5=1ba7ac3d7ce3b9b8da412cb1cb7a355fCAS | 20572670PubMed |
[98] M. Kaur, K. S. Sandhu, N. Singh, S.-T. Lim, Starch – Stärke 2011, 63, 709.
| Crossref | GoogleScholarGoogle Scholar | 1:CAS:528:DC%2BC3MXhtlGkt7rF&md5=f47d425b58302a50a58ca929468bcb9bCAS |
[99] S. Perez, E. Bertoft, Starch – Stärke 2010, 62, 389.
| Crossref | GoogleScholarGoogle Scholar | 1:CAS:528:DC%2BC3cXpslCmsbs%3D&md5=b3a13df0dbfb5c9dc0b8cc0b6401ebb0CAS |
[100] W. R. Morrison, R. V. Law, C. E. Snape, J. Cereal Sci. 1993, 18, 107.
| Crossref | GoogleScholarGoogle Scholar | 1:CAS:528:DyaK2cXisVaqt7o%3D&md5=5bb0b9437e2edf15c3c0c5e4036e78f1CAS |
[101] J.-L. Putaux, Y. Nishiyama, K. Mazeau, M. Morin, M. B. Cardoso, H. Chanzy, Macromol. Symp. 2011, 303, 1.
| Crossref | GoogleScholarGoogle Scholar | 1:CAS:528:DC%2BC3MXns1eltLk%3D&md5=9d642b2108f76ef87e936e6565f550d8CAS |
[102] J. L. Putaux, M. B. Cardoso, D. Dupeyre, M. Morin, A. Nulac, Y. Hu, Macromol. Symp. 2008, 273, 1.
| Crossref | GoogleScholarGoogle Scholar | 1:CAS:528:DC%2BD1MXns1aksQ%3D%3D&md5=2d68f9a46869e445024fc1203f01bcffCAS |
[103] D. Popov, A. Buleon, M. Burghammer, H. Chanzy, N. Montesanti, J.-L. Putaux, G. Potocki-Veronese, C. Riekel, Macromolecules 2009, 42, 1167.
| Crossref | GoogleScholarGoogle Scholar | 1:CAS:528:DC%2BD1MXpt1aqtA%3D%3D&md5=2496962880cd432a5be687f21528e14aCAS |
[104] A. Imberty, H. Chanzy, S. Perez, A. Buleon, V. Tran, J. Mol. Biol. 1988, 201, 365.
| Crossref | GoogleScholarGoogle Scholar | 1:CAS:528:DyaL1cXkslersrY%3D&md5=cd7dab7f1a7dcf60dd046f8281a21744CAS | 3418703PubMed |
[105] Y. Takahashi, T. Kumano, S. Nishikawa, Macromolecules 2004, 37, 6827.
| Crossref | GoogleScholarGoogle Scholar | 1:CAS:528:DC%2BD2cXmt1GmtLc%3D&md5=951a22f0d8b80f01d90d4f78a9a35270CAS |
[106] A. Imberty, S. Perez, Biopolymers 1988, 27, 1205.
| Crossref | GoogleScholarGoogle Scholar | 1:CAS:528:DyaL1cXltlWitr0%3D&md5=6fee0cba12580c7da2416b7fb1e8575cCAS |
[107] A. Buléon, C. Gérard, C. Riekel, R. Vuong, H. Chanzy, Macromolecules 1998, 31, 6605.
| Crossref | GoogleScholarGoogle Scholar |
[108] R. P. Veregin, C. A. Fyfe, R. H. Marchessault, Macromolecules 1987, 20, 3007.
| Crossref | GoogleScholarGoogle Scholar | 1:CAS:528:DyaL2sXmtlyrsbY%3D&md5=988f1a90f9f6590c647dc10cebf5bb79CAS |
[109] R. P. Veregin, C. A. Fyfe, R. H. Marchessault, M. G. Taylor, Macromolecules 1986, 19, 1030.
| Crossref | GoogleScholarGoogle Scholar | 1:CAS:528:DyaL28Xhs1yks78%3D&md5=558cbd19a269a4f21edcc43ad49bfddcCAS |
[110] M. J. Gidley, S. M. Bociek, J. Am. Chem. Soc. 1988, 110, 3820.
| Crossref | GoogleScholarGoogle Scholar | 1:CAS:528:DyaL1cXit1ajsr0%3D&md5=c933eb7315e6d60b1ce305a8ef7a49c7CAS |
[111] H.-J. Chung, S.-T. Lim, Starch – Stärke 2006, 58, 599.
| Crossref | GoogleScholarGoogle Scholar | 1:CAS:528:DC%2BD2sXmtFc%3D&md5=0afc31511d8fdafb7d6cd561fd2fa114CAS |
[112] J. J. G. van Soest, H. Tournois, D. de Wit, J. F. G. Vliegenthart, Carbohydr. Res. 1995, 279, 201.
| Crossref | GoogleScholarGoogle Scholar | 1:CAS:528:DyaK28XhsV2rsg%3D%3D&md5=1835117673801edfa376a7069701b7f3CAS |
[113] I. Capron, P. Robert, P. Colonna, M. Brogly, V. Planchot, Carbohydr. Polym. 2007, 68, 249.
| Crossref | GoogleScholarGoogle Scholar | 1:CAS:528:DC%2BD2sXhvVyhtbY%3D&md5=a7ca9503b922b1d75309586911813a7bCAS |
[114] F. J. Warren, B. B. Perston, P. G. Royall, P. J. Butterworth, P. R. Ellis, Anal. Chem. 2013, 85, 3999.
| Crossref | GoogleScholarGoogle Scholar | 1:CAS:528:DC%2BC3sXjsFalurg%3D&md5=8495ea6d831a5a8f36768e17c837a472CAS | 23461675PubMed |
[115] O. Sevenou, S. E. Hill, I. A. Farhat, J. R. Mitchell, Int. J. Biol. Macromol. 2002, 31, 79.
| Crossref | GoogleScholarGoogle Scholar | 1:CAS:528:DC%2BD3sXmsFaitg%3D%3D&md5=825279223a32e90b5487b1c728423de0CAS | 12559430PubMed |
[116] A. Lopez-Rubio, B. M. Flanagan, E. P. Gilbert, M. J. Gidley, Biopolymers 2008, 89, 761.
| Crossref | GoogleScholarGoogle Scholar | 1:CAS:528:DC%2BD1cXpsVyis70%3D&md5=21c0502a47cc0eec5275d1597610cc96CAS | 18428208PubMed |
[117] C. Mutungi, L. Passauer, C. Onyango, D. Jaros, H. Rohm, Carbohydr. Polym. 2012, 87, 598.
| Crossref | GoogleScholarGoogle Scholar | 1:CAS:528:DC%2BC3MXhtlemsLrI&md5=fc59618fad3570367ac523beb197a124CAS |
[118] J. Doutch, M. Bason, F. Franceschini, K. James, D. Clowes, E. P. Gilbert, Carbohydr. Polym. 2012, 88, 1061.
| Crossref | GoogleScholarGoogle Scholar | 1:CAS:528:DC%2BC38Xis1Cjs7s%3D&md5=95ec644cfc2788673ded0d0214d25fc5CAS |
[119] P. J. Jenkins, A. M. Donald, Polymer 1996, 37, 5559.
| Crossref | GoogleScholarGoogle Scholar | 1:CAS:528:DyaK2sXhtVeiuw%3D%3D&md5=ce5cf6b75fa13a943b5ca2caa188a507CAS |
[120] J. Blazek, E. P. Gilbert, Carbohydr. Polym. 2011, 85, 281.
| Crossref | GoogleScholarGoogle Scholar | 1:CAS:528:DC%2BC3MXkvVKltbs%3D&md5=13837da0fadd19b6074c3de5ca1f08daCAS |
[121] P. J. Jenkins, R. E. Cameron, A. M. Donald, Starch – Stärke 1993, 45, 417.
| Crossref | GoogleScholarGoogle Scholar | 1:CAS:528:DyaK2cXltVWrtg%3D%3D&md5=1cb87d3d4d334af7684aa1142517644dCAS |
[122] S. S. Kozlov, A. Blennow, A. V. Krivandin, V. P. Yuryev, Int. J. Biol. Macromol. 2007, 40, 449.
| Crossref | GoogleScholarGoogle Scholar | 1:CAS:528:DC%2BD2sXit1Grsr8%3D&md5=08e90a249f5d7f7a4f78ae8c599df7f8CAS | 17188347PubMed |
[123] S. S. Kozlov, A. V. Krivandin, O. V. Shatalova, T. Noda, E. Bertoft, J. Fornal, V. P. Yuryev, J. Therm. Anal. Calorim. 2007, 87, 575.
| Crossref | GoogleScholarGoogle Scholar | 1:CAS:528:DC%2BD2sXhslSqu78%3D&md5=40b3c7c6985b8dc81c61837671c1e24eCAS |
[124] S. S. Kozlov, T. Noda, E. Bertoft, V. P. Yuryev, J. Therm. Anal. Calorim. 2006, 86, 291.
| Crossref | GoogleScholarGoogle Scholar | 1:CAS:528:DC%2BD28XhtVygs7fL&md5=fcc26feaeea611e0a734bc1fae5fe79aCAS |
[125] G. T. Oostergetel, E. F. J. van Bruggen, Starch – Stärke 1989, 41, 331.
| Crossref | GoogleScholarGoogle Scholar | 1:CAS:528:DyaL1MXmtlGntL0%3D&md5=b55851e900299023b705200aa63e2fd6CAS |
[126] R. E. Cameron, A. M. Donald, Polymer 1992, 33, 2628.
| Crossref | GoogleScholarGoogle Scholar | 1:CAS:528:DyaK38XksFWiurc%3D&md5=27d49ae62002d480fd2d4fbceaa29ec2CAS |
[127] D. R. Daniels, A. M. Donald, Biopolymers 2003, 69, 165.
| Crossref | GoogleScholarGoogle Scholar | 1:CAS:528:DC%2BD3sXksFSiurY%3D&md5=8414fef889ba99dca7e4f39d4c1d61e6CAS | 12767120PubMed |
[128] J. Blazek, E. Gilbert, Biomacromolecules 2010, 11, 3275.
| 1:CAS:528:DC%2BC3cXhtlGktL7O&md5=12aedf902cee5229ebc8b5a339f8b679CAS | 21033657PubMed |
[129] A. N. Danilenko, Y. V. Shtykova, V. P. Yur’ev, Biophysics (Oxf.) 1994, 39, 7.
[130] V. P. Yuryev, A. V. Krivandin, V. I. Kiseleva, L. A. Wasserman, N. K. Genkina, J. Fornal, W. Blaszczak, A. Schiraldi, Carbohydr. Res. 2004, 339, 2683.
| Crossref | GoogleScholarGoogle Scholar | 1:CAS:528:DC%2BD2cXpt1Wgurk%3D&md5=24d42794bafb9ec40e5540ee86206f78CAS | 15519327PubMed |
[131] H. Jacobs, N. Mischenko, M. H. J. Koch, R. C. Eerlingen, J. A. Delcour, H. Reynaers, Carbohydr. Res. 1998, 306, 1.
| Crossref | GoogleScholarGoogle Scholar | 1:CAS:528:DyaK1cXksFCitrk%3D&md5=635d8e7cf2fcc25648fb10b91206c32aCAS |
[132] T. A. Waigh, K. L. Kato, A. M. Donald, M. J. Gidley, C. J. Clarke, C. Riekel, Starch – Stärke 2000, 52, 450.
| Crossref | GoogleScholarGoogle Scholar | 1:CAS:528:DC%2BD3MXjsVOntw%3D%3D&md5=0beaa6f3f62d93da774ee43e73cc4c8eCAS |
[133] R. Vermeylen, B. Goderis, J. A. Delcour, Carbohydr. Polym. 2006, 64, 364.
| Crossref | GoogleScholarGoogle Scholar | 1:CAS:528:DC%2BD28XjvFymsro%3D&md5=5159f556ee2ead29d408c3b2c12d18b6CAS |
[134] J. Blazek, L. Copeland, J. Cereal Sci. 2010, 51, 265.
| Crossref | GoogleScholarGoogle Scholar | 1:CAS:528:DC%2BC3cXmsVelu7o%3D&md5=878b3b8e61e67e81d1e8fa36508fd83fCAS |
[135] R. Vermeylen, B. Goderis, H. Reynaers, J. A. Delcour, Carbohydr. Polym. 2005, 62, 170.
| Crossref | GoogleScholarGoogle Scholar | 1:CAS:528:DC%2BD2MXhtFKmt7fK&md5=81478382dc827d52d47cb299ff3065dfCAS |