

Focus on Super-Resolution Imaging with Direct Stochastic Optical Reconstruction Microscopy (dSTORM)
Donna R. Whelan A , Thorge Holm B , Markus Sauer B and Toby D. M. Bell A CA School of Chemistry, Monash University, Wellington Road, Clayton, Vic. 3800, Australia.
B Julius-Maximilians University of Würzburg, Am Hubland, 97074 Würzburg, Germany.
C Corresponding author. Email: toby.bell@monash.edu
Australian Journal of Chemistry 67(2) 179-183 https://doi.org/10.1071/CH13499
Submitted: 19 September 2013 Accepted: 20 November 2013 Published: 13 December 2013
Abstract
The last decade has seen the development of several microscopic techniques capable of achieving spatial resolutions that are well below the diffraction limit of light. These techniques, collectively referred to as ‘super-resolution’ microscopy, are now finding wide use, particularly in cell biology, routinely generating fluorescence images with resolutions in the order of tens of nanometres. In this highlight, we focus on direct Stochastic Optical Reconstruction Microscopy or dSTORM, one of the localisation super-resolution fluorescence microscopy techniques that are founded on the detection of fluorescence emissions from single molecules. We detail how, with minimal assemblage, a highly functional and versatile dSTORM set-up can be built from ‘off-the-shelf’ components at quite a modest budget, especially when compared with the current cost of commercial systems. We also present some typical super-resolution images of microtubules and actin filaments within cells and discuss sample preparation and labelling methods.
Introduction
The spatial resolution of images obtained using conventional light microscopy methods is limited by the diffraction of light. This means that a point emitter will be imaged as a ‘disk’ of light giving a point spread function (PSF) or ‘Airy disk’ distribution of light with a full width at half maximum of approximately half the emitted wavelength (~200–300 nm for visible light). Consequently, for two point emitters to be resolved successfully, their PSFs must be separated by at least a certain minimum distance (Dmin).[1,2] For conventional light microscopes, this is a function of the numerical aperture (NA) of the objective and the wavelength of the light (λ) and is conveniently expressed as Rayleigh’s criterion or

where NA = ηsin θ, and η is the refractive index of the medium that the light is passing through and θ is the angle from the normal to the surface of the collection cone of the objective. The unavoidable implication for imaging using fluorescence is that sub-diffraction molecular architecture is unresolvable due to the overlap of the emissions of molecules.
This limitation has been particularly frustrating in cell biology since most of the features and components of the cellular landscape are of a dimension that is well within the diffraction limit of light. Despite this limitation, fluorescence microscopy techniques have remained a favourite with cell biologists due to a plethora of options now available for labelling including immunostaining, click chemistry, and fluorescent protein expression.[3,4] Moreover, techniques such as electron microscopy, X-ray crystallography, and other indirect visualisation methods capable of producing images at superior nanometre resolution are inherently more invasive and less biologically relevant than fluorescence microscopy. Any image obtained using these highly invasive techniques is thus susceptible to questions of sample integrity.
The need for non-invasive, nanometre resolution techniques has long been recognised and the last decade has seen the development and realisation of several ‘super-resolution’ fluorescence microscopy (SRFM) techniques capable of circumventing the diffraction limit of light. Collectively, SRFM was named as Nature Method’s technique of the year in 2008.[5] Of the various approaches to SRFM, the so-called localisation methods based on the detection and ‘localisation’ of single molecules[6–8] show significant promise, particularly in cellular imaging.[9] These techniques also have the benefit of relatively easy implementation and have routinely achieved superior spatial resolutions of ~20 nm in the lateral direction. The possibilities for super-resolution imaging in a myriad of research areas are widely acknowledged; however, uptake and implementation of super-resolution techniques in Australian laboratories has been slow, especially of localisation-based methods. An exception is the laboratory of Prof. Katharina Gaus at the University of New South Wales who has used super-resolution localisation microscopy to investigate the sub-diffraction clustering, signalling, and conformational behaviour of T-cell membrane proteins.[10,11]
Of the localisation approaches, direct stochastic optical reconstruction microscopy (dSTORM)[12,13] stands out as being particularly versatile and relatively straightforward because it requires no specialised equipment beyond a standard wide-field fluorescence microscope and open source software packages for image processing and analysis are available.[14,15] A further major attraction of dSTORM is that it makes use of commercially available fluorophores and typical immunostaining protocols for cellular imaging.[16] We have built a new dSTORM microscope sited in the School of Chemistry at Monash University. The microscope has been constructed entirely from ‘off-the-shelf’ components for considerably less than the current cost of commercial SRFM systems. The set-up has multiple excitation options and two separate detection channels for dual colour imaging. Fluorescence images with spatial resolutions comparable to the very best commercial instruments are routinely acquired. Here, we outline the key advantages of the dSTORM technique, the easy implementation via assemblage of ‘off-the-shelf’ components on a home-built set-up, and detail benchmarking experiments that demonstrate the spatial resolution that can be achieved.
Single Molecule Detection and Localisation
Super-resolution localisation techniques are founded on the detection of single molecule fluorescence emissions without spatially overlapping signals from neighbouring fluorophores. To achieve this, fluorophores are separated in time, instead of in space, so that only a small proportion of the total fluorophore population is emitting photons at any given time. For good super-resolution images, enough fluorophores need to be in a dark, non-emitting state so that in any diffraction-limited area all the detected photons originate from a single emitter. In this way, the distribution of emitted photons from one molecule can be fitted to a PSF and the position of the fluorophore accurately ‘localised’ (Fig. 1). The localisation precision of a single emitter is limited by the number of photons detected since a more intense PSF will allow for a more precise fit. The localisation precision of a given target molecule is further complicated by the distance between the target and the emitting fluorophore label as well as the presence of multiple fluorophores per target (as is often the case in immunostaining). The spatial resolution of a SRFM image is determined by both the localisation precision and the labelling density according to the Nyquist–Shannon sampling theorem which states that the resolution of an image is limited to double the distance between localisations.[17]

|
In principle, any mechanism that gives rise to a small enough subset of molecules emitting, resulting in well separated PSFs being imaged – and thus localised – can be used to generate super-resolution (SR) images. For example, it has previously been shown that transient binding of intercalating molecules with DNA[18,19] as well as with the lipid bilayer[20] can be used to generate SR images.
More commonly, fluorophore photoswitching is achieved by photophysical and/or photochemical means. Various mechanisms have been described to obtain temporal separation of fluorophores which has resulted in many variations of super-resolution localisation microscopy (and a proliferation of acronyms corresponding to them). dSTORM is arguably the most straightforward of these: it can be implemented with a single continuous wave laser for both fluorescent excitation and fluorophore photoswitching, uses commercially available fluorophores and straining protocols, and employs a simple photoswitching buffer. Photoswitching of the fluorophores between a fluorescent on-state and a photoreduced off-state is achieved by balancing photon flux, pH, and oxygen concentration in conjunction with reducing thiols in the imaging buffer.[12,16] These variables can be readily optimised empirically for every sample at the image collection stage and this process is crucial for acquiring good quality super-resolution images.
Microscope Requirements/Our Set-Up
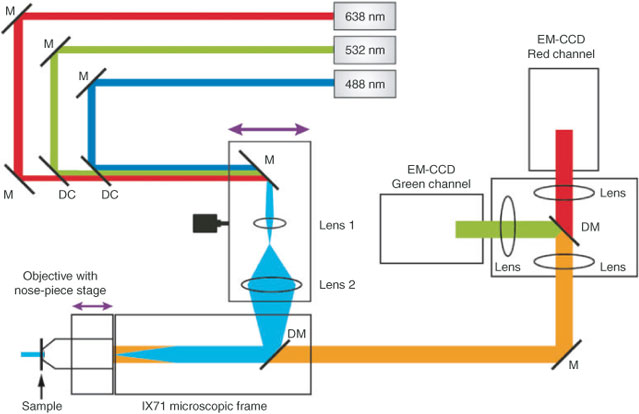
The key components of our home-built SRFM are readily available ‘off-the-shelf’: moderate power continuous wave lasers for excitation, two highly sensitive electron multiplying (EM) charge coupled device (CCD) cameras for imaging, and a microscope frame with high NA objective. Light is focussed onto the back focal plane of the objective using standard opto-mechanical items, mirrors, lenses, and optical filters, and the set-up (Fig. 2) is situated on a vibrationally isolated optical table. It is highly flexible and modular, and easily optimised before or even during measurements. These are key advantages over current commercial systems, along with the cost effectiveness of this approach.[21]
|
The set-up (Fig. 2) is centred around a basic Olympus IX71 microscope frame, although in principle, this is not required and opto-mechanics could be used for mounting dichroics, objectives, and samples. Using a microscope frame is, however, very convenient. Currently, excitation is provided by three moderate power, continuous wave, solid-state diode lasers: 200 mW 488 nm (Toptica), 300 mW 532 (Dragon), and 150 mW 638 nm (Oxxius). Additional lasers can be added easily when required. All lasers have the potential to be combined using appropriate dichroic filters and directed onto a mirror ~30 cm from the rear port of the microscope. One of three interchangeable achromatic focussing lenses (focal length = 75 mm, 25 mm, or 19 mm) is used in conjunction with a second achromatic focussing lens (focal length = 100 mm) to select the appropriate illumination area and power density for a particular experiment. The excitation beam is then focussed onto the back focal aperture of a 1.49 NA 100× TIRF (total internal reflection fluorescence) objective (Köhler illumination) via a dichroic filter to illuminate the sample.
An important modification to the basic wide-field configuration is the mounting of the final excitation steering mirror and the beam expansion lenses onto a translatable stage. By translating the incoming excitation beam to be off-centre (but still parallel) through the objective aperture, a highly inclined or ‘quasi-TIRF’ illumination pattern is achieved. This reduces background fluorescence from out-of-plane fluorophores and increases the illumination power density and consequently the fluorescence signal from in-plane molecules, leading to a significantly increased signal-to-noise ratio. Also of note is the addition of a nose-piece stage (IX2-NPS, Olympus), which is used to minimise sample drift during measurement. This stage decouples the sample from the IX71 x-y stage and aids in both lateral and axial sample drift. Fluorescence photons are collected back through the objective via a dichroic filter. A two-camera adaptor (Andor Tucam) enables effective positioning of a final dichroic filter as well as appropriate clean-up filters in the emission path to allow for simultaneous two-colour detection on two EM-CCD cameras (Andor Ixon Ultra). Typically 5–30000 frames at a frame rate of 50–200 frames per second are required for good super-resolution imaging.
Benchmarking Experiments
To test and benchmark our set-up, several target proteins were stained in a range of cells using various fixation methods. In Fig. 3, dSTORM images of actin and microtubules, two cytoskeleton proteins, are shown. These molecules are ideal for benchmarking experiments because their highly polymeric form allows easy observation of the success of the super-resolution measurement. Two previously successful Alexa Fluor dyes were chosen from the dozens of available dSTORM fluorophores[16] to demonstrate our system’s capabilities. COS-7 and HeLa cells were labelled with Alexa Fluor 488 or 647 conjugated antibodies (microtubules) or Alexa Fluor 647 conjugated phalloidin (actin).

|
Cells were cultured routinely in Dulbecco’s modified Eagle’s medium with 10 % fetal bovine serum and penicillin/streptomycin until passage 8–12 when cells were seeded into an eight-well LabTek II chambered coverglass. Seeded cells were cultured overnight to a final confluence of 40–60 % and then fixed using glutaraldehyde in cytoskeleton buffer with sodium borohydride (0.1 %, 7 min) used to quench the resulting increase in auto-fluorescence as previously reported.[22] Following fixation, the cells were stained using monoclonal anti-β-tubulin mouse primary antibody (2 mg mL–1, Sigma) overnight at 1 : 100, 1 : 300, and 1 : 600 at 4°C. The secondary F(ab’)2 fragment of goat anti-mouse IgG (H+L) Alexa Fluor 647/488 conjugate (2 mg mL–1, Invitrogen) was then added to a coinciding concentration of 1 : 100, 1 : 300, and 1 : 600 and incubated at 20°C for 2 h.
There are three key points regarding labelling that should be noted. First, the labelling density needs to be significantly higher than for conventional microscopy in order to resolve continuous structures because single fluorophores are resolved down to spots tens of nanometres wide whereas they would otherwise appear as a ~300 nm wide Airy disk. Second, the unavoidable localisation of non-specific background fluorophores increases the importance of using high quality, well purified antibodies as well as ensuring rigorous washing during immunostaining. Third, because of the increased spatial resolution of dSTORM imaging, damage to the macrostructure of the target molecules during fixation is rendered far more obvious. While this is of scientific interest in some cases, in many instances it can result in unwanted artefacts in the image. Several simple measures can be taken to minimise such fixation artefacts when using routine immunostaining fixation protocols. When fixing with a cross-linking fixative such as paraformaldehyde or glutaraldehyde, all components, including phosphate buffered saline (PBS) for washing and the fixation solution itself, should be at 37°C throughout. For all fixation protocols, the cells should be immersed in solutions quickly and completely with some agitation, allowing for even washing and the fixation to progress immediately and in a uniform manner across the entire sample. Fig. 4 shows images suffering from there being too many, too few, or non-specific emitting fluorophores in the raw images. Too many (or too few) emitters results from overstaining (or understaining) or oversampling (or undersampling). Sampling issues can be due to inefficient photoswitching of labels into or from their dark states as well as incorrect label densities.

|
For imaging of Alexa Fluor 647, a PBS-based photoswitching buffer was spiked with 5 % glucose, 80 U mL–1 catalase, 5 U mL–1 glucose oxidase, and 65 mM cysteamine hydrochloride (Sigma) and then adjusted to a pH of ~8 using 1 M KOH. This buffer degrades quickly in air and needs to be made immediately before measurement, deposited in the well for imaging and sealed with a second coverslip. For Alexa Fluor 488 the oxygen scavenging components were not added to the buffer. Measurements were completed using the Andor Solis software suite with frame-rate and total number of frames adjusted according to label density and blinking kinetics. As can be seen in Fig. 4, slight variations in the fixation and staining protocol, as well as the measurement parameters, can drastically alter the resulting super-resolution image. This demonstrates clearly the importance of carefully optimising preparation and measurement conditions for different samples.
Finally, image data were extracted from Andor Solis as TIFF stacks and loaded directly into the open access dSTORM software suite rapidSTORM.[15] The full width at half maximum of single fluorophore PSFs were solved for the Alexa Fluor 647 and 488 as 340 and 270 nm, respectively, and used to localise many millions of single molecules for each image. Of note concerning rapidSTORM is that desktop computing power is now sufficient to undertake ‘on-the-fly’ localisation and super-resolution image generation during raw image acquisition which greatly assists optimisation of imaging conditions. Furthermore, rapidSTORM can automatically correct for chromatic aberrations encountered when doing two-colour imaging and also contains an option for manual correction of drift. A convenient way to achieve both of these corrections is by using a reference sample such as semi-conductor nanoparticles or TetraSpecks. For chromatic aberration correction, imaging of such a reference allows generation of an elastic transformation function that can be input into rapidSTORM whereas drift is simply measured over time and a linear correction applied directly to images. No drift corrections needed to be applied to any of the images shown herein, emphasising the stability of the set-up.
Conclusions and Future Outlook
Here, we have shown dSTORM measurements using a relatively simple home-built system based on a conventional wide-field fluorescence microscopy arrangement. All components are available ‘off-the-shelf’ and the total expense, even taking into account the need for state of the art EM-CCD cameras, is only a fraction of the current prices of commercial systems. Sample preparation is relatively straightforward; however, we have identified some key considerations in the labelling and staining requirements for obtaining good quality images. We demonstrate the resolution improvement over conventional imaging for the cellular skeletal features microtubules and actin. It is envisaged that the ability to image the cytoskeleton at significantly higher sub-diffraction resolutions, as well as to extend this ability to other cellular structures, will allow chemical biologists to explore previously unseen effects of disease, drug interactions, and mutations. Indeed, we expect the coming years will see widespread implementation of modular super-resolution set-ups such as ours and their application in imaging sub-diffraction features in all manner of samples.
Acknowledgements
We acknowledge the Deutscher Akademischer Austausch Dienst (DAAD) for a Laboratory exchange grant and Monash University Faculty of Science for a Dean’s strategic funding initiative.
References
[1] E. Abbe, Arch. Mikrosk. Anat. 1873, 9, 413.| Crossref | GoogleScholarGoogle Scholar |
[2] L. Rayleigh, Philos. Mag. 1896, 42, 167.
[3] B. N. G. Giepmans, S. R. Adams, M. H. Ellisman, R. Y. Tsien, Science 2006, 312, 217.
| Crossref | GoogleScholarGoogle Scholar | 1:CAS:528:DC%2BD28XjtlOjs70%3D&md5=39e6edd26f98cc4e9de72cbc4e412e51CAS |
[4] M. Fernandez-Suarez, A. Y. Ting, Nat. Rev. Mol. Cell Biol. 2008, 9, 929.
| Crossref | GoogleScholarGoogle Scholar | 1:CAS:528:DC%2BD1cXhsVWhu7jK&md5=78cad8d5f229898250b111322c7be5efCAS | 19002208PubMed |
[5] see editorial: Nat. Methods 2009, 6, 1.
| Crossref | GoogleScholarGoogle Scholar |
[6] M. J. Rust, M. Bates, X. W. Zhuang, Nat. Methods 2006, 3, 793.
| Crossref | GoogleScholarGoogle Scholar | 1:CAS:528:DC%2BD28XpvVCmtLY%3D&md5=b15671659cdac25a263436c6ab2e2112CAS | 16896339PubMed |
[7] S. T. Hess, T. P. K. Girirajan, M. D. Mason, Biophys. J. 2006, 91, 4258.
| Crossref | GoogleScholarGoogle Scholar | 1:CAS:528:DC%2BD28Xht1Khur%2FN&md5=e597a16059925329fe239529c409a5d6CAS | 16980368PubMed |
[8] E. Betzig, G. H. Patterson, R. Sougrat, O. W. Lindwasser, S. Olenych, J. S. Bonifacino, M. W. Davidson, J. Lippincott-Schwartz, H. F. Hess, Science 2006, 313, 1642.
| Crossref | GoogleScholarGoogle Scholar | 1:CAS:528:DC%2BD28XpsVOktL0%3D&md5=c5d5b3d44ff72d7655d9921b1a889d2eCAS | 16902090PubMed |
[9] M. Sauer, J. Cell Sci. 2013, 126, 3505.
| Crossref | GoogleScholarGoogle Scholar | 1:CAS:528:DC%2BC3sXhsFelu7fN&md5=e54abd210ac061ab3583feac048d6500CAS | 23950110PubMed |
[10] D. J. Williamson, D. M. Owen, J. Rossy, A. Magenau, M. Wehrmann, J. J. Gooding, K. Gaus, Nat. Immunol. 2011, 12, 655.
| Crossref | GoogleScholarGoogle Scholar | 1:CAS:528:DC%2BC3MXntV2ku7k%3D&md5=65c0b1534326d06f37a55717c1442c39CAS | 21642986PubMed |
[11] J. Rossy, D. M. Owen, D. J. Williamson, Z. M. Yang, K. Gaus, Nat. Immunol. 2013, 14, 82.
| Crossref | GoogleScholarGoogle Scholar | 1:CAS:528:DC%2BC38XhslGkur%2FJ&md5=d9c7dd42b30558df473f5981e71d47b9CAS | 23202272PubMed |
[12] M. Heilemann, S. van de Linde, M. Schuttpelz, R. Kasper, B. Seefeldt, A. Mukherjee, P. Tinnefeld, M. Sauer, Angew. Chem. Int. Ed. 2008, 47, 6172.
| Crossref | GoogleScholarGoogle Scholar | 1:CAS:528:DC%2BD1cXpvFSgtro%3D&md5=56d57387c48419e4963798a79e067246CAS |
[13] S. van de Linde, S. Wolter, M. Sauer, Aust. J. Chem. 2011, 64, 503.
| Crossref | GoogleScholarGoogle Scholar | 1:CAS:528:DC%2BC3MXmvFyhs7s%3D&md5=4d70292fbe7c86ba3beb82dc9b0d3428CAS |
[14] S. Wolter, U. Endesfelder, S. van de Linde, M. Heilemann, M. Sauer, Opt. Express 2011, 19, 7020.
| Crossref | GoogleScholarGoogle Scholar | 21503016PubMed |
[15] S. Wolter, A. Loschberger, T. Holm, S. Aufmkolk, M. C. Dabauvalle, S. van de Linde, M. Sauer, Nat. Methods 2012, 9, 1040.
| Crossref | GoogleScholarGoogle Scholar | 1:CAS:528:DC%2BC38Xhs1ajt7rF&md5=14263117110d7acf1fc0e675b449bd2dCAS | 23132113PubMed |
[16] S. van de Linde, A. Loschberger, T. Klein, M. Heidbreder, S. Wolter, M. Heilemann, M. Sauer, Nat. Protoc. 2011, 6, 991.
| Crossref | GoogleScholarGoogle Scholar | 1:CAS:528:DC%2BC3MXotlCnu7Y%3D&md5=8677d15602792cba92046cad729596abCAS | 21720313PubMed |
[17] K. I. Mortensen, L. S. Churchman, J. A. Spudich, H. Flyvbjerg, Nat. Methods 2010, 7, 377.
| Crossref | GoogleScholarGoogle Scholar | 1:CAS:528:DC%2BC3cXkt1aqu7k%3D&md5=5c48cc8ab368a84ed44db76d8232e29bCAS | 20364147PubMed |
[18] C. Flors, C. N. J. Ravarani, D. T. F. Dryden, ChemPhysChem 2009, 10, 2201.
| Crossref | GoogleScholarGoogle Scholar | 1:CAS:528:DC%2BD1MXhtV2itrzE&md5=53a9a4c0d6f6970657796b747f6bbd5aCAS | 19554598PubMed |
[19] I. Schoen, J. Ries, E. Klotzsch, H. Ewers, V. Vogel, Nano Lett. 2011, 11, 4008.
| Crossref | GoogleScholarGoogle Scholar | 1:CAS:528:DC%2BC3MXhtVemu7jL&md5=7e25998680fbf712fb35d54ba0e2f5aaCAS | 21838238PubMed |
[20] A. Sharonov, R. M. Hochstrasser, Proc. Natl. Acad. Sci. USA 2006, 103, 18911.
| Crossref | GoogleScholarGoogle Scholar | 1:CAS:528:DC%2BD28XhtlChu77N&md5=7447c8514c35ffab554d3a2b08d484f8CAS | 17142314PubMed |
[21] T. Holm, T. Klein, A. Löschberger, T. Klamp, G. Wiebusch, S. van de Linde, M. Sauer, ChemPhysChem
| Crossref | GoogleScholarGoogle Scholar |
[22] K. Xu, H. P. Babcock, X. W. Zhuang, Nat. Methods 2012, 9, 185.
| Crossref | GoogleScholarGoogle Scholar | 1:CAS:528:DC%2BC38XlsF2quw%3D%3D&md5=afbe4637db06d5c6d31f8d9556d7f1f0CAS | 22231642PubMed |