

The Molecular Size Distribution of Glycogen and its Relevance to Diabetes
Robert G. Gilbert A B C D and Mitchell A. Sullivan A B C DA Tongji School of Pharmacy, Huazhong University of Science and Technology, Wuhan, Hubei 430030, China.
B The University of Queensland, Centre for Nutrition and Food Sciences, Queensland Alliance for Agriculture and Food Innovation, Brisbane, Qld 4072, Australia.
C These two authors are equal first authors.
D Corresponding authors. Email: b.gilbert@uq.edu.au; m.sullivan7@uq.edu.au

Robert (‘Bob’) Gilbert is Research Professor at the University of Queensland, and also at Huazhong University of Science and Technology at the Biolake hi-tech campus in Wuhan, China, under the Foreign Experts program. He is the author of about 400 papers on chemical dynamics, emulsion polymerisation, and the biosynthesis–structure–property relations of complex branched glucose polymers of importance to human health. |

Mitchell Sullivan was awarded first-class honours at the University of Queensland in 2010. He is currently in his third year of a Ph.D. program investigating the role liver glycogen plays in type 2 diabetes. A significant portion of this research is being targeted at improving the structural characterisation of glycogen. |
Australian Journal of Chemistry 67(4) 538-543 https://doi.org/10.1071/CH13573
Submitted: 22 October 2013 Accepted: 7 January 2014 Published: 6 February 2014
Abstract
Glycogen is a highly branched polymer of glucose, functioning as a blood-glucose buffer. It comprises relatively small β-particles, which may be joined as larger aggregate α-particles. The size distributions from size-exclusion chromatography (SEC, also known as GPC) of liver glycogen from non-diabetic and diabetic mice show that diabetic mice have impaired α-particle formation, shedding new light on diabetes. SEC data also suggest the type of bonding holding β-particles together in α-particles. SEC characterisation of liver glycogen at various time points in a day/night cycle indicates that liver glycogen is initially synthesised as β-particles, and then joined by an unknown process to form α-particles. These α-particles are more resistant to degradation, presumably because of their lower surface area-to-volume ratio. These findings have important implications for new drug targets for diabetes management.
Introduction
Glycogen is a highly branched glucose polymer and is used by a range of organisms to store energy. Glycogen comprises chains of α-(1→4)-linked d-glucose units connected by α-(1→6) branching points, with an average chain length of ~11 glucose units, together with significant but small amounts of various proteins.[1,2] Liver glycogen acts as a blood-glucose buffer, being synthesised shortly after a meal, and degraded to restore blood glucose after fasting,[1] while muscle glycogen functions as a rapid source of energy. In muscle, where glycogen needs to be degraded quickly to glucose to provide energy, the glycogen is present as small β-particles, 20–30 nm in diameter with molecular weights ~106–107. In the liver, these glycogen molecules form much larger aggregate molecules of broccoli-like appearance, termed α-particles (up to 300 nm in diameter with molecular weights reaching above 108).[3,4] A transmission electron microscopy (TEM) image of mouse-liver glycogen is given in Fig. 1.
|
Type 2 diabetes, a disease associated with poorly controlled blood-glucose levels, is one of the Australian Government’s National Health Priority Areas, with the prevalence of this disease in Australia expected to increase from ~7.6 % in 2000 to ~11.4 % in 2025.[5] Developing countries are also undergoing rapid increases in the incidence of type 2 diabetes,[6] with a recent survey showing that the prevalence and rate of increase in China is even greater than those in countries such as Australia and the US.[7] Prevention, mitigation, and treatment are critical problems, which have attracted considerable research resources worldwide; despite this effort, problems associated with type 2 diabetes are increasing because of lifestyle changes. Knowledge of the components that control the initiation and progression of type 2 diabetes is still limited and the elucidation of these factors is an active part of current global research.
This review discusses some technological improvements in the characterisation of glycogen structure, some of the recent advances in our understanding of glycogen structure/metabolism from glycogen structure–property relations, and the implications the findings have for Type 2 diabetes.
Glycogen Size Characterisation
An important facet of structural characterisation of a branched polymer is its size distribution. While size-exclusion chromatography, SEC (also known as GPC), has been used to characterise the structure of polymers since the 1960s, it has only recently been applied to glycogen.[4,8–12]
Before the use of this technique, the macromolecular structure of glycogen was generally characterised using TEM[3,13,14] (where size histograms have often been employed) and by sucrose density centrifugation.[15–17] While useful in gaining insight into the nature of glycogen α- and β-particles, there are several limitations as to what can be concluded using these techniques. It is extremely difficult to employ TEM to obtain even semi-quantitative and reliable size distributions of heterogeneous systems such as glycogen; therefore great caution must be exercised when drawing conclusions from this type of data.[18] Sucrose density centrifugation has been useful for comparing qualitative differences between samples: for example if one sample had a higher proportion of ‘heavier’ particles than another. However, the separation parameter for centrifugation separation is a complex combination of the size, density, and shape of particles, and thus quantitative size distributions are unable to be obtained.[19] However analytical centrifugation can still be a useful tool, although it is of limited use[20] unless in conjunction with other characterisation methods such as SEC.[10]
Another technique used for size characterisation of this macromolecule is asymmetric-flow field-flow fractionation (AsFlFFF or AF4).[21,22] An unanswered question with this technique for glycogen is the quantification of the signal, an issue that has been pointed out with the similar molecule amylopectin.[23] Moreover, this technique has not been tested with glycogen extracted from liver using techniques that have been established to give complete and non-degradative dissolution.[24] This is especially important because glycogen, as noted, contains small but significant amounts of protein (it is strictly a proteoglycan), and all published AF4 studies have been done on purified glycogen from which the protein is probably absent. While methods to answer these questions are emerging,[25,26] AF4 is still in its infancy with regard to application to glycogen and diabetes.
SEC separates molecules solely on a size parameter: their hydrodynamic volumes (Vh) or the corresponding radius Vh = 4/3πRh3. Vh is defined by IUPAC as the ‘volume of a hydrodynamically equivalent sphere’.[27] Using a standard (such as pullulan) with known Mark–Houwink(–Sakaruda) parameters, and thus Rh, in the SEC eluent being employed, and a differential refractive index (DRI) detector, an SEC weight distribution can be constructed (see Eqn 1)[28]:
Here SDRI is the DRI signal and  el(Vh) is the universal calibration curve, allowing the conversion of elution volume into Vh. The distribution w(log Rh) is the (relative) weight of molecules in the size increment d(log Rh).
While it has been shown that the universal calibration assumption is valid for a wide variety of molecular architectures,[29–31] it should be noted that this may not be completely reliable for glycogen; however, all significant conclusions reviewed here are independent of any inaccuracy in the size axis that might arise from any breakdown in the universal calibration assumption. Furthermore, because a complex branched polymer such as glycogen can have molecules of the same molecular size with different branching structures and thus potentially different molecular weights, a molecular weight distribution cannot in principle, not just in practice, be obtained for such molecules, whatever the detector. A detector such as MALLS (multiple-angle laser light scattering) gives a molecular weight average (the weight average  for MALLS), and thus the distribution
  (Rh), and this enables the data to be presented in the form of w(
 ); however, this is not a molecular weight distribution, because the abscissa is an average, not an actual, molecular weight.
SEC suffers from two potential problems for glycogen. The first is band broadening, whereby diffusion along the column reduces the accuracy of separation. We later discuss a way of reducing this problem. The second is shear scission; however, for highly branched molecules of the size of glycogen, this effect can be minimised with an appropriate flow rate.[32]
Technical Improvements in SEC Characterisation of Glycogen
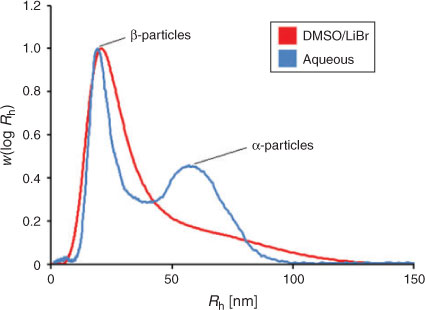
While past studies that have obtained size distributions of native glycogen using SEC have employed a dimethyl sulfoxide/lithium bromide (DMSO/LiBr) eluent, it has recently been shown[33] that aqueous SEC results in significantly improved resolution, with the α- and β-particle peaks being better separated than in DMSO. There have however been several encouraging studies using aqueous SEC to characterise synthetic and commercial glycogen.[9,11,34,35] There are several other advantages to using an aqueous system: water is cheaper, safer, easier to dispose of and more physiologically relevant than DMSO. The universal calibration assumption was used here. Because the focus of the study was on improving the resolution/separation of glycogen α- and β-particles, any improved accuracy of x-axis values is unimportant. The increased resolution obtained using aqueous SEC can be seen in Fig. 2.
|
It should be noted that this α-particle peak is not a result of aggregation, as a variety of concentrations (ranging from 5 to 0.5 mg mL–1) have been tested with no obvious change in the distribution.[26] SEC recovery in this type of system is quite high with DMSO as eluent,[36] and is expected to be higher with a water-based eluent because of the lower viscosity.
The improved resolution obtained using aqueous SEC is consistent with a study[37] finding that synthetic branched polysaccharides had better separation using an aqueous system than DMSO/LiBr.
It was shown in this study that the main reason for the differences between the SEC distributions acquired from aqueous and DMSO setups was the superior separation of the aqueous systems for larger molecules (in the α-particle region). It was clear that the largest pullulan standard (2.35 × 10⁶ Da) was approaching the exclusion limits of the DMSO column setups, but not for the aqueous setups. It is important to note that pullulan swells to a larger hydrodynamic size in DMSO/LiBr compared with the aqueous (50 mM NH4NO3/0.02 % NaN3) solvent, with the largest pullulan standard being ~58 nm compared with ~44 nm, respectively. If glycogen also swells more in DMSO/LiBr, a larger proportion of the distribution will be excluded in these setups, given the same pore sizes in the columns.
While size distributions of liver glycogen using DMSO SEC are qualitatively useful, with the inability to separate α- and β-particle peaks, the parameterisation and thus quantitative comparison of these distributions is limited. Two obvious parameters that can be used are the Rh at which the peak maximum occurs, as well as the average Rh ( ) given by Eqn 2[38]:
While useful, these parameters do not necessarily give a good indication of the relative amount of α-particles in a particular sample. The ideal would be if a theory were to be available giving the size distribution in terms of the rate parameters of the underlying biosynthetic processes, as has been developed for the distribution of chain lengths of amylopectin.[39,40] That is work for the future, which will be spurred by the availability of more accurate data using the technique reviewed here.
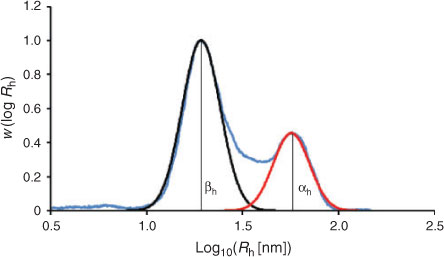
With the increased resolution obtained using aqueous SEC, leading to a separation of these α- and β-particle peaks, the determination of at least six simple empirical parameters is now possible.[26] The first two parameters are the Rh values at the β-particle and α-particle peak maxima, βRh and αRh, respectively. As with DMSO/LiBr SEC,  can also be determined (Eqn 2). A parameter that gives a good indication of the proportion of α-particles is the ratio of the α-particle peak height to that of the β-particle peak (αh/βh), as seen in Fig. 3. Another parameter, αarea, is determined by fitting the α-particle peak with a Gaussian distribution, and then determining the area under the curve (AUC) of this peak in relation to the AUC of the whole distribution, plotted with a conventional log axis (see Fig. 3, with the estimated α-particle distribution in red). Similarly, βarea can be calculated by fitting a Gaussian curve to the β-particle peak (black curve in Fig. 3) and dividing the area under the curve (AUC) by the distribution’s total AUC. Interestingly there is very little overlap between the two Gaussian curves, leaving an intermediate region in the SEC distribution that is not accounted for by the fittings.
|
α-Particle Formation
The mechanism that causes liver glycogen to form these large α-particles is still unclear, with a variety of interesting possibilities being suggested. It now seems most likely that the linkage between smaller β-particles to form α-particles is covalent in nature.[15,41] A possibility that was initially promising was that disulfide bonding was responsible, after it was found that the precursor for glycogen synthesis was a gluco-protein (glycogenin),[42] and it was shown that large α-particles were rapidly broken down in the presence of 2-mercaptoethanol, which disrupts disulfide bonds.[16,43] Another study however did not see a decrease in the size of α-particles when treated with this reagent,[13] and it was suggested that the linkage between β-particles are simply α-(1→4) linkages, the predominant glycosidic linkage found in glycogen. It was subsequently suggested[44] that the past studies reporting glycogen break-down with the addition of 2-mercaptoethanol were actually observing this degradation as a result of acidic environments created by the by-product hydroiodic acid (resulting from the iodoacetamide present in the reaction). We have demonstrated[41] that the past studies did indeed create acidic environments (pH ~1) that degrade α-particles, and that the link holding α-particles together is more susceptible to acid hydrolysis than α-(1→4) linkages. This led us to hypothesise that there is a protein ‘glue’ holding the particles together by a linkage other than disulfide bonding. While the use of protease did not degrade the α-particles in this study, this may be because of steric hindrance preventing the protease from accessing this hypothesised protein ‘glue’.
Implications for Human Health
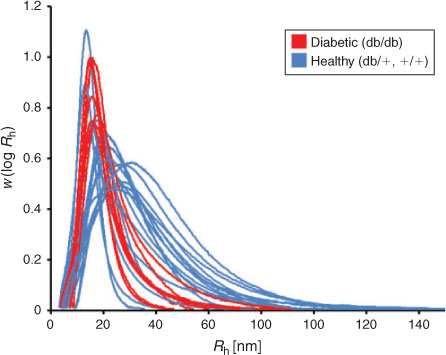
SEC has been used to compare the glycogen from non-diabetic and diabetic mice.[45] The diabetic, ‘db/db’, mouse was used as the type 2 diabetic model, which has a point mutation in the leptin receptor gene.[46] These mice become obese and suffer from hyperglycaemia, transient hyperinsulinemia, and hyperglucagonemia.[47,48] As can be seen in Fig. 4 (the same data as in a previous study[45] but presented on a linear scale to highlight the differences in the α-particle region), db/db mice have narrow glycogen distributions consisting almost entirely of β-particles and some small α-particles. The distributions in healthy mice however are highly varied, with some mice containing mainly β-particles, while others contain populations of large α-particles. For healthy mice, the presence of size distributions with a wide average size is readily ascribed to the fact that these mice were sacrificed at random times after feeding. As seen below, this means a wide variation in average size. As shown below, had the healthy mice all been sacrificed at an appropriate time after the last meal, the size distribution would be dominated by large α-particles. These data are consistent with a previous observation using sucrose density centrifugation that db/db mice contain fewer ‘heavy’ particles than non-diabetic mice.[17] It has been suggested that a population of many smaller β-particles will be more susceptible to enzymatic degradation than a population consisting of larger α-particles because of the increased exposed chains, with a higher ratio of surface area to volume.[45,49]
|
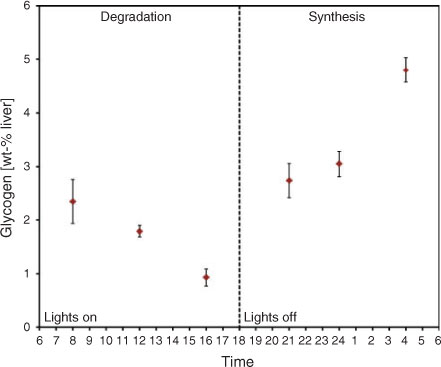
This striking difference between non-diabetic and diabetic glycogen has highlighted the importance of understanding glycogen metabolism in terms of structure. A recent study[50] has used SEC to analyse the structure of mouse-liver glycogen at various time points in the feeding cycle, exploiting the natural diurnal rhythm of liver glycogen metabolism in mice.[47,51–54] As has been previously reported,[47,55] liver glycogen was synthesised in the dark hours and subsequently degraded in the hours of light (see Fig. 5).
|
The structural characterisation of glycogen at these various time points revealed several interesting insights. First, when glycogen was at its peak concentration, it consisted almost entirely of smaller β-particles, suggesting glycogen is initially created as separate β-particles which can later combine to form α-particles. This was unexpected, it being anticipated that most α-particles would be present when the amount of glycogen was greatest. However, this unexpected result yielded important new insights. In evolutionary terms this prevalence of small β-particles when glycogen is very high is a strategy optimal for the animal’s need to quickly synthesise glycogen after digestion of food. Assuming that the enzymatic kinetics of both synthesis and degradation of β-particles are surface-area controlled (the enzymes are different, but both are much larger than the accessible spaces within a glycogen particle), rapid synthesis would be assisted by the greater surface-to-volume ratio of the smaller molecules. An in vitro study[56] with rabbit-liver glycogen supports this hypothesis, with glycogen phosphorylase having a higher activity for smaller molecules in the direction of glycogen synthesis. In 1971 Geddes[16] also found that glucose tended to be incorporated more into lower-weight material, which is consistent with smaller molecules being synthesised more rapidly.
The second major insight resulting from the structural study of glycogen across a diurnal cycle is that towards the end of glycogen degradation, there is a much greater proportion of large α-particles remaining. This is consistent with the hypothesis that α-particles degrade more slowly because of their decreased surface area-to-volume ratio; preliminary in vitro kinetics data[50] and a past kinetics study[15] support this hypothesis. Indeed we have suggested[45] that this is why α-particles are present: to give a slower, more controlled release of glucose back into the blood. It has also been found[57] that glycogen phosphorylase is more associated with lower molecular weight glycogen, again being consistent with the idea of larger molecules being more resistant to degradation because of the surface-to-volume ratio.
The final insight into glycogen metabolism gained from this study is that after 16 h of starvation, the liver glycogen of mice consisted of narrowly distributed, very small β-particles, with an Rh of ~12 nm. These started to form while there were still some large α-particles remaining, indicating that their persistence is attributable to the particles being resistant to degradation, as opposed to the degradative enzymes just being switched off. Past studies have noted that glycogen can persist long after starvation, when no high molecular weight material remained,[58,59] and it has been suggested that perhaps these molecules have a high molecular density, impeding enzymatic access.[16] The synthetic pathway to create these small resistant molecules may have evolved as a more efficient mechanism for glycogen metabolism, with particles not having to be created completely ab initio, which involves the synthesis of the glycogen-initiating protein, glycogenin.
Conclusion
SEC has been shown to be an effective method for characterising the size distributions of glycogen. After finding that diabetic mice have an impaired ability to form as many large glycogen α-particles as healthy mice, it has become important to understand the metabolism of glycogen from a structural perspective. Significant new understanding has been obtained by analysing the size distributions of glycogen at various time points in the day/night cycle of mice. First, glycogen is produced as smaller β-particles that are subsequently connected by an unknown process to form the much larger α-particles. These α-particles are more resistant to enzymatic degradation, supporting the hypothesis that glycogen degradation is at least partially controlled by the surface area-to-volume ratio of the particles. Finally it was shown that after starvation, there are still some small β-particles (~12 nm in size) remaining. The mechanism by which these molecules resist degradation is still unknown, but it is suggested that degradative enzymes may be sterically impeded by densely packed branches.
Using SEC it has also been shown that α-particles are more susceptible to acid hydrolysis than the α-(1→4) and α-(1→6) glycosidic linkages present in glycogen, providing evidence for a ‘glue’, probably proteinaceous, that binds β-particles together to form α-particles.
It has been recently shown that an aqueous SEC system is capable of achieving significantly better resolution than that of a DMSO setup, with α- and β-particle peaks being separated. SEC weight distributions can now be reduced to at least six simple, meaningful parameters, allowing for quantitative and statistical comparison between distributions.
If glycogen structure is indeed critical for effective glucose buffering, which is lacking in diabetes, several new drug targets that improve the formation of glycogen particles may have pharmaceutical potential in diabetes treatment. By either up-regulating key enzymes responsible for the proposed ‘glue’ that holds these large particles together or down-regulating any inhibitory enzymes/regulators, it may be possible to increase the average size of glycogen particles, potentially resulting in a slower, more controlled release of glucose back into the blood.
References
[1] F. Meyer, L. Heilmeyer, R. H. Haschke, E. H. Fischer, J. Biol. Chem. 1970, 245, 6642.| 1:CAS:528:DyaE3MXjvVGgtA%3D%3D&md5=1bcd9f14b8e2cf869f86d911371d9380CAS | 4320610PubMed |
[2] K. K. Rybicka, Tissue Cell 1996, 28, 253.
| Crossref | GoogleScholarGoogle Scholar | 1:CAS:528:DyaK28XksF2itLg%3D&md5=7e5accab85e4bcde60a11e557a493678CAS | 8701432PubMed |
[3] P. Drochmans, J. Ultrastruct. Res. 1962, 6, 141.
| Crossref | GoogleScholarGoogle Scholar | 1:STN:280:DyaF38%2FivFaitg%3D%3D&md5=65c9724e281540a6f79d9e2e5e910385CAS | 13887898PubMed |
[4] M. A. Sullivan, F. Vilaplana, R. A. Cave, D. I. Stapleton, A. A. Gray-Weale, R. G. Gilbert, Biomacromolecules 2010, 11, 1094.
| Crossref | GoogleScholarGoogle Scholar | 1:CAS:528:DC%2BC3cXisF2jsbs%3D&md5=5c6d9e9af22d0cf32b1de3f9c6438638CAS | 20196533PubMed |
[5] D. J. Magliano, E. L. M. Barr, P. Z. Zimmet, A. J. Cameron, D. W. Dunstan, S. Colagiuri, D. Jolley, N. Owen, P. Phillis, R. J. Tapp, T. A. Welborn, J. E. Shaw, Diabetes Care 2008, 31, 267.
| Crossref | GoogleScholarGoogle Scholar | 17989310PubMed |
[6] D. Yach, D. Stuckler, K. D. Brownell, Nat. Med. 2006, 12, 62.
| Crossref | GoogleScholarGoogle Scholar | 1:CAS:528:DC%2BD28Xht1KgtA%3D%3D&md5=02957795383a7ae4fdfeef1b4401bf5dCAS | 16397571PubMed |
[7] Y. Xu, L. Wang, J. He, Y. Bi, M. Li, T. Wang, L. Wang, Y. Jiang, M. Dai, J. Lu, M. Xu, Y. Li, N. Hu, J. Li, S. Mi, C.-S. Chen, G. Li, Y. Mu, J. Zhao, L. Ko, J. Chen, S. La, W. Wan, W. Zhao, G. Ning, JAMA 2013, 310, 948.
| Crossref | GoogleScholarGoogle Scholar | 1:CAS:528:DC%2BC3sXhsFCjsb7F&md5=0b3fb0eae5dda8f808a870384ad7bf31CAS | 24002281PubMed |
[8] A. Rolland-Sabaté, M. G. Mendez-Montealvo, P. Colonna, V. Planchot, Biomacromolecules 2008, 9, 1719.
| Crossref | GoogleScholarGoogle Scholar | 18547102PubMed |
[9] C. E. Ioan, T. Aberle, W. Burchard, Macromolecules 1999, 32, 7444.
| Crossref | GoogleScholarGoogle Scholar | 1:CAS:528:DyaK1MXmt12lu7w%3D&md5=3fa9bdfa6654b3f1d801abf2c5b6a109CAS |
[10] G. A. Morris, S. Ang, S. E. Hill, S. Lewis, B. Schaefer, U. Nobbmann, S. E. Harding, Carbohydr. Polym. 2008, 71, 101.
| Crossref | GoogleScholarGoogle Scholar | 1:CAS:528:DC%2BD2sXht1Oqs7zK&md5=a3df2f6d7cc8c227ca34bda2c6ee03abCAS |
[11] R. Kakutani, Y. Adachi, H. Kajiura, H. Takata, T. Kuriki, N. Ohno, Carbohydr. Res. 2007, 342, 2371.
| Crossref | GoogleScholarGoogle Scholar | 1:CAS:528:DC%2BD2sXhtVOlsbzJ&md5=19f23c6beb5e25f3c814ffb8e15114daCAS | 17761154PubMed |
[12] J. Ciric, K. Loos, Carbohydr. Polym. 2013, 93, 31.
| Crossref | GoogleScholarGoogle Scholar | 1:CAS:528:DC%2BC38XntVWis7w%3D&md5=091924e67a5598ea703de0491146f2a1CAS | 23465898PubMed |
[13] K. Matsuda, K. Hata, Denpun Kagaku 1985, 32, 118.
| 1:CAS:528:DyaL28XjtVKgtg%3D%3D&md5=9b51ee6a39e011fd0796172369735177CAS |
[14] P. Devos, P. Baudhuin, F. v. Hoof, H.-G. Hers, Biochem. J. 1983, 209, 159.
| 1:CAS:528:DyaL3sXht1Wlt78%3D&md5=ce95993665389294db86dc3d3e8e6b7cCAS | 6847609PubMed |
[15] S. A. Orrell, E. Bueding, J. Biol. Chem. 1964, 239, 4021.
| 1:CAS:528:DyaF2cXkvFelsLk%3D&md5=25daa7b5e2ddf2d847ab71da82b1e75fCAS | 14247641PubMed |
[16] R. Geddes, G. C. Stratton, Carbohydr. Res. 1977, 57, 291.
| Crossref | GoogleScholarGoogle Scholar | 1:CAS:528:DyaE2sXltlWhsLg%3D&md5=5f76492399edf114b71e8d87e5c65f5cCAS | 902278PubMed |
[17] W. J. Roesler, R. L. Khandelwal, Diabetes 1986, 35, 210.
| Crossref | GoogleScholarGoogle Scholar | 1:CAS:528:DyaL28Xht1Omu7w%3D&md5=05b6ca4a58fb47d68e7fd8db9357cb97CAS | 3080350PubMed |
[18] G. Lichti, B. S. Hawkett, R. G. Gilbert, D. H. Napper, D. F. Sangster, J. Polym. Sci., Part A: Polym. Chem. 1981, 19, 925.
| 1:CAS:528:DyaL3MXhvFaktL0%3D&md5=777c4aa5e3eed2661f6305cf78291b82CAS |
[19] T. E. Graham, Z. Yuan, A. K. Hill, R. J. Wilson, Acta Physiol. 2010, 199, 489.
| Crossref | GoogleScholarGoogle Scholar | 1:CAS:528:DC%2BC3cXpvVOrs78%3D&md5=a20612436eb6fa3876e79e18710e178fCAS |
[20] M. J. Gidley, I. Hanashiro, N. M. Hani, S. E. Hill, A. Huber, J.-L. Jane, Q. Liu, G. A. Morris, A. Rolland-Sabaté, A. Striegel, R. G. Gilbert, Carbohydr. Polym. 2010, 79, 255.
| Crossref | GoogleScholarGoogle Scholar | 1:CAS:528:DC%2BD1MXhtlGjtLzF&md5=3800395c126f4ccaea2f7a78d43c3088CAS |
[21] A. Rolland-Sabate, P. Colonna, M. G. Mendez-Montealvo, V. Planchot, Biomacromolecules 2007, 8, 2520.
| Crossref | GoogleScholarGoogle Scholar | 1:CAS:528:DC%2BD2sXotVKhtrk%3D&md5=2edb1929eb975e770fe004371fe4f581CAS | 17645307PubMed |
[22] C. C. Fernandez, C. Rojas, L. Nilsson, Int. J. Biol. Macromol. 2011, 49, 458.
| Crossref | GoogleScholarGoogle Scholar | 1:CAS:528:DC%2BC3MXhtFehsr%2FP&md5=d31430bf25a7690d75b51487b4df07a7CAS |
[23] R. G. Gilbert, Anal. Bioanal. Chem. 2011, 399, 1425.
| Crossref | GoogleScholarGoogle Scholar | 1:CAS:528:DC%2BC3cXhsVymsbbN&md5=c8f9eab5e5da5fcead13c3c8398274ebCAS | 21107973PubMed |
[24] J.-H. Ryu, J. Drain, J. H. Kim, S. McGee, A. Gray-Weale, L. Waddington, G. J. Parker, M. Hargreaves, S.-H. Yoo, D. Stapleton, Int. J. Biol. Macromol. 2009, 45, 478.
| Crossref | GoogleScholarGoogle Scholar | 1:CAS:528:DC%2BD1MXhtlWhsLfN&md5=b1befff110cd9dec2e0a01aa1d6b8984CAS | 19720076PubMed |
[25] R. G. Gilbert, A. C. Wu, M. A. Sullivan, G. E. Sumarriva, N. Ersch, J. Hasjim, Anal. Bioanal. Chem. 2013, 405, 8969.
| Crossref | GoogleScholarGoogle Scholar | 1:CAS:528:DC%2BC3sXhtVyqtL3M&md5=540db1ccc1144f4270bf54d44189f845CAS | 23842899PubMed |
[26] M. A. Sullivan, P. O. Powell, T. Witt, F. Vilaplana, E. Roura, R. G. Gilbert, J. Chromatogr. A 2014, in press.
| Crossref | GoogleScholarGoogle Scholar |
[27] R. G. Jones, J. Kahovec, R. Stepto, E. S. Wilks, M. Hess, T. Kitayama, W. V. Metanomski, Compendium of Polymer Terminology and Nomenclature. IUPAC Recommendations 2008 2009 (Royal Society of Chemistry: Cambridge).
[28] F. Vilaplana, R. G. Gilbert, J. Sep. Sci. 2010, 33, 3537.
| Crossref | GoogleScholarGoogle Scholar | 1:CAS:528:DC%2BC3cXhsVCjs7vE&md5=199f2357191901a2cdc8179403d80f73CAS | 20960448PubMed |
[29] A. E. Hamielec, A. C. Ouano, J. Liq. Chromatogr. 1978, 1, 111.
| Crossref | GoogleScholarGoogle Scholar | 1:CAS:528:DyaE1cXhtlOisr0%3D&md5=9d48488f539500dc69a0b6bf31084996CAS |
[30] A. E. Hamielec, A. C. Ouano, L. L. Nebenzahl, J. Liq. Chromatogr. 1978, 1, 527.
| Crossref | GoogleScholarGoogle Scholar | 1:CAS:528:DyaE1cXkvFSnsLc%3D&md5=10a3ee74649c7438163d0a6fa4572874CAS |
[31] T. Kuge, K. Kobayashi, H. Tanahashi, T. Igushi, S. Kitamura, Agric. Biol. Chem. 1984, 48, 2375.
| Crossref | GoogleScholarGoogle Scholar | 1:CAS:528:DyaL2cXlvVOhsb4%3D&md5=9b38b864307f1bf9ecfa45453f124470CAS |
[32] R. A. Cave, S. A. Seabrook, M. J. Gidley, R. G. Gilbert, Biomacromolecules 2009, 10, 2245.
| Crossref | GoogleScholarGoogle Scholar | 1:CAS:528:DC%2BD1MXovFKlsLw%3D&md5=afced874890bcca54b889e15143d8c54CAS | 19627139PubMed |
[33] K. Xu, K. T. Morgan, A. T. Gehris, T. C. Elston, S. M. Gomez, PLOS Comput. Biol. 2011, 7, e1002272.
| Crossref | GoogleScholarGoogle Scholar | 1:CAS:528:DC%2BC3MXhs1GgurzM&md5=fc55d2b9fc782d06156238875d438e34CAS | 22163177PubMed |
[34] H. Takata, H. Kajiura, T. Furuyashiki, R. Kakutani, T. Kuriki, Carbohydr. Res. 2009, 344, 654.
| Crossref | GoogleScholarGoogle Scholar | 1:CAS:528:DC%2BD1MXjs1als7w%3D&md5=37285e58273c0c41deb80294dacb8e4dCAS | 19217615PubMed |
[35] F. Grimaud, C. Lancelon-Pin, A. Rolland-Sabate, X. Roussel, S. Laguerre, A. Vikso-Nielsen, J. L. Putaux, S. Guilois, A. Buleon, C. D’Hulst, G. Potocki-Veronese, Biomacromolecules 2013, 14, 438.
| Crossref | GoogleScholarGoogle Scholar | 1:CAS:528:DC%2BC3sXmvVGmug%3D%3D&md5=324f87747a428e73b69313e53dec0285CAS | 23311582PubMed |
[36] M. J. Tizzotti, M. C. Sweedman, D. Tang, C. Schaeffer, R. G. Gilbert, J. Agric. Food Chem. 2011, 59, 6913.
| Crossref | GoogleScholarGoogle Scholar | 1:CAS:528:DC%2BC3MXmvF2ls7g%3D&md5=69758145cd231a128164fb2c105a98feCAS | 21608525PubMed |
[37] J. Ciric, J. Oostland, J. W. de Vries, A. J. J. Woortman, K. Loos, Anal. Chem. 2012, 84, 10463.
| Crossref | GoogleScholarGoogle Scholar | 1:CAS:528:DC%2BC38Xhs1WlsLrJ&md5=e5704360a2d8eb55f13cff18cdb0a416CAS | 23121513PubMed |
[38] F. Vilaplana, R. G. Gilbert, J. Chromatogr. A 2011, 1218, 4434.
| Crossref | GoogleScholarGoogle Scholar | 1:CAS:528:DC%2BC3MXotVGmsLs%3D&md5=1dd77ee72472e484751210f297462de6CAS | 21641606PubMed |
[39] A. C. Wu, R. G. Gilbert, Biomacromolecules 2010, 11, 3539.
| Crossref | GoogleScholarGoogle Scholar | 1:CAS:528:DC%2BC3cXhtlyks77E&md5=c482ee2850aadc201b2c4082b909f7fcCAS | 21058715PubMed |
[40] A. C. Wu, M. K. Morell, R. G. Gilbert, PLoS ONE 2013, 8, e65768.
| Crossref | GoogleScholarGoogle Scholar | 1:CAS:528:DC%2BC3sXhtVSku7%2FP&md5=8069381941ae7db9ae95433213d14861CAS | 23762422PubMed |
[41] M. A. Sullivan, M. J. O’Connor, F. Umana, E. Roura, K. Jack, D. I. Stapleton, R. G. Gilbert, Biomacromolecules 2012, 13, 3805.
| Crossref | GoogleScholarGoogle Scholar | 1:CAS:528:DC%2BC38Xhtl2nsLrF&md5=d0bdc4019bc58282011b7a35e8955affCAS | 23004915PubMed |
[42] C. R. Krisman, R. Barengo, Eur. J. Biochem. 1975, 52, 117.
| Crossref | GoogleScholarGoogle Scholar | 1:CAS:528:DyaE2MXhsFSltLY%3D&md5=05763dfdf991c356a31c9592036c11aeCAS | 809265PubMed |
[43] N. P. Chee, R. Geddes, FEBS Lett. 1977, 73, 164.
| Crossref | GoogleScholarGoogle Scholar | 1:CAS:528:DyaE2sXhtFKgtbk%3D&md5=98a7fb56d77f5822a7bd4f81f8cb7c9dCAS | 838057PubMed |
[44] D. J. Manners, Carbohydr. Polym. 1991, 16, 37.
| Crossref | GoogleScholarGoogle Scholar | 1:CAS:528:DyaK3MXksVCgs7s%3D&md5=74fc0bb9df9e9899fe10d95481640f5cCAS |
[45] M. A. Sullivan, J. Li, C. Li, F. Vilaplana, L. Zheng, D. Stapleton, A. A. Gray-Weale, S. Bowen, R. G. Gilbert, Biomacromolecules 2011, 12, 1983.
| Crossref | GoogleScholarGoogle Scholar | 1:CAS:528:DC%2BC3MXmt1Krs7k%3D&md5=4ceb39bc58b633f2cbad026efdfd58a8CAS | 21591708PubMed |
[46] H. Chen, O. Charlat, L. A. Tartaglia, E. A. Woolf, X. Weng, S. J. Ellis, N. D. Lakey, J. Culpepper, K. J. Moore, R. E. Breitbart, G. M. Duyk, R. I. Tepper, J. P. Morgenstern, Cell 1996, 84, 491.
| Crossref | GoogleScholarGoogle Scholar | 1:CAS:528:DyaK28XhtFWqt7s%3D&md5=67ed6c67e4284ba55a8e51035f74c300CAS | 8608603PubMed |
[47] W. J. Roesler, R. L. Khandelwal, Diabetes 1985, 34, 395.
| Crossref | GoogleScholarGoogle Scholar | 1:CAS:528:DyaL2MXhvVegtb0%3D&md5=aa698ad20d4b869f7be6c3e25a5f36e2CAS | 2982686PubMed |
[48] K. Sharma, P. McCue, S. R. Dunn, Am. J. Physiol. Renal Physiol. 2003, 284, F1138.
| 1:CAS:528:DC%2BD3sXltVehurg%3D&md5=69550d4a532ac76c77944baa15e3ad26CAS | 12736165PubMed |
[49] Q. A. Besford, M. A. Sullivan, L. Zheng, R. G. Gilbert, D. Stapleton, A. Gray-Weale, Int. J. Biol. Macromol. 2012, 51, 887.
| Crossref | GoogleScholarGoogle Scholar | 1:CAS:528:DC%2BC38XhsFCltL3L&md5=02c8b22d5b043f550c6b8c3247fa5859CAS | 22782068PubMed |
[50] M. A. Sullivan, S. T. N. Aroney, S. Li, F. J. Warren, K. S. M. Lauren Joo, D. I. Stapleton, K. S. Bell-Anderson, R. G. Gilbert, Biomacromolecules 2014, in press.
| Crossref | GoogleScholarGoogle Scholar | 24372590PubMed |
[51] G. M. Higgins, J. Berkson, E. Flock, Am. J. Physiol. 1932, 102, 673.
| 1:CAS:528:DyaA3sXnsVGn&md5=426bec754026639f25c57164d704b562CAS |
[52] F. Halberg, P. G. Albrecht, C. P. Barnum, Am. J. Physiol. 1960, 199, 400.
| 1:CAS:528:DyaF3MXpt12n&md5=934b0009ee0fa8b92154d5564b0a6fccCAS | 13710666PubMed |
[53] K. Ishikawa, T. Shimazu, Life Sci. 1976, 19, 1873.
| Crossref | GoogleScholarGoogle Scholar | 1:CAS:528:DyaE2sXltlejuw%3D%3D&md5=0616a472a16fcedeb987d1308713a6f2CAS | 826747PubMed |
[54] K. M. H. Philippens, H. Vonmayersbach, L. E. Scheving, J. Nutr. 1977, 107, 176.
| 1:CAS:528:DyaE2sXhtF2ktrs%3D&md5=d7e1e188d73a7044d5ad63430c145e96CAS |
[55] C. B. Chen, P. F. Williams, G. J. Cooney, I. D. Caterson, Int. J. Obes. 1992, 16, 913.
| 1:CAS:528:DyaK3sXhs1KltLw%3D&md5=1aca071185400d632b727e7f4550dc65CAS |
[56] M. R. Stetten, D. Stetten, J. Biol. Chem. 1958, 232, 489.
| 1:CAS:528:DyaG1cXptlaiuw%3D%3D&md5=ed473d1425133853d104a8af2b337ab0CAS | 13549436PubMed |
[57] A. A. Barber, S. A. O. Jr, E. Bueding, J. Biol. Chem. 1967, 242, 4040.
| 1:CAS:528:DyaF2sXksl2iu7k%3D&md5=20b1f7d3308884c1593be95f7e7a31e2CAS | 6061696PubMed |
[58] R. R. Cardell, J. Larner, M. B. Babcock, Anat. Rec. 1973, 177, 23.
| Crossref | GoogleScholarGoogle Scholar | 1:CAS:528:DyaE2cXhtlSisw%3D%3D&md5=dbd735f0252e86d594e3cb2087e92929CAS | 4747740PubMed |
[59] D. Baic, B. G. Ladewski, B. E. Frye, J. Exp. Zool. 1979, 210, 381.
| Crossref | GoogleScholarGoogle Scholar |