

Effects of Different Phases of Cigarette Smoke on Lipid Peroxidation and Membrane Structure in Liposomes
Nadezhda P. Palmina A , Elena L. Maltseva A , Tatyana E. Chasovskaya A , Valery V. Kasparov A , Nataliya G. Bogdanova A , Valery A. Menshov A and Aleksei V. Trofimov A BA Emanuel Institute of Biochemical Physics, RAS, Kosygin str. 4, 119334 Moscow, Russia.
B Corresponding author. Email: avt_2003@mail.ru
Australian Journal of Chemistry 67(6) 858-866 https://doi.org/10.1071/CH13663
Submitted: 30 November 2013 Accepted: 21 January 2014 Published: 24 February 2014
Abstract
This paper discloses for the first time the effects of the gas phase (GP) and the tar of cigarette smoke on lipid peroxidation (LPO) and on the structure of different lipid regions in liposomes. The LPO development was analysed in terms of the total unsaturation of lipids (double-bond, DB, content) and the formation of dienic conjugates (DC), ketodienes (KD), and malonic dialdehyde (MDA). As expected, the exposure of liposomes to either the GP or the tar led to a significant decrease in the DB content. However, the formation of oxidation products revealed different dynamics: MDA generation was inhibited, while the formation of DC and KD increased during the first few hours of the LPO development followed by its inhibition. The smoke constituents exhibited opposite effects on the structure of the lipid bilayer of liposomes: the GP markedly enhanced the microviscosity of liposomal membranes, whereas the tar caused a drastic lowering of microviscosity.
Introduction
Oxidative stress, derived from an imbalance between the production of reactive oxygen species (ROS) and the efficacy of the cellular antioxidant defence systems, is thought of as a general multifaceted phenomenon[1] exhibiting undesirable consequences in diverse biomedical contexts.[1,2] Indeed, hastening oxidative processes can lead to an altered intracellular redox status causing cellular dysfunction or death[1,2] and related events, most prominently oxidative DNA damage,[3–6] a primary process of carcinogenesis. It comes as no surprise that the development of pathogenic oxidative processes in human organism is lifestyle dependent.[2] Thus, cigarette smoking, which is considered in the literature as a risk factor for various pathological developments and diseases (such as chronic bronchitis, emphysema, cardiovascular disease, carcinogenic developments, and tumour growth[7–14]) causes, in particular, the oxidative damage of cell membranes and biological macromolecules.[6,15–23] Cigarette smoke is a complex chemical conglomerate that contains high concentrations of two distinctly different fractions of free radicals, one in its gas phase (GP) and another one in the particulate matter (tar).[16,17,24–27] The GP of the smoke predominantly contains reactive carbon- and oxygen-centred radicals, as well as a rather sizable amount of nitric oxide.[16,19] Tar contains, most prominently, polycyclic hydrocarbons, polyphenols, and quinones.[26,27] Reactive oxygen species (ROS) abundant in the smoke cause oxidative damage to cellular lipids, proteins, and DNA in vivo.[21] Elucidation of mechanisms of their generation in cigarette smoke and in the human organism after smoking, and their involvement in oxidative damaging processes, as well as related topics, such as the role of the hydrogen peroxide as a ROS precursor and signalling species,[28,29] are of paramount interest in the context of the biomedical aspects of cigarette smoking. In this context, it is worth noting that some free radicals may also cause inhibition of oxidative developments. Examples par excellence are furnished by the smoke-borne NO and nitroxyl radicals.[16,30] Indeed, it is well known that both nitric oxide[31,32] and nitroxyl free radicals[33,34] are able to inhibit oxidation processes including lipid peroxidation. Clearly, this adds mechanistic intricacy to the development of the smoking-associated oxidative stress.
Another type of powerful oxidative species in cigarette smoke is furnished by electronically excited particles generated in the smoke, as manifested by the chemiluminescence emission.[35,36] The high reactivity of electronically excited species towards biological materials constitutes a subject matter of ‘photobiology without light’ and is of prime concern in terms of photooxidative damage of biomolecules (most prominently, DNA).[37–40]
Lipid peroxidation (LPO) induces peroxidative destruction of cell membranes and thereby leads to a loss of their functional integrity and formation of early (such as dienic conjugates, DC) and terminal (such as malondialdehyde, MDA) LPO products.[18–21,41–46] In turn, diverse LPO products (peroxides, oxides, aldehydes, ketones, etc.) in excessive amounts are toxic to cells. They disturb membrane structures, sharply increase membrane permeability, and provoke changes in the activity of membrane-bound enzymes.[41,42] It is also worth noting that MDA, for instance, possesses both mutagenic and carcinogenic properties.[43]
Since the GP and the tar particles of cigarette smoke reveal different propensities to deposit in the respiratory tract,[16,17,26,27] consumption of smoke is associated with the natural separation of its chemicals in the human organism. Consequently, cells are exposed to different smoke constituents (either predominantly to particulate matter or to volatile gaseous reagents). Diverse groups of chemicals from the different phases of smoke should exert different actions on membrane lipids. A large body of studies has demonstrated the crucial role of the LPO process in developing smoking-associated oxidative stress.[22,23,45] At the same time, one should take into account the controversial character of the experimental evidence for the smoking-induced LPO derived from studies with living organisms, in which a rich variety of reactions contribute to the oxidation process.[16,17,26,27]
In this work, we investigated the interactions of the gaseous and the particulate phases of cigarette smoke with artificial membranes, namely liposomes, in an attempt to acquire mechanistic insights into the oxidative effects of smoke on the lipid environment and to assess the alteration of membrane structures upon their exposure to smoke chemicals.
Experimental
Materials
In the present work, we used experimental cigarettes with cellulose triacetate filters, whose tar and nicotine yields per sample were 9.0 and 0.73 mg, respectively. These cigarettes were kindly made available by the BAT-Yava factory (Moscow) exclusively for our research purposes. For separating the particulate and gaseous phases of the cigarette smoke, we used Cambridge filters able to retain up to 99.9 % of all particles with a diameter above 0.1 µm. Phosphatidylcholine (PC) used as material for making the liposomes was from Fluka. Doxylstearic acids (5-DSA and 16-DSA) and ferrous sulfate were from Sigma, while methanol, chloroform, and carbon tetrachloride were obtained from Merck.
Methods
GP of the Cigarette Smoke
The cigarette smoke was produced using the smoking machine A14 (Borgwaldt KC GmbH). This peristaltic-pump engine was operated at the rate of 6 puffs min–1 with a draw time of 58 s to generate 35 cm3 of cigarette smoke per 1 min, while smoking one cigarette within 5 min. The GP of the cigarette smoke was cleaned of particulate ingredients (tar) using the Cambridge filter pads. In the experiments with liposomes, the GP of the smoke was bubbled through 11 to 12 mL of a liposome suspension kept at 4°C, and for each liposome sample three cigarettes were used.
Tar Samples
The tar samples (2 mg mL–1) were obtained through isopropyl alcohol extraction (over 12 h at 8°C) of the particulate matter collected on the Cambridge filter from the smoke of four cigarettes. The cigarettes were smoked using the peristaltic pump as described above.
Liposome Preparation
Unilamellar small liposomes (small unilamellar vesicles, SUVs) were prepared as described in the literature.[38] In this procedure, PC was dissolved in chloroform (10 mg mL–1) and the latter was then evaporated under vacuum to obtain a fine layer of lipids. Dry lipids were resuspended by vortex agitation to a final lipid concentration of 1 mg mL–1 in tris-buffered 0.15 M KCl saline (pH 7.4) and treated with ultrasound using a 130 Watt Ultrasonic Processor with a 6 mm microtip for 10 min at 4°C under a stream of argon. Liposomes were centrifuged at 14 000 g at 4°C. The liposome size distribution determined using scattering of laser light (Mastersizer, Malvern) was unimodal, and the vesicle sizes ranged between 20 and 300 nm with a mean value of 99.6 ± 9.5 nm.
Determination of the Primary LPO Products
Liposomes were incubated at 37°C in closed tubes for different periods of time to study either FeSO4-initiated[47] ([FeSO4] = 100 µM) or spontaneous LPO. At different times, aliquots of each suspension were withdrawn to evaluate the content of the DC and ketodienes (KD).[48] The DC and KD were monitored by measuring the absorption spectrum in the range of 200 to 300 nm with a Perkin–Elmer Lambda-25 UV/vis spectrophotometer. The oxidation index, as referred to DC formation, was determined by the D233/D205 ratio, in which D233 is the optical-density peak between 233 and 235 nm, corresponding to the DC absorption maximum, and D205 is the peak between 204 and 206 nm that refers to the maximum absorption of unoxidised lipids.[48] The oxidation index related to the KD was calculated from the same absorption spectrum by the D275/D204 ratio.[49]
Determination of the Secondary LPO Products
For the MDA measurements, 1 mL of water, 1 mL of thiobarbituric acid (0.67 % in water), 1 mL of trichloracetic acid (30.0 % in water), and 0.1 mL of butyl hydroxytoluene (0.22 % in ethanol) were added to 0.1 mL of each treated liposome sample. Such a mixture was incubated for 15 min in a boiling-water bath and, after cooling, the optical density at 532 nm was measured with a Perkin–Elmer Lambda-25 UV/vis spectrophotometer. The results were expressed in nmol of MDA per 1 mg of phospholipids, using a molar extinction coefficient of 1.56 × 10⁵ M–1 cm–1.[50]
Determination of the Total Unsaturation of Lipid Substrates (Double Bond Content)
The double bond (DB) content was determined by an ozonation technique using a DBA double-bond automated analyzer (EKOZONE).[51] Scintillation of stilbene was used as a standard. The reactor of the analyzer, containing CCl4, was filled with 10 µL of the experimental samples with a lipid concentration of 10 mg mL–1. The DB content was calculated according to Eqn 1:

in which [DB] is the measure of the lipid unsaturation in µmol mg–1 (phospholipids), Cst represents the concentration of the standard solution, Vst and V0 are the volumes of the standard and the research samples, Sst and S0 are the integrals of the dynamic signal from the standard and the sample, G represents the weight of the substance, and Vsol is the volume of the sample solution.
Electron Spin Resonance (ESR) Studies
The ESR measurements were performed as described previously[52] using spin probes.[53] The two doxyl radicals, 5- and 16-doxylstearic acids (5- and 16-DSA,Sigma) were used as spin probes. The 5- and 16-DSA (10–2 M) probes in ethanol were added to 200 µL of the membrane suspensions (final concentrations ranged from 3 × 10⁻⁵ to 10–4 M) and incubated for 30 min. The final ethanol content of the research samples did not exceed 0.6 %. The ESR measurements were performed using a Bruker EMX spectrometer.
The rotational correlation time (τC) constitutes the characteristic time of probe reorientation at π/2, which may be used to obtain the apparent microviscosity of the cell (liposome) membrane, and was calculated from the measured 16-DSA spectra using the known relation, as expressed by Eqn 2 for a fast (6 × 10–11 < t < 3 × 10⁻⁹ s) motion of the nitroxyl radicals:

in which I+1 and I–1 are the resonance heights of the low and the high-field components of the ESR spectra correspondingly, while ΔH+1 represents the resonance width of the low-field component.
The order parameter (S) characterizes the order degree of the long axis of the 5-DSA and is related to the molecular motion of a lipid matrix and may be obtained with the help of the known expression in the form of Eqn 3:

in which 2H// is the resonance width between the low- and the high-field (external) extremes of the ESR spectra and 2HI is that for the internal extremes.
Results
The Effect of the Smoke GP on the Initiated LPO in Liposomes
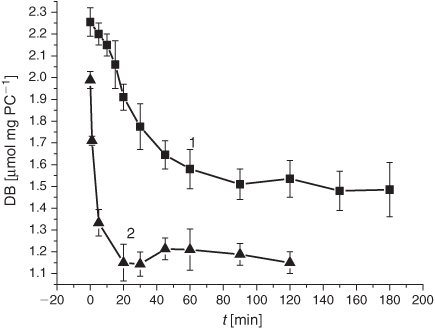
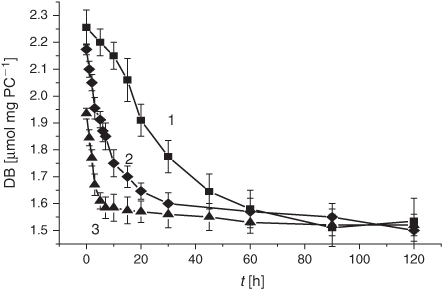
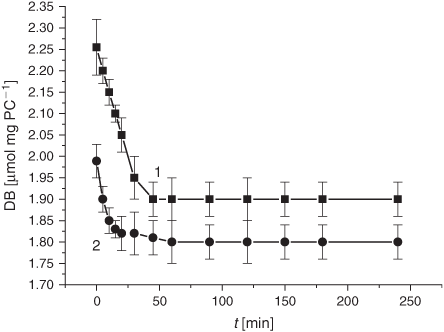
For monitoring the LPO process in lipid materials, their DB content is of prime importance. Thus, as a step to elucidate the influence of the smoke GP chemicals on the LPO development, we examined the effect of the smoke GP on the DB content (monitored with the double-bond automated analyzer, as specified in the Experimental section) during the course of the oxidation process initiated in the experimental liposome samples. As is evident from Table 1, a 12 min exposure of liposomes to the smoke GP (bubbling at 4°C) before the LPO initiation significantly lowered the DB content (1.99 µmol mg PC–1) compared with the control (2.25 µmol mg PC–1). After LPO induction, the decrease of the DB content in liposomes exposed to the GP persisted and was more pronounced than that in the control experiment (Fig. 1).

|
|
We have examined the kinetic features of the DB consumption approximating the initial parts of the time profiles by first-order kinetics, i.e. assuming that [DB] = [DB]0e–kt. As a result, we have estimated the average rates (Vav) and effective constant (k) for the DB disappearance in control liposomes and in liposomes exposed to the smoke GP. The mentioned Vav and k values showed the most remarkable changes in GP-exposed liposomes within the first 5 min of the LPO process (Table 1). Upon exposure to the smoke GP, the V(DB)av value was 23 times higher compared with the control samples, whereas the k value exhibited a 30-fold increase (Table 1).
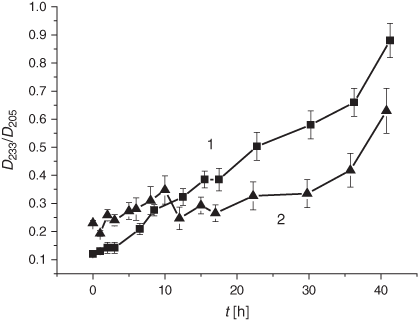
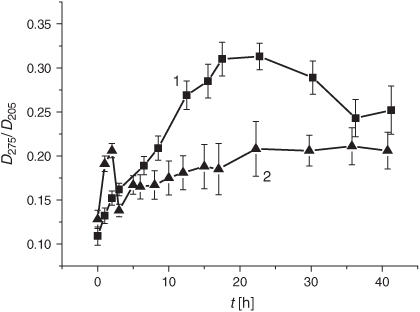
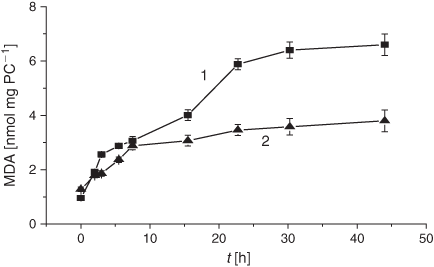
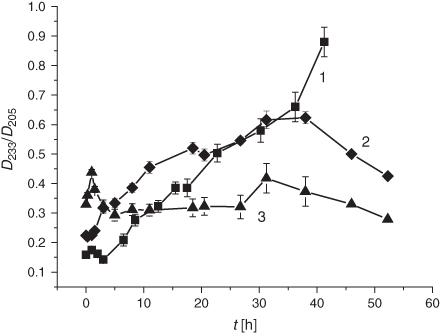
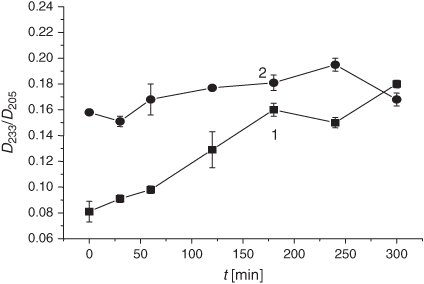
LPO development was monitored by looking at the primary (DC) and the secondary (KD and MDA) LPO products following LPO induction in liposomes. As described in the Experimental section, the DC formation was monitored by the D233/D205 optical density ratio, the KD production was tracked through the D275/D204 ratio, while monitoring the optical density at 532 nm was used for MDA. The first 10 h of the initiated LPO process resulted in an increased formation of the DC products followed by the inhibition of DC production in the smoke-exposed liposomes for up to 40 h of incubation (Fig. 2).
|
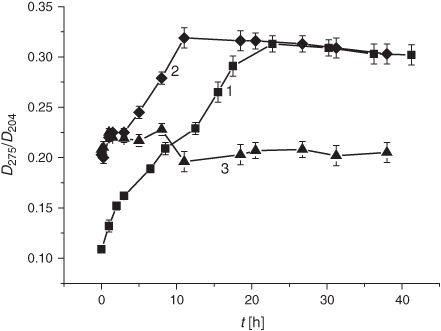
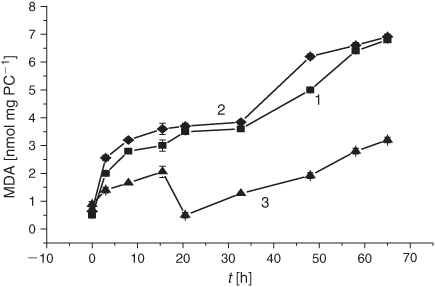
It is worth noting that the drastic elevation of the DC level during the first 10 h is accounted for by its increase before the LPO induction rather than by an elevated oxidation rate. The real average LPO rate, V(DC)av, in liposomes during the first 5 h was 1.9 times lower than in the control samples (0.9 × 10⁻² h–1 versus 1.7 × 10⁻² h–1, cf. Table 1). Production of the secondary LPO products, KD and MDA, was significantly reduced upon exposure to the smoke GP as compared with the control samples (Figs 3 and 4).
|
|
The Tar Effect on Initiated LPO Process in Liposomes
Similarly to studying the LPO modulation by the smoke GP, to assess the effects of the smoke particulate phase on the LPO process we studied changes in the oxidation of liposome lipids manifested by changing the DB content as well as by the production of the primary and secondary oxidation products. For that purpose, the isopropyl alcohol tar extracts with a tar concentration of ~2 mg mL–1 were added to liposomes (1.0 mg PC mL–1) before the LPO induction. A significant (13–11 %) decrease in the DB content takes place immediately upon introduction of the tar extracts into liposomes before the LPO induction, as compared with the pure control and isopropyl alcohol control samples (Table 1). After 20 min of oxidation, the decrease of the DB content in both tar-exposed and the control liposomes had reached the same level and approached 1.6 µmol mg PC–1. A 1.5-fold increase of the V(DB)av value for the DB consumption upon exposure to the tar chemicals was observed compared to the controls (Table 1). The k values showed no significant changes upon addition of the tar.
Addition of tar extracts to liposomes provoked a slight decrease in the DB level as compared with the control during the first 20 min after the LPO initiation (Fig. 5).
|
As shown in Fig. 6, DC formation after exposing the samples to the tar chemicals significantly increased during the first 5 h of the LPO process. Maximal DC levels were observed 1 h after LPO induction with the subsequent decrease in the DC content (Fig. 6). As compared with the control, tar addition caused a 1.5-fold increase in the initial DC level. After 5 h, the tar inhibited the formation of the DC products for up to almost 60 h of the LPO development. The V(DC)av value exhibited a 5-fold increase during the first hour of oxidation upon exposure to the tar (Table 1). The secondary LPO product, namely KD, showed dynamics similar to that of the DC formation. Indeed, the increase of the pertinent oxidation index (KD) at the very beginning of oxidation was followed by its rapid decrease in response to the tar exposure (Fig. 7). Conversely, the tar induced an inhibition of MDA formation during the whole observation time (Fig. 8).
|
|
|
The Effect of the Smoke GP and the Tar on the Lipid Microviscosity and the Order Parameter in Liposomes
Since the LPO products formed upon exposure to the smoke GP may affect the structure of different lipid regions in liposomes, we evaluated the changes in the membrane fluidity and rigidity expressed, respectively, by the values of the rotational correlation time (τC) and the order parameter (S). For these purposes, an ESR spin probe technique has been used with the following spin probes: 16-DSA was harnessed for the τC measurements, while 5-DSA was used for the S monitoring, and the pertinent experimental details are disclosed in the Experimental section.
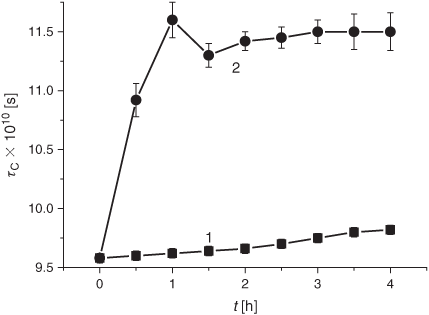
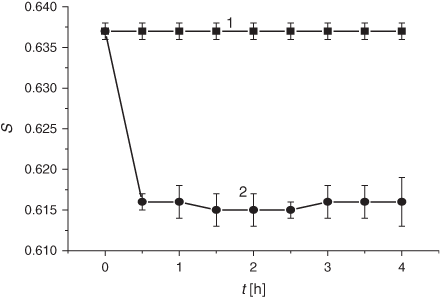
The smoke GP induced a significant (~20 to 24 %) increase of the membrane microviscosity in the hydrophobic lipid regions (20–22 Å from the surface) within the first 30 min of exposure (Fig. 9). The decrease in microviscosity became observable (down to 7–8 % below the control level after 24 h) only after 18 h of incubation. Conversely, the order parameter (S) indicating the structural state of the membrane area located at the depth of 8 Å, markedly decreased after 30 min of exposure to the GP and levelled off during the following 3.5 h of exposure (Fig. 10). The S value returned to the control level only after 18 to 20 h of incubation.
|
|
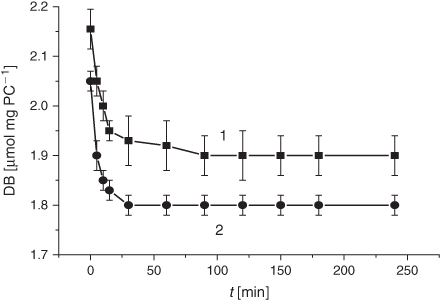
In parallel with the changes in the membrane structure upon exposure of the experimental samples to the smoke GP, we examined the dynamics of the DB content and the oxidation products during the spontaneous LPO process (Fig. 11). As evident from Fig. 11, exposure to the GP of the smoke reduced the DB content slightly. Conversely, the DC level increased during 4 h of liposome incubation at 37°C (Fig. 12).
|
|
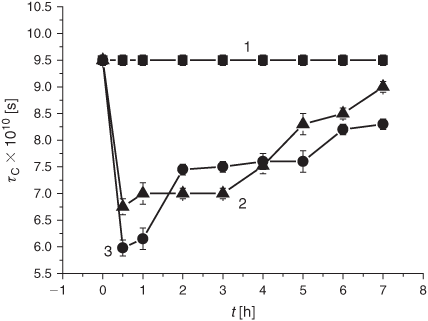
The studies on the membrane microviscosity upon exposure of the samples to the smoke particulate phase were carried out using concentrated isopropyl alcohol solutions of tar (2 mg mL–1), as well as their 10-fold dilutions. The tar appeared to reduce the membrane microviscosity, as indicated by the rotation correlation time (τC) of the 16-DSA spin probe (Fig. 13). The maximal effect (30–37 %) was observed 30 min after the injection of the tar extract. The 10-fold diluted tar extracts exhibited a more pronounced impact on microviscosity in 30 min of incubation which was maintained for 1 h (Fig. 13, curve 3), whereas the higher tar concentrations resulted in a more protracted effect observed during 3 h of incubation (Fig. 13, curve 2).
|
The pertinent DB changes upon the tar exposure of the same liposomes (Fig. 14) were similar to those observed under the treatment with the smoke GP (Fig. 11). As a matter of fact, there was a slight difference (less than 0.1 µmol mg PC–1) in the initial DB level which persisted during the rest of the incubation time. The oxidation index of the spontaneous LPO was insignificantly higher in liposomes treated with the tar and corresponded to the level of the LPO induction period.
|
Discussion
In the present work, we utilised liposomes as a facile model of cell membranes for studies on the LPO process and changes in membrane structural features upon exposure to different phases of cigarette smoke.
The LPO process in bulk phospholipids depends on their unsaturation.[54–57] Thus, it has been hypothesised that the membrane response to cigarette smoke should differ, depending on initial unsaturation of the PC material being used for liposome preparations. There exists only a few reports on cell membranes and liposomes exposed to cigarette smoke.[58,59] In the present study, we harnessed liposomes with a relatively low degree of total unsaturation (2.25 µmol mg PC–1), which distinguishes them from those used previously. The DB content is one of the characteristic features of lipid substrates, which is of prime interest for the assessment of oxidative stress status. As reported previously, during LPO development the DB content changes earlier than the other characteristic parameters of interest.[54] As is evident from Fig. 1, exposure of liposomes to the GP of the smoke resulted in a drastic decrease in the DB content. The observed acceleration of the consumption of the unsaturated PC was accompanied by an increase of the formation of the primary LPO products such as DC species during the first 10 h (Fig. 2). The high DC level may be accounted for by the spontaneous DC production while bubbling the smoke GP through the liposome suspension before the LPO initiation. The effect of the smoke GP on the DC production is rather intricate: the observed 10 h increase in DC generation was followed by its inhibition. Although the Vav and the k values of the DB consumption exhibited a multifold increase upon exposure to the smoke GP, the DC change was lower than that in the control samples (Table 1). The smoke GP induced a short (2 h) increase in KD production followed by its inhibition as compared with the control (Fig. 3). At the same time, the MDA production was inhibited while exposing the liposomes to the smoke GP (Fig. 4).
Cigarette smoke constitutes an extremely complex matrix of more than 5000 chemicals.[16–18,24,26,27] The tar contains diverse persistent radicals that can be observed directly by ESR.[16,17,19,21,25] However, the effects of the smoke tar on the LPO development remain unclear.[16,17,26,27] In the present work, addition of tar extracts to liposomes provoked a slight decrease in the DB level as compared with the control samples during the first 20 min after LPO initiation (Fig. 5) and a considerable acceleration of the DC formation during the first 2 h (Fig. 6). It is worth noting that insignificant changes in the DB content were accompanied by a drastic increase of DC production manifested by the Vav value (Table 1).
Taken together, the data concerning the effects of the gaseous and particulate phases on DB content in liposomes during peroxidation therein indicate that both phases of the smoke result in a decrease in the DB level (Figs 1 and 5). However, the effect of the gaseous phase in reducing the DB quantity was twice as high as that of the tar. The acceleration of the DB consumption was also significantly higher upon exposure to the GP than under the tar influence as manifested by the increase of the Vav (23- versus 1.3-fold) and the k (30- versus 1.2-fold) values. On the other hand, there are the differences in the GP and the tar effects on the LPO process: while the GP induced significant changes in the DB level, tar caused a drastic increase in the DC production (Table 1). We observed similar DC kinetics while exposing liposomes to the gaseous and particulate phases of the cigarette smoke. The increase in DC formation was followed by its inhibition (Fig. 2 and Fig. 6). Conversely, the period of the KD increase was much longer upon exposure to the particulate phase, namely 15 versus 2 h in experiments with the GP (cf. Figs 3 and 7). It should be noted that in both modes of liposome treatment (i.e. using either gas or particulate phase), MDA formation was inhibited compared with the control case.
To rationalise the different effects of the gaseous and the particulate phases on the LPO process manifested by its diverse indicators (changes of the DB, DC, KD, or MDA contents), different facets need to be considered: (i) an alteration of the average transformation rate of the primary LPO products (DC) into the secondary ones (KD and MDA) and (ii) an inhibition of the LPO process after several hours of oxidation by the GP and the tar chemicals. The contradictory results pertaining to the GP and the tar effects on the LPO process in living systems[16,17,26] may be attributed to the diverse nature of the intervention of the smoke phases into the overall oxidation mechanism. Our findings indicate that the difference (acceleration or inhibition of LPO development) in response to reactants formed in the smoke GP and in the tar is a matter of choosing an appropriate oxidation product as a pertinent marker of the LPO process.
The last but not least part of the present study pertains to the effects of the smoke phases on membrane structural features. For the first time, we demonstrate that exposure of liposomes to either the gaseous or particulate phase significantly modified lipid microviscosity (Figs 9 and 13). In this context, the question of importance is whether these observations may be accounted for by altering the LPO development. The decrease in the DB content observed in the control and in the research liposome samples was accompanied by a microviscosity increase (cf. Figs 9 and 11). The microviscosity change was monitored through ESR spectroscopy with the 16-DSA spin probe, whose nitroxyl moiety was localised at the depth of 20 to 22 Å, the area of free fatty acids in liposomes and membranes.[60] The increase (4 %) of the τC value in the control liposomes (Fig. 9, curve 1) during 4 h parallels the decrease (15.5 %) of the DB content (Fig. 11, curve 1), while exposure to the smoke GP induced the increase (21 %) of τC during 1 h (Fig. 9, curve 2) accompanied by the reduction (20 %) of the DB content (Fig. 11, curve 2). The reported data suggest that changes in microviscosity upon exposure to the smoke GP occur not only because of an oxidative modification of lipids but also for other reasons. Furthermore, taking into account the results of exposing the samples to the tar manifested by a change in the lipid microviscosity and the DB level (cf. Figs 13 and 14), one may conclude that liposome fluidization has little to do with changing the DB content and has another origin, most likely, incorporation of the diverse tar constituents into the membrane structure.
The order parameter (S) decreased under exposure to the smoke GP (Fig. 10), implying that those lipid areas closer to the surface become less ordered. A slight increase in the DC level was detected in the control samples and under the GP exposure, while a decrease in the order parameter was observed only after the GP treatment (Fig. 10). Despite that the literature data indicate that an LPO intensification results in a decrease of the S value,[58,59,61,62] from our point of view, these changes could not be explained solely by oxidative processes. Thus, the data disclosed above reveal that the cigarette smoke significantly modifies the different regions of liposomes and these modifications are not merely of oxidative origin.
In the context of the present study, one of the key contemporary diagnostic problems refers to the quest for appropriate biomarkers. Indeed, biomarkers are of prime importance for the rapid assessment of the efficiency of the harm-reduction strategies, most prominently, related to the exposure to the smoke-borne carcinogens.[63] Several studies suggest that the LPO products may be considered as pertinent biomarkers of harm.[15,64–67] The essential part of their conclusions is based on the experimental data acquired in vivo and through using cell culture probes.[64–68] There exists very limited experimental material available through in vitro studies.[69,70] To remedy this deficiency, in the present work, we monitored the oxidation biomarkers (namely, DB, DC, KD, and MDA contents) during the initiated LPO process in artificial membranes and the structural changes in different lipid regions of liposomes upon exposure to the GP and the tar phases of the cigarette smoke. We have found that both the GP and tar exhibit a stepwise effect on LPO development: LPO acceleration occurred during the first hours of exposure to the smoke constituents followed by its inhibition. However, the relationship between these two stages differed for the gaseous and particulate smoke phases.
The antioxidant activity of both the smoke GP (Figs 2–4) and the tar (Figs 6–8) merits particular emphasis. The propensity of smoke constituents to suppress oxidation processes is known from the literature.[71–74] Nevertheless, the term ‘antioxidant activity’ in reference to cigarette-smoke chemicals[71] is used, in our opinion, unjustifiably rarely. At the same time, the origin of the oxidative stress derives from the imbalance of the activity of oxidants and antioxidants,[1] and for understanding the nature of the smoking-associated oxidative stress the antioxidant activity of smoke components should receive the attention it deserves.
The cigarette smoke provoked modifications in the membrane structure, whose nature is not of oxidative origin (incorporation of the smoke particles into the membrane structure is the likely reason) and needs further in-depth investigation. Finally, liposomes merit further attention as facile model systems for the assessment of plausible harm-reduced cigarette smoke.
Acknowledgements
The reported work was generously funded by the British American Tobacco Group Research and Development (BAT GR&D) and the Russian Academy of Sciences. The authors are grateful to Dr Ian Fearon, Dr Marianna Gaça, and Dr Chuan Liu (BAT GR&D, Southampton, UK) for productive discussions, valuable suggestions, and pertinent scientific inputs.
References
[1] H. Sies, D. P. Jones, in Encyclopaedia of Stress (Ed. G. Fink) 2007, pp. 45–48 (Elsevier: San Diego, CA).[2] I. M. Fearon, S. P. Faux, J. Mol. Cell. Cardiol. 2009, 47, 372.
| Crossref | GoogleScholarGoogle Scholar | 1:CAS:528:DC%2BD1MXptVegsbY%3D&md5=8580127d217ab3fafd2fbcfee3384250CAS | 19481547PubMed |
[3] B. Epe, P. Mützel, W. Adam, Chem. Biol. Interact. 1988, 67, 149.
| Crossref | GoogleScholarGoogle Scholar | 1:CAS:528:DyaL1MXitlCm&md5=6d52565463c7329a934c97571ea4ae6fCAS | 2844422PubMed |
[4] W. Adam, G. H. Grimm, C. R. Saha-Möller, F. Dall’Acqua, G. Miolo, D. Vedaldi, Chem. Res. Toxicol. 1998, 11, 1089.
| Crossref | GoogleScholarGoogle Scholar | 1:CAS:528:DyaK1cXltlyhsbo%3D&md5=e172a7557a04cb7d32e8e430fcbefb10CAS | 9760284PubMed |
[5] H.-C. Mahler, I. Schulz, W. Adam, G. H. Grimm, C. R. Saha-Möller, B. Epe, Mutat. Res. 2001, 461, 289.
| Crossref | GoogleScholarGoogle Scholar | 1:CAS:528:DC%2BD3cXosFCgsrc%3D&md5=92a4fe719b389d6fb7c8c1d7c030b904CAS | 11104905PubMed |
[6] D. Thorne, J. Wilson, T. S. Kumaravel, E. D. Massey, M. McEwan, Mutat. Res. 2009, 673, 3.
| Crossref | GoogleScholarGoogle Scholar | 1:CAS:528:DC%2BD1MXhtlSktLc%3D&md5=bf6fcc49253c018da2575ba242f91056CAS | 19100859PubMed |
[7] E. Passowicz-Muszyńska, A. Gostkowska-Malec, R. Jankowska, P. Piesiak, Pneumonol. Alergol. Pol. 2010, 78, 28.
| 20162516PubMed |
[8] R. Goralczyk, Nutr. Cancer 2009, 61, 767.
| Crossref | GoogleScholarGoogle Scholar | 1:CAS:528:DC%2BC3cXjsVOgsw%3D%3D&md5=c6c365adcb8ba22df86cc7c0af518288CAS | 20155614PubMed |
[9] I. Horváth, Z. Lázár, N. Gyulai, M. Kollai, G. Losonczy, Eur. Respir. J. 2009, 34, 261.
| Crossref | GoogleScholarGoogle Scholar | 19567608PubMed |
[10] G. Lee, T. C. Walser, S. M. Dubinett, Curr. Opin. Pulm. Med. 2009, 15, 303.
| Crossref | GoogleScholarGoogle Scholar | 1:CAS:528:DC%2BD1MXmslyitL0%3D&md5=7b336db3cd1281b8729dade557f95b6aCAS | 19417670PubMed |
[11] P. Balakumar, J. Kaur, Pharmacol. Res. 2009, 60, 361.
| Crossref | GoogleScholarGoogle Scholar | 1:CAS:528:DC%2BD1MXhtFSnsrrO&md5=1ec080fa2d8bd7947a69e8cf4f874e2bCAS | 19559087PubMed |
[12] A. N. Thorndike, N. A. Rigotti, Curr. Opin. Cardiol. 2009, 24, 447.
| Crossref | GoogleScholarGoogle Scholar | 19550307PubMed |
[13] S. S. Hecht, F. Kassie, D. K. Hatsukami, Nat. Rev. Cancer 2009, 9, 476.
| Crossref | GoogleScholarGoogle Scholar | 1:CAS:528:DC%2BD1MXnsFyntb4%3D&md5=1acc4b7c552e0d56fb66937d0cd084afCAS | 19550424PubMed |
[14] A. Catassi, D. Servent, L. Paleari, A. Cesario, P. Russo, Mutat. Res. 2008, 659, 221.
| Crossref | GoogleScholarGoogle Scholar | 1:CAS:528:DC%2BD1cXhtVKiur7P&md5=e49de28b020cb1b7459db23818b58318CAS | 18495523PubMed |
[15] S. P. Faux, T. Tai, D. Thorne, Y. Xu, D. Breheny, M. Gaça, Biomarkers 2009, 14, 90.
| Crossref | GoogleScholarGoogle Scholar | 1:CAS:528:DC%2BD1MXhtFehsb7F&md5=e780637e03107a76855bd1ccfeed63e7CAS | 19604067PubMed |
[16] W. A. Pryor, Environ. Health Perspect. 1997, 105, 875.
| 1:CAS:528:DyaK2sXls1els78%3D&md5=fbe0151517e779a0391491ba7a802d57CAS | 9255574PubMed |
[17] D. F. Church, W. A. Pryor, Environ. Health Perspect. 1985, 64, 111.
| Crossref | GoogleScholarGoogle Scholar | 1:CAS:528:DyaL28Xht1ChtLg%3D&md5=18c1a156945f0cc5bb33b86f75b33788CAS | 3007083PubMed |
[18] B. Halliwell, C. E. Cross, Environ. Health Perspect. 1994, 102, 5.
| 1:CAS:528:DyaK2MXjsVaisLg%3D&md5=e60c57e2556bd9adf64d02a1679b1b3bCAS | 7705305PubMed |
[19] P. Kovacic, R. Somanathan, Rev. Environ. Contam. Toxicol. 2009, 201, 41.
| Crossref | GoogleScholarGoogle Scholar | 1:CAS:528:DC%2BD1MXos1yitb8%3D&md5=c1d89ad727d9fb009fcd255db992313eCAS | 19484588PubMed |
[20] V. L. Kinnula, K. Vuorinen, H. Ilumets, P. Rytilä, M. Myllärniemi, Curr. Med. Chem. 2007, 14, 213.
| Crossref | GoogleScholarGoogle Scholar | 1:CAS:528:DC%2BD2sXitlamsr4%3D&md5=f940bb316c07f1b9a41ef4d0a6158b09CAS | 17266580PubMed |
[21] R. A. Floyd, J. E. Schneider, in Membrane Lipid Oxidation (Ed. C. Vigo-Pelfrey) 1991, Vol. 3, pp. 69–85 (CRC Press: Boca Raton, FL).
[22] I. Rahman, Cell Biochem. Biophys. 2005, 43, 167.
| Crossref | GoogleScholarGoogle Scholar | 1:CAS:528:DC%2BD2MXpsFCgtbc%3D&md5=b070e195227e87c9b2f7351401eaa13eCAS | 16043892PubMed |
[23] H. van der Vaart, D. S. Postma, W. Timens, N. H. Ten Hacken, Thorax 2004, 59, 713.
| Crossref | GoogleScholarGoogle Scholar | 1:STN:280:DC%2BD2cznvFCltA%3D%3D&md5=74086ba5a6a07aacd40ac9f6f212e6b4CAS | 15282395PubMed |
[24] D. Hoffmann, S. S. Hech, in Chemical Cagcinogenesis and Mutagenesis (Eds C. S. Cooper, P. L. Grover) 1989, pp. 64–102 (Springer: New York, NY).
[25] S. Chouchane, J. B. Wooten, F. J. Tewes, A. Wittig, B. P. Muller, Chem. Res. Toxicol. 2006, 19, 1602.
| Crossref | GoogleScholarGoogle Scholar | 1:CAS:528:DC%2BD28XhtlCitbzK&md5=78e474ee43b15b6a5b28f329b08097b9CAS | 17173373PubMed |
[26] W. A. Pryor, Science 1983, 220, 425.
| Crossref | GoogleScholarGoogle Scholar | 1:CAS:528:DyaL3sXhvFehsro%3D&md5=fb87fb6ce841bafa2e9510c649471122CAS | 6301009PubMed |
[27] M. Culcasi, A. Muller, A. Mercier, J.-L. Clement, O. Payet, A. Rockenbauer, V. Marchand, S. Pietri, Chem. Biol. Interact. 2006, 164, 215.
| Crossref | GoogleScholarGoogle Scholar | 1:CAS:528:DC%2BD28Xht1Ciu7jK&md5=d0255346c16524b584c90cc106851fdaCAS | 17083924PubMed |
[28] F. Yan, S. Williams, G. D. Griffin, R. Jagannathan, S. E. Plunkett, K. H. Shafer, T. Vo-Dinh, J. Environ. Monit. 2005, 7, 681.
| Crossref | GoogleScholarGoogle Scholar | 1:CAS:528:DC%2BD2MXlsF2ht7c%3D&md5=c986eb45a3c507ece4648e3cbc76b48dCAS | 15986047PubMed |
[29] V. A. Menshov, A. V. Trofimov, Mini Rev. Org. Chem. 2011, 8, 394.
| Crossref | GoogleScholarGoogle Scholar | 1:CAS:528:DC%2BC3MXhtlyitLfI&md5=506be35b7662f720a36bed20f4c7f728CAS |
[30] R. R. Baker, in Tobacco Production, Chemistry and Technology (Eds D. L. Davis, M. T. Nielsen) 1999, pp. 398–439 (Blackwell Science Ltd: Oxford).
[31] V. B. O’Donnell, P. H. Chumley, N. Hogg, A. Bloodsworth, V. M. Darley-Usmar, B. A. Freeman, Biochemistry 1997, 36, 15216.
| Crossref | GoogleScholarGoogle Scholar | 1:CAS:528:DyaK2sXntlCltbs%3D&md5=6718e3c5c56a8cadfa7e10bd1c7e54c3CAS | 9398249PubMed |
[32] N. Hogg, B. Kalyanaraman, Biochim. Biophys. Acta 1999, 1411, 378.
| Crossref | GoogleScholarGoogle Scholar | 1:CAS:528:DyaK1MXjsF2qt74%3D&md5=f16dcc539ea1412ee0afb0cd40757967CAS | 10320670PubMed |
[33] G. Cighetti, P. Allevi, S. Debiasi, R. Paroni, Chem. Phys. Lipids 1997, 88, 97.
| Crossref | GoogleScholarGoogle Scholar | 1:CAS:528:DyaK2sXlvVKmur4%3D&md5=c85bd96c98f599f688030ce7a3584319CAS | 9314187PubMed |
[34] S. Shimakawa, Y. Yoshida, E. Niki, Lipids 2003, 38, 225.
| Crossref | GoogleScholarGoogle Scholar | 1:CAS:528:DC%2BD3sXjvFOrtb8%3D&md5=a3ffb4a55ab5049e75c65d377c3193f5CAS | 12784862PubMed |
[35] H. H. Seliger, W. H. Biggley, J. P. Hamman, Science 1974, 185, 253.
| Crossref | GoogleScholarGoogle Scholar | 1:STN:280:DyaE2c3lslyjtA%3D%3D&md5=fbb0645729c63c8db54ba71cfd8d7b84CAS | 4833826PubMed |
[36] G. F. Fedorova, V. A. Menshov, A. V. Trofimov, Yu. B. Tsaplev, R. F. Vasil’ev, Luminescence 2010, 25, 130.
[37] Chemical and Biological Generation of Excited States (Eds W. Adam, G. Cilento) 1982 (Academic Press: New York, NY).
[38] G. Cilento, W. Adam, Free Radic. Biol. Med. 1995, 19, 103.
| Crossref | GoogleScholarGoogle Scholar | 1:CAS:528:DyaK2MXlvVagtrg%3D&md5=62fcc2c6717d0c7d661b21001c5ad3afCAS | 7635351PubMed |
[39] W. Adam, J. Hartung, H. Okamoto, C. R. Saha-Möller, K. Spehar, Photochem. Photobiol. 2000, 72, 619.
| Crossref | GoogleScholarGoogle Scholar | 1:CAS:528:DC%2BD3cXosVKitbs%3D&md5=9aa3e9f726149e388c660675e9fba73aCAS | 11107846PubMed |
[40] C. Bohne, K. Faulhaber, B. Giese, A. Häfner, A. Hofmann, H. Ihmels, S. Köhler, A.-K. Perä, F. Schneider, M. A. L. Sheepwash, J. Am. Chem. Soc. 2005, 127, 76.
| Crossref | GoogleScholarGoogle Scholar | 1:CAS:528:DC%2BD2cXhtVKrsrfN&md5=a428883bba25fff47b69020e493bfd8cCAS | 15631456PubMed |
[41] E. B. Burlakova, N. P. Pal’mina, E. L. Mal’tseva, in Membrane Lipid Oxidation (Ed. C. Vigo-Pelfrey) 1991, Vol. 3, pp. 209–238 (CRC Press: Boca Raton, FL).
[42] V. E. Kagan, Lipid Peroxidation in Biomembranes 1988 (CRC Press: Boca Raton, FL).
[43] R. J. Schaur, H. Zollner, H. Esterbauer, in Membrane Lipid Oxidation (Ed. C. Vigo-Pelfrey) 1991, Vol. 3, pp. 141–164 (CRC Press: Boca Raton, FL).
[44] J. Lykkesfeldt, Clin. Chim. Acta 2007, 380, 50.
| Crossref | GoogleScholarGoogle Scholar | 1:CAS:528:DC%2BD2sXjslSks74%3D&md5=c512a1623b27bd560650f949f7363709CAS | 17336279PubMed |
[45] M. Guichardant, M. Lagarde, Eur. J. Lipid Sci. Technol. 2009, 111, 75.
| Crossref | GoogleScholarGoogle Scholar | 1:CAS:528:DC%2BD1MXitV2qsbY%3D&md5=f4f977bd1104b039fd69a2f7bd0da6c9CAS |
[46] A. N. Cimato, L. L. Piehl, G. B. Facorro, H. B. Torti, A. A. Hager, Free Radic. Biol. Med. 2004, 37, 2042.
| Crossref | GoogleScholarGoogle Scholar | 1:CAS:528:DC%2BD2cXpslyisr0%3D&md5=509e5a2cb22403809bb84acebf7a5424CAS | 15544922PubMed |
[47] T. Ohyashiki, A. Kadova, K. Kushida, Chem. Pharm. Bull. (Tokyo) 2002, 50, 203.
| Crossref | GoogleScholarGoogle Scholar | 1:CAS:528:DC%2BD38Xks12ktbc%3D&md5=6f564e650571a2144953b2717c975791CAS | 11848210PubMed |
[48] R. Klein, Biochim. Biophys. Acta 1970, 210, 486.
| Crossref | GoogleScholarGoogle Scholar | 1:CAS:528:DyaE3MXhtVaksg%3D%3D&md5=c14f41c8792a050f478425c6d9ddebf8CAS | 5528599PubMed |
[49] N. L. Parinandi, B. K. Weis, W. Natarajan, H. H. Schmid, Arch. Biochem. Biophys. 1990, 280, 45.
| Crossref | GoogleScholarGoogle Scholar | 1:CAS:528:DyaK3cXkt1Wlsbs%3D&md5=20923b04be97e872413a2d06af2140a8CAS | 2353824PubMed |
[50] Methods in Enzymology (Eds S. Fleisher, L. Packer) 1978 (Academic Press: New York, NY).
[51] D. M. Lisitsyn, S. D. Razumovskii, M. A. Tishenin, V. N. Titov, Bull. Exp. Biol. Med. 2004, 138, 457.
| Crossref | GoogleScholarGoogle Scholar | 1:CAS:528:DC%2BD2MXitlOjsb0%3D&md5=cf58aa5bed559f90a3025ad0bea7d7d0CAS | 15723125PubMed |
[52] Spin Labeling: Theory and Application (Ed. L. J. Berliner) 1979 (Academic Press: New York, NY).
[53] M. Abe, Chem. Rev. 2013, 113, 7011.
| Crossref | GoogleScholarGoogle Scholar | 1:CAS:528:DC%2BC3sXhtFKgurvP&md5=4c0d2ccecdaa3251315379dd66f5a921CAS | 23883325PubMed |
[54] E. I. Pinzar, N. P. Palmina, Membr. Cell Biol. 1998, 12, 241.
| 1:STN:280:DyaK1M%2FpsFKhsg%3D%3D&md5=d81a421b9547065be780ec56a8246b03CAS | 9879547PubMed |
[55] L. Xu, T. A. Davis, N. A. Porter, J. Am. Chem. Soc. 2009, 131, 13037.
| Crossref | GoogleScholarGoogle Scholar | 1:CAS:528:DC%2BD1MXhtVCgt7zI&md5=60fd0b61ea02419c49eda44ff8bf9e7dCAS | 19705847PubMed |
[56] R. S. Sargis, P. V. Subbaiah, Biochemistry 2003, 42, 11533.
| Crossref | GoogleScholarGoogle Scholar | 1:CAS:528:DC%2BD3sXnt1Klsrk%3D&md5=b696e47b8c69667e7debb63fa0c189cbCAS |
[57] M. Araseki, K. Yamamoto, K. Miyashita, Biosci. Biotechnol. Biochem. 2002, 66, 2573.
| Crossref | GoogleScholarGoogle Scholar | 1:CAS:528:DC%2BD3sXht1Gqsg%3D%3D&md5=26aa378f8e6f9b6f0bc2fa93543f773aCAS | 12596850PubMed |
[58] C. Bailly, J. C. Beauvillain, J. L. Bernier, J. P. Henichart, Cancer Res. 1990, 50, 385.
| 1:CAS:528:DyaK3cXmvFGksg%3D%3D&md5=4fbcd3d8ad8bf9142341eb1cf5fee946CAS | 1688511PubMed |
[59] H. Watanabe, A. Kobayashi, T. Yamamoto, S. Suzuki, H. Hayashi, N. Yamazaki, Free Radic. Biol. Med. 1990, 8, 507.
| Crossref | GoogleScholarGoogle Scholar | 1:CAS:528:DyaK3MXkvVOjsrw%3D&md5=a7b7350eecb0ded86c86af31befcb026CAS | 2163349PubMed |
[60] P. Jost, L. J. Libertini, V. C. Hebert, O. H. Griffith, J. Mol. Biol. 1971, 59, 77.
| Crossref | GoogleScholarGoogle Scholar | 1:CAS:528:DyaE3MXkvVChu74%3D&md5=d24b3e6676ebeed772ebceac10f9c871CAS | 4326898PubMed |
[61] D. Man, M. Podolak, G. Engel, Cell. Mol. Biol. Lett. 2006, 11, 56.
| Crossref | GoogleScholarGoogle Scholar | 1:CAS:528:DC%2BD28Xht1OisrzI&md5=f56f580c9b3bb75dccaff8def89ceef0CAS | 16847748PubMed |
[62] G. Facorro, F. Aguirre, L. Florentin, M. Diaz, T. De Paoli, J. E. Ihlo, A. A. Hager, J. C. Sanchez Avalos, H. A. Farach, C. P. Poole Jr, Acta Physiol. Pharmacol. Ther. Latinoam. 1997, 47, 137.
| 1:STN:280:DyaK2svotVGksA%3D%3D&md5=d51af432d81a835d8ad7e9811d534e28CAS | 9339243PubMed |
[63] P. G. Shields, J. Natl. Cancer Inst. 2002, 94, 1435.
| Crossref | GoogleScholarGoogle Scholar | 1:CAS:528:DC%2BD38XosVans7s%3D&md5=69e0de2094ceb57c1d7efe2ddeb28956CAS | 12359853PubMed |
[64] W. MacNee, Chest 2000, 117, 303S.
| Crossref | GoogleScholarGoogle Scholar | 1:CAS:528:DC%2BD3cXjvFSgsr4%3D&md5=de1feeccafef24a2a5d95791c2c2df9bCAS | 10843965PubMed |
[65] R. S. Bruno, M. G. Traber, Pathophysiology 2006, 13, 143.
| Crossref | GoogleScholarGoogle Scholar | 1:CAS:528:DC%2BD28XmslyqtLw%3D&md5=9979d677cc7cb318fd98c308111d6ce1CAS | 16814530PubMed |
[66] M. Malerba, B. Ragnoli, M. Corradi, Monaldi Arch. Chest Dis. 2008, 69, 28.
[67] N. Louhelainen, M. Nyllarniem, I. Rahman, V. L. Kinnula, Int. J. COPD 2008, 3, 585.
| 1:CAS:528:DC%2BD1MXjt1ChtLg%3D&md5=74bad31987cf5dd20d27747f60a4e7f9CAS |
[68] S. E. Hannan, J. O. Harris, N. P. Sheridan, J. M. Patel, Am. Rev. Respir. Dis. 1989, 140, 1668.
| Crossref | GoogleScholarGoogle Scholar | 1:CAS:528:DyaK3cXnt1WhsA%3D%3D&md5=e64d49116d139301cb34015fea440a90CAS | 2604295PubMed |
[69] D. L. Baker, E. S. Krol, N. Jacobsen, D. C. Lieble, Chem. Res. Toxicol. 1999, 12, 535.
| Crossref | GoogleScholarGoogle Scholar | 1:CAS:528:DyaK1MXjtVyisLc%3D&md5=2052dc2cc7f174863bb710d3d06e8f4aCAS | 10368317PubMed |
[70] W. A. Pryor, S. K. Nuggehalli, K. V. Scherer, D. F. Church, Chem. Res. Toxicol. 1990, 3, 2.
| Crossref | GoogleScholarGoogle Scholar | 1:CAS:528:DyaK3cXptlaqsw%3D%3D&md5=56b689e87597c4481a429210d2c8e716CAS | 1966699PubMed |
[71] M. B. Newman, G. W. Arendash, R. D. Shytle, P. C. Bickford, T. Tighe, P. R. Sanberg, Life Sci. 2002, 71, 2807.
| Crossref | GoogleScholarGoogle Scholar | 1:CAS:528:DC%2BD38Xns1SitLk%3D&md5=dbf5e966ed588b6988a951a99f0ac962CAS | 12377264PubMed |
[72] E. Florek, E. Ignatowicz, J. Wrzosek, W. Piekoszewski, Pharmacol. Rep. 2005, 57, 84.
| 1:CAS:528:DC%2BD2MXnsl2qtr0%3D&md5=a7ecf84649dfa869766830d17b73e4d3CAS | 15849381PubMed |
[73] E. Florek, E. Ignatowicz, W. Piekoszewski, Pharmacol. Rep. 2009, 61, 935.
| 1:CAS:528:DC%2BC3cXitFKnu7k%3D&md5=fe0879237d5d9fccf3df6e8ede035280CAS | 19904019PubMed |
[74] B. Zappacosta, S. Persichilli, B. Giardina, P. De Sole, Luminescence 2000, 15, 165.
| Crossref | GoogleScholarGoogle Scholar | 1:STN:280:DC%2BD3czos1SmtA%3D%3D&md5=35cf6287ef7cc5aa0d76740c34eb5ab5CAS | 10862145PubMed |