

The Australian Cotton Industry and four decades of deep drainage research: a review
D. M. Silburn A B D , J. L. Foley A , A. J. W. Biggs A , J. Montgomery C and T. A. Gunawardena AA Department of Natural Resource and Mines, 203 Tor Street, Toowoomba, Qld 4350, Australia.
B National Centre for Engineering in Agriculture, University of Southern Queensland, West Street, Toowoomba, Qld 4350, Australia.
C NSW Department of Primary Industries, PO Box 209, Moree, NSW 2400, Australia.
D Corresponding author. Email: mark.silburn@dnrm.qld.gov.au
Crop and Pasture Science 64(12) 1049-1075 https://doi.org/10.1071/CP13239
Submitted: 5 July 2013 Accepted: 13 November 2013 Published: 18 November 2013
Journal Compilation © CSIRO Publishing 2013 Open Access CC BY-NC-ND
Abstract
The Australian cotton industry and governments have funded research into the deep-drainage component of the soil–water balance for several decades. Cotton is dominantly grown in the northern Murray–Darling and Fitzroy Basins, using furrow irrigation on cracking clays. Previously, it was held that furrow irrigation on cracking clays was inherently efficient and there was little deep drainage. This has been shown to be simplistic and generally incorrect. This paper reviews global and northern Australian deep-drainage studies in irrigation, generally at point- or paddock-scale, and the consequences of deep drainage.
For furrow-irrigated fields in Australia, key findings are as follows. (i) Deep drainage varies considerably depending on soil properties and irrigation management, and is not necessarily ‘very small’. Historically, values of 100–250 mm year–1 were typical, with 3–900 mm year–1 observed, until water shortage in the 2000s and continued research and extension focussed attention on water-use efficiency (WUE). (ii) More recently, values of 50–100 mm year–1 have been observed, with no deep drainage in drier years; these levels are lower than global values. (iii) Optimisation (flow rate, field length, cut-off time) of furrow irrigation can at least halve deep drainage. (iv) Cotton is grown on soils with a wide range in texture, sodicity and structure. (v) Deep drainage is moderately to strongly related to total rainfall plus irrigation, as it is globally. (vi) A leaching fraction, to avoid salt build-up in the soil profile, is only needed for irrigation where more saline water is used. Drainage from rainfall often provides an adequate leaching fraction. (vii) Near-saturated conditions occur for at least 2–6 m under irrigated fields, whereas profiles are dry under native vegetation in the same landscapes. (viii) Deep drainage leachate is typically saline and not a source of good quality groundwater recharge. Large losses of nitrate also occur in deep drainage.
The consequences of deep drainage for groundwater and salinity are different where underlying groundwater can be used for pumping (fresh water, high yield; e.g. Condamine alluvia) and where it cannot (saline water or low yield; e.g. Border Rivers alluvia). Continuing improvements in WUE are needed to ensure long-term sustainability of irrigated cropping industries. Globally there is great potential for increased production using existing water supplies, given deep drainage of 10–25% of water delivered to fields and WUE of <50%. Future research priorities are to further characterise water movement through the unsaturated zone and the consequences of deep drainage.
Additional keywords: cracking clay, deep percolation, Vertosol, water use efficiency, irrigation.
Introduction
Of the 1554 Mha of arable land and permanent crops worldwide, irrigation occurs on some 290 Mha, 18% of global croplands (Scanlon et al. 2007a) or 18.7% (ICID 2009). Of the irrigated area, 44 Mha (15.2%) is sprinkler and micro-irrigated (ICID 2009). Most of the remaining area of 246 Mha (~85%) is surface-irrigated, whereby the water is spread over the field by gravity, including furrow and related irrigation methods. Globally, the area of irrigated land more than doubled between 1950 and 2000 (increase of 2.8 times) and global withdrawals of water increased 2.7 times between 1950 and 1995 (Scanlon et al. 2007a). Irrigated agriculture has significant impacts on water resources because it withdraws an average of 80% of global freshwater (Scanlon et al. 2007a). Irrigation is responsible for a large proportion of food production (~40%; Scanlon et al. 2007a) and fibre production, but most studies indicate low efficiencies as a proportion of extractions and of delivery to fields, both globally (Bos and Nugteren 1990) and in the Australian cotton industry (Tennakoon and Milroy 2003; Roth et al. 2013). The main losses are from evaporation from farm storages (where they are used), followed by in-field deep drainage (Roth et al. 2013). This is both a problem, as the losses cause the main degradation issues resulting from irrigation (Jensen et al. 1990; Duncan et al. 2008), and an opportunity, because the water is already owned by or allocated to the irrigation scheme or land owner/irrigator. Thus, it is a ‘free’ source of extra water if efficiency can be improved and the water reallocated to productive uses.
Deep drainage (or deep percolation) is water that infiltrates below the root-zone. Some may eventually reach the groundwater and is then called recharge (Walker et al. 2002). Deep drainage is a loss to the production of crops, reduces water-use efficiency (WUE), and may lead to rising groundwater and salinity where the regolith or groundwater contains excessive salts; it can also be a source of recharge for groundwater. Deep drainage has been studied for over four decades in the Australian cotton industry. However, for much of that time there was a lack of consensus on the extent and occurrence of deep drainage and on the methods for measuring it (Hearn 1998). The cotton industry occurs largely within the northern Murray–Darling Basin and the Fitzroy Basin, where cotton is mostly irrigated by surface application (furrow irrigation) on low sloping plains and is grown on a wide range of soils, but predominantly on cracking clays. Deep drainage was assumed to be minimal due to the low permeability of these clay soils, although some of the earliest field studies did not support this view.
The water balance of the crop root-zone can be represented as:

or

where water inputs are rainfall (R) and irrigation (I); outputs are deep drainage (D), runoff (Ro), and evapotranspiration (ET); and S is the change in soil water storage in the root-zone. Thus, D is expected to increase with increasing I + R if not compensated by losses to ET and R, and storage S is exceeded. This is a simple conceptual framework, i.e. D plotted against R+I, which we use to compare various data.
Deep drainage and poor WUE are issues for irrigation globally. For millennia, irrigation has eventually led to the dual problems of salinisation and water logging (Jensen et al. 1990). These are directly related to excessive losses of water from distribution systems, storages and from fields, causing groundwater to rise and adding salts to the soil. Jensen et al. (1990) gave two examples: the world’s largest contiguous irrigated area in the Indus Plain, Pakistan, where the groundwater table reached the surface in the early 1960s and ~10 Mha of cultivatable land was waterlogged (see also Smedema 2000); and the Central Valley of California, where problems occurred soon after irrigation began in the 1870s and extensive areas were abandoned because of salinity and alkalinity problems. The solutions implemented to remediate these problems also created new problems. In the Indus Plain, installation of many private tube wells to pump groundwater for irrigation increased the area cropped and lowered the watertable, but the groundwater is now at its maximum exploitable potential (Ahmad et al. 2002). Drainage works were used to control the watertable in the Californian Central Valley. However, this led to pollution problems in a wetland (Kesterson Reservoir) used for disposal of the drainage water, due to high levels of selenium, and farmers were required to greatly improve irrigation management. Thus, constructing drainage systems or pumping groundwater does not deal with the core problem, which is excessive input of water into the system and the need for WUE.
Catchment salt balances are an indicator of the state of hydrologic change in a catchment (Jolly et al. 2001; Silburn et al. 2008); e.g. after a change such as major land clearing or irrigation development. Catchment salt balances can indicate whether the excess deep drainage is returning to streams. The catchments draining four of the five largest irrigation developments in arid climates—the Aral Sea, the Colorado, Murray–Darling and the Nile—are net exporters of salt, whereas the Indus is storing salt (Smedema 2000). In catchments in the northern Murray–Darling Basin where cotton is grown, catchment salt balances are close to equilibrium, i.e. salt input = salt output (Jolly et al. 2001; Biggs et al. 2013). This may be due to the effect of large diversions of water and salt, which result in temporary storage of large amounts of salt that may have otherwise contributed to salt export, and a ‘zero’ tail-water release policy, rather than actively releasing water via drainage schemes. However, as natural catchments in this region are storing salt (output/input <1; Biggs et al. 2013), these current salt balances may indicate an increased export relative to the natural state. If and when any of these catchments start to significantly export salts, through groundwater discharge to streams or surface wash-off, the salt balances will start to show outputs greater than inputs.
In this paper, we review current knowledge of deep-drainage rates in irrigated cropping areas in northern Australia and globally, particularly where Vertosols (cracking clays; Isbell 2002) occur, and discuss the consequences with examples from southern inland Queensland. Deep drainage has been determined using most available methods, but assessments are generally at point- or paddock-scale. Some context is provided with deep-drainage rates under native vegetation and rain-fed cropping. We include studies published in technical and project reports that may not be widely available and provide some contextual details for each study. We do not review or compare the different methods for measuring or modelling deep drainage, although some comparisons are made in references cited and in the tabulation of data.
Characteristics of irrigated cotton growing areas in Australia
The major cotton-production areas in Australia span from inland central Queensland to southern New South Wales, ranging from 160 000 to 580 000 ha in the 5 years to 2012–13 (Roth et al. 2013). The cropped area declined in 2002–03 due to the ‘Millennium drought’ (2002–10) but was back >550 000 ha in 2010–11 (4–5 million bales), with major floods in 2011–13. Over the 10 years to 2012–13, 83% of the area was irrigated, predominantly by flood irrigation in furrows. The average irrigation application rate was 7 ML/ha.year in 1988–94 (Hearn 1998) and 5.2 ML/ha.year in 2010–11 (Australian Bureau of Statistics 2012). The Australian cotton industry contributes around AU$2.5 billion to the Australian economy, is vital for the prosperity of many regional communities, and contributes to viability of infrastructure (transport, agribusiness, services, etc.) used by them. The industry has the highest average cotton yields in the world (2.5 times world average), the highest water productivity, which increased by 40% from 2002 to 2012 (Trindall et al. 2012), and the lowest use of insecticides (Pyke 2007).
Approximately 70% of Australia’s cotton is grown in New South Wales (NSW) and the remainder in Queensland (Roth 2006). In Queensland, cotton is grown mostly in the south in the Darling Downs (Condamine catchment), St George and Dirranbandi (Lower Balonne-Culgoa), and Macintyre Valley (Border and Weir Rivers) regions (Fig. 1). The rest is grown near Emerald, Theodore and Biloela in Central Queensland. In NSW, the growing area stretches south from the Macintyre River (Border Rivers) on the Queensland border and covers the Gwydir, Namoi and Macquarie Valleys. Cotton is also grown along the Barwon and Darling Rivers in the west and the Lachlan and Murrumbidgee Rivers in the south. Inland irrigation of grain and oilseed crops is also concentrated in these areas, with cotton growers also growing these crops.

|
The northern cotton-growing areas (Queensland) experience a subtropical to tropical, semi-arid climatic regime (550–700 mm average annual rainfall), whereas the southern growing areas are temperate and semi-arid to arid (350–550 mm average annual rainfall). Rainfall is highly variable. The proportion of summer rainfall decreases from ~70% in the north to 50% in the south, and cotton growing in southern areas is significantly limited by climatic factors such as temperature and length of growing season. Potential evaporation varies from 1500 mm/year in the east to >2500 mm/year in the west, and is in excess of rainfall in all months on average (Yee Yet and Silburn 2003).
The higher yielding production areas are all irrigated, but in favourable years, extensive rainfed plantings occur in Queensland. Availability of water is more limiting than availability of suitable land. Water use efficiency became important during the drought of the 2000s and after water extraction was capped. The majority of growing areas are dominated by Vertosols on alluvial plains, but in some areas, such the Macquarie Valley and Emerald area, crops are also grown on texture-contrast soils and lighter textured, non-cracking clays on either alluvia or low gradient hillslopes with in-situ derived (e.g. basalt) soils (Emerald). Original native vegetation was typically open woodland to woodland. In alluvial areas, the unsaturated zone is typically clay over ‘fining up’ sequences of sand at some meters depth. There are large accumulations of salt in most soils and in the unsaturated zone, similar to those in other semi-arid lands (Scanlon et al. 2007b; Kurtzman and Scanlon 2011).
Groundwater either tends to be of good quality and used as an irrigation water supply, e.g. Condamine alluvia (Dafny and Silburn 2013) and Namoi alluvia (Kelly et al. 2013), although upper aquifers can be more saline, or is saline (Border Rivers, Lower Balonne alluvia; Biggs et al. 2005, 2006). Some areas of salinised soils have occurred in areas using poorer quality water (i.e. groundwater; Brough et al. 2008). Salinity caused by rising groundwater within or surrounding irrigation areas is the most common irrigation salinity process in Queensland (Brough et al. 2008). Groundwater levels are typically rising or have risen to a shallow depth (<3 m) in and around many irrigated areas (not just irrigated cotton lands) throughout Queensland (e.g. Border Rivers, St. George and Emerald irrigation areas), except where groundwater is used as a source of irrigation supply. In these areas, groundwater levels tend to be steady or falling due to pumping at a rate greater then recharge, e.g. Condamine alluvia (Dafny and Silburn 2013) and Namoi alluvia (Kelly et al. 2013). However, in most cotton-growing areas, major salinity problems due to salt addition or rising groundwater have not occurred and shallow groundwater and seepage discharge is not yet an issue, although areas of concern are emerging.
Issue of deep drainage and ‘clay soils don’t drain’
The issues of deep drainage and water balances in irrigated cotton, and the anticipated effects, were discussed widely at a series of workshops in Australia from 1999 to 2003 and at numerous conferences. Knowledge of the runoff component (and soil erosion) was reviewed by Silburn et al. (1997, 1998). The 1999 workshop revealed a lack of consensus on deep drainage (its measurement, modelling, existence or extent) and water balance for irrigated clay soils (CRDC and ACCRC 1999). Available, limited data (e.g. Shaw and Yule 1978; Thorburn et al. 1990; Willis and Black 1996; Willis et al. 1997; Connolly et al. 1998, 1999) appeared to conflict with the long-held view that ‘clay soils don’t drain’ (e.g. Lane 1979; Hearn 1998) and that furrow irrigation on cracking clays is inherently efficient or self-regulating (Farbrother 1972, cited by Hearn 1998). Note that the deep-drainage studies indicated above were all from studies at Emerald, Biloela, the Lockyer and the Macquarie, i.e. not from the ‘core’ cotton-growing areas (Condamine, Border Rivers, Lower Balonne, Gwydir, Namoi), and, thus, may have been be perceived as unrepresentative of the wider industry.
In the next 5 years, a series of studies of deep drainage under irrigation on clay soils also found considerable deep drainage in ‘core’ cotton-growing areas (Hulugalle and Weaver 2000; Zischke and Gordon 2000; Dalton et al. 2001; Moss et al. 2001; Weaver et al. 2002; Dalton 2003; Montgomery 2003; McHugh 2003), and the cotton industry determined that WUE of irrigation was poor (Tennakoon and Milroy 2003). A ‘Rural Water Use Efficiency’ extension program (Goyne and McIntyre 2003) was also running in response to the Millennium drought, with the mantra ‘you can’t manage it if you aren’t measuring it’. Simultaneously, deep-drainage understanding had advanced greatly in rain-fed land uses (cropping, pastures and native vegetation) on clay soils (Abbs and Littleboy 1998; Young and McLeod 2001; Keating et al. 2002; Tolmie and Silburn 2002, 2003; Tolmie et al. 2003; Ringrose-Voase et al. 2003; Yee Yet and Silburn 2003). Logically, if drainage was up to, say, 40 mm/year for rainfed cropping, it would be higher for irrigated cropping and much higher where rainfall plus irrigation was several hundred mm greater than potential crop water use (Tennakoon and Milroy 2003; Silburn and Montgomery 2004).
Indeed by 2000, Hearn (2000) had noted that: ‘a mounting body of evidence is challenging the conventional wisdom on drainage. Are these observations from a few aberrant sites, or is deep drainage much more significant and prevalent than believed?’
Raine and Foley (2001) explained the ‘clay soils don’t drain’ story as follows: ‘This major industry misconception arose from research during the 1980s which only looked at a limited number of soils in select areas using relatively short furrow lengths. The soils investigated may also have been structurally degraded due to compaction induced by the cultural practices of the period’, i.e. causing reduced infiltration, and by association, reduced deep drainage.
The issue culminated in the workshop entitled ‘Deep Drainage—so what?’ organised by the then Australian Cotton Cooperative Research Centre (more recently Cotton Catchment Communities CRC) in 2003 and reported by Silburn et al. (2004), and the release of WATERpak (Dugdale et al. 2004). This included a review of deep-drainage knowledge in Australian cotton-growing areas for the period up to ~2003 by Silburn and Montgomery (2004). They concluded that: ‘deep drainage varies considerably depending on soil properties and irrigation management, and is not necessarily ‘very small’. Drainage of 100 to 200 mm/year (1–2 ML/ha) is typical, although 3 to 900 mm/year (0.03 to 9 ML/ha) has been observed.’
This review updates knowledge advances since then, including deep drainage under irrigation globally, particularly, but not exclusively, where Vertosols occur. Given the large amount of publicity regarding deep drainage losses in the Australian cotton industry leading up to 2004, the release of WATERpak, cotton industry and Rural Water Use Efficiency efforts (Roth et al. 2013), and the water shortage during the extended Millennium drought, a comparison is made of the deep-drainage rates before and after ~2004.
Irrigation and farm water use efficiency
Bos and Nugteren (1990), in a global survey of data on irrigation efficiencies, reported field application efficiency values ranging from 17% to 88%. The higher values are for drip and sprinkler irrigation systems, whereas the application efficiencies of surface irrigation systems in developing countries are reported to be, on average, ≤40%. An example of these inefficiencies is provided in Uzbekistan, Central Asia (Reddy et al. 2013), where irrigation supply systems are reasonably unsophisticated, farms/fields are small, and management is less than optimal. Total irrigated area in Uzbekistan is close to 4 Mha (Reddy et al. 2013). By 1994, almost 50% of the total irrigated area was affected by waterlogging and salinity, as a result of excessive seepage and losses from the canal networks and fields and poor performance of drainage systems. Cotton and winter wheat are the main crops, all grown with furrow irrigation, theoretically using 4–7 ML/ha per cotton season.
In a study of 46 irrigation events at nine fields (loamy sands to sandy clay loams), average runoff volume was 39% of the total volume of water applied (whether this is reused is not clear), indicating problems with selection of appropriate furrow flow rates and durations (Reddy et al. 2013). There was often a large mismatch between the volume of water applied and the volume of water deficit within the crop root-zone. Measured application rates were 4–11.6 ML/ha, averaging 7.4 ML/ha. Average application efficiency was 49% (compared with the soil water deficit), ranging from 7 to 82%. Inefficiencies were, in part, related to unreliable (and unknown) magnitude and duration of flow rate delivered to the fields, slope >0.5% at seven of the nine sites, and light-textured but variable soils.
The Australian cotton industry—water use efficiency
In the Australian cotton industry, the improvement in WUE reported by Trindall et al. (2012) was driven by the Millennium drought, a national agenda for water reform, and enabled by large research, development and extension efforts. Average irrigation application was 5 ML/ha in 2009–10 (Harris 2012), although these were wetter years and the value may not apply in all years, down from ~7 ML/ha in previous years (e.g. ~1996–99; Tennakoon and Milroy 2003). Tennakoon and Milroy (2003) evaluated irrigation input (to the farm, i.e. greater than irrigation applied to fields), evapotranspiration (ET), and efficiency on 20 farms and including 200 fields for 1996–99. Irrigation efficiency was calculated as the proportion of irrigation water input to the farm for cotton production that was used by the crop as ET (after subtracting rainfall and change in soil water) over the growing season. Crop WUE was calculated as lint production per unit of ET. Average irrigation and total inputs were 7 and 12 ML/ha, with ET of 7.35 ML/ha; thus, on average there was an excess of 4.65 ML/ha (465 mm), which can be losses in storage and transmission or in-field (deep drainage and runoff). The average irrigation efficiency was 57%, with a large variation between farms, somewhat above the global average. The wide variation in efficiency was suggested to indicate significant scope for many producers to increase their efficiency.
When a similar survey was conducted in 2006–11 on 30 farms, Montgomery and Wigginton (2012) found the crop water use (ET) was 63% of total water input (water harvested + rainfall). Irrigation water use index or bales of cotton per ML (irrigation + rainfall + change in soil water) had improved from 0.79 to 1.10 (range 0.64–1.71), a 40% improvement, based on 108 farms. The losses of total input (38%) were also divided between on-farm storages (25%), in-field (11.4%), channels (0.5%) and drains (<0.7%), but there was large variability between farms. Raine and Foley (2002) found from farmer surveys that irrigation water use index was 0.6–1.6 bales/ML irrigation for furrow irrigation, 1.5–2.75 for subsurface drip irrigation, and 1.35–2.6 for centre-pivot–lateral move (CPLM) irrigation, with averages of 1.0, 2.4, and 1.9, respectively. The irrigation water use index reported for furrow irrigation is less than the 1.26 bales/ML obtained by Tennakoon and Milroy (2003). Many more studies of WUE in Australia and globally are reviewed by Payero and Harris (2007).
Wigginton (2012) led a program of measurement of evaporation and seepage from 136 on-farm storages. Losses were divided to show that the large loss from on-farm storages is dominated by evaporation. The minority of storages with seepage losses could be ameliorated with engineering solutions. The cost of saving water using either storage cell division or increased wall height strategies (i.e. increasing storage depth and reducing area) was reasonable, with an average cost ~AU$150/ML.year. The cost was as low as $15/ML.year for cell division and $59/ML.year for wall height increase. The cost of water saved was often reasonably attractive compared with the typical value of water available from temporary transfer markets, but the capital cost of increasing wall heights was high. However, not all cotton farms use storages or have other sources of water; thus, the conclusions here differ somewhat from those presented for a broader segment of the irrigation industry presented below.
Baillie et al. (2007) conducted a survey of crops grown and irrigation systems used, drivers for private investment in WUE, the economics of investments in irrigation improvements, and future research needs and knowledge gaps, in the Northern Murray–Darling Basin, which covers most of the cotton industry excluding areas south of the Macquarie and in the Fitzroy (Fig. 1). They identified significant opportunities for improved on-farm WUE. Whereas 90% of cotton was irrigated using surface (furrow) irrigation, the area converted to drip irrigation, and particularly CPLM, was increasing. This change has continued since this survey. A total of 1480 GL of potential WUE gains (100% adoption) was identified. However, a significant proportion of these gains cannot yet be realised and further research and development of commercially applicable technologies is required. Losses were split between 48% from storages (mainly evaporation), 45% in-field, and 7% from distribution systems. However, the largest WUE gains in most valleys would be achieved through addressing in-field application efficiency; whereas the Condamine–Balonne was dominated by losses from storages, due to their prevalence.
Review of deep drainage—deep drainage for native vegetation and rainfed (dryland) cropping
To understand the consequences of deep drainage from irrigation, an understanding of deep drainage under native vegetation and rainfed (dryland) agriculture, the ‘baseline conditions’, is useful. There is now a reasonably good understanding of deep drainage under native vegetation and rainfed agriculture in several areas of relevance to the Australian cotton industry: (i) the Northern Murray–Darling and Fitzroy Basins, from measurements (Radford et al. 2009; Silburn et al. 2009, 2011; Tolmie et al. 2011; Young et al. in press) and modelling (Abbs and Littleboy 1998; Ringrose-Voase et al. 2003; Yee Yet and Silburn 2003; Silburn et al. 2007; Robinson et al. 2010); (ii) the Texas High Plains (McMahon et al. 2003; Scanlon et al. 2005, 2007b, 2010a); and (iii) Vertisols in Israel (Kurtzman and Scanlon 2011). General conclusions from these studies, supported by measured or modelled deep drainage and unsaturated zone moisture and solute profiles, include:
-
Deep drainage is greatest in summer rainfall zones for cropping (winter > summer > opportunity cropping), less for perennial pastures, and least for native perennial, evergreen vegetation (all measurement and modelling papers cited address this issue).
-
Within each land use, deep drainage increases with increasing average annual rainfall and with decreasing soil water-holding capacity (Yee Yet and Silburn 2003; Radford et al. 2009; Tolmie et al. 2011).
-
Deep drainage is highly variable over time (all modelling papers).
-
The unsaturated zone under native vegetation is typically dry (e.g. at or below wilting point) to considerable depths (e.g. 6–10 m), which provides a large buffer for storage of deep drainage from more leaky land uses (Scanlon et al. 2005; Radford et al. 2009; Silburn et al. 2009, 2011; Foley et al. 2010; Kurtzman and Scanlon 2011).
-
Large amounts of chloride (and other salts) are stored in soil and unsaturated zone profiles under native vegetation in semi-arid to arid landscapes, and this is leached downwards after a change to land uses with higher deep drainage rates (all measurement and modelling papers addressing this issue).
-
The salinity of this leachate is typically high and generally much higher than underlying groundwaters, unless they are already saline (all measurement papers addressing this issue).
Deep drainage under irrigation
Global studies
China, India, Israel, Pakistan and Uzbekistan
Ahmad et al. (2002) determined deep drainage of 294 mm/year (22% of rainfall plus irrigation, R + I) for border irrigation, wheat–rice double cropping in the Indus Basin Irrigation System, Pakistan, and 197 mm/year (17% of R + I) for cotton–wheat double cropping (Table 1, Fig. 2) (using a calibrated water balance model). Somewhat larger values were reported for annual simulations (389 and 233 mm/year). Reddy et al. (2013) did not report deep drainage for irrigation (mainly cotton and winter wheat) in the Fergana Valley of Uzbekistan. However, as average irrigation efficiency was 48% and average runoff was 38% of volume applied (average 744 mm/year), it is likely that deep drainage was up to 14% of water applied, i.e. 104 mm/year. Some deep drainage is consistent with the depth to watertable being 0.37–3.5 m for the fields studied.

|
|
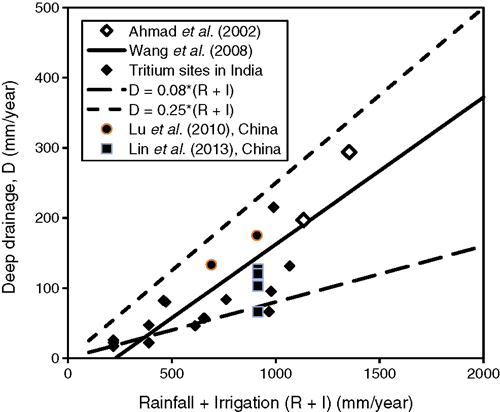
Deep drainage was estimated in the North China Plain (or Hebei Plain) by calibrated water balance modelling of irrigated wheat–maize rotations (Kendy et al. 2003, 2004) and by applied tritium and bromide tracers (Wang et al. 2008) (Table 1, Fig. 2). Kendy et al. (2003) gave deep-drainage rates (loam soils, for 3 years) of 36–209 mm/year, averaging 117 ± 46 mm/year. This is 8–25% of R + I (420–850 mm/year), averaging 17% ± 4.5%. Kendy et al. (2004) modelled a longer period and derived the relationship: D = (R + I) – 660. Deep drainage varied annually from 50 to 1090 mm/year. However, this analysis does not seem to make physical sense, as ET was ~660 mm/year whether R + I was 800 or 2000 mm/year, due to assumptions made, and the equation given is much steeper (not shown) than other data in Fig. 2. Wang et al. (2008) measured deep drainage over specific time periods of ~2 years in mm per day using the aforementioned tracers. Assuming these apply for 365 days per year, annual values are 80–117 mm/year for non-irrigated, non-crop land, 62–84 for sprinkler irrigation, and 153–212 for furrow irrigation. Deep drainage was higher for non-irrigated, non-crop land than for sprinkler irrigation, because the former was poorly vegetated. They found deep drainage of D = 0.21 (P + I) – 47.75, where D is groundwater recharge (deep drainage) (mm), P is precipitation (mm), and I is irrigation (mm) over the time interval considered (r = 0.74), which is reproduced in Fig. 2. Such relationships were also found by Kendy et al. (2003) in China and in India (table 7 in Wang et al. 2008; Table 1, Fig. 2) and the USA (Scanlon et al. 2005). Lu et al. (2011) found deep drainage of 133–175 for five sites on the Hebei Plain (15–25% of R + I) (Table 1), similar to other estimates. Lin et al. (2013) measured deep drainage for four irrigated sites in the western North China Plain, using chloride (Cl) steady-state mass balance, of 66–127 mm/year, or 11–17% of R + I (Table 1, Fig. 2). Lin et al. (2013) refer to other published deep-drainage/recharge estimates in China, which are not reviewed here. Figure 2 shows that the various deep-drainage estimates from Asia cover a reasonably consistent range, and that total water input explains some of the deep drainage.
Kurtzman and Scanlon (2011) modelled deep drainage under irrigated cropland on Vertisols in Israel at 90–230 mm/year, compared with 1–3 mm/year for natural ecosystems, and consistent with steady-state, mass-balance estimates of 90–190 mm/year and groundwater-balance estimates of average recharge of 110–160 mm/year. This is also consistent with Fig. 2 for R + I of a little under 1000 mm/year. The travel time for Cl to move down 9 m in the unsaturated zone averaged 11 years. Soil profiles under irrigated cropland were often wetter than those under rainfed or natural lands with similar soil texture, as also seen in the USA High Plains (Scanlon et al. 2005, 2010b; McMahon et al. 2006; Gurdak et al. 2009) and Australian cotton-growing areas (Shaw and Yule 1978; Foley et al. 2010, 2012; Kelly et al. 2011). The Kurtzman and Scanlon (2011) study, on Vertisols, illustrates that heavy clay soils and lower rainfall (although Mediterranean rather than semi-arid climate) are no impediment to deep drainage occurring under irrigation.
USA deep drainage rates
Roack and Healy (1998), in two fields in one year in New Mexico, measured deep drainage by three methods and obtained reasonably consistently high deep drainage for border flood irrigation of lucerne (alfalfa) of 164–816 mm/year, 223–316 mm/year, and 150–380 mm/year, all 13–43% of the water input (Table 2). Higher deep drainage is again associated with the higher water inputs (i.e. site 2 with ~1700 mm of irrigation). Although this study is not on heavy clay soils, it is in a semi-arid environment, and shows that irrigation, and especially over-irrigation, causes large deep drainage losses. This conclusion also applies to the study by Scanlon et al. (2005), in semi-arid Nevada, using sprinkler irrigation and lucerne, both considered more efficient (e.g. than furrow irrigation and less perennial cropping), low deep-drainage systems, where deep drainage of 10–14% of water input was determined.

|
Dugan and Zelt (2000), as reported by Sophocleous (2005), estimated deep drainage for irrigated cropping of 75–119 mm/year in higher rainfall Nebraska and 21–45 mm/year in drier Colorado, and much lower rates for lucerne (Table 2). McMahon et al. (2003) estimated deep drainage of ~55 mm/year or more (depending on assumptions, using two methods) for a period of ~30+ years of furrow irrigation in the central High Plains, and 4–12 times drainage rates under rangelands (Table 2).
Deep drainage rates measured in the south-western USA range from 19 to 485 mm/year or 2–19% of rainfall plus irrigation applied (Scanlon et al. 2005) (Table 2). Scanlon et al. (2005) found a strong linearly increasing relationship between total R + I and average deep drainage rates (R2 = 0.94) using data from four studies in the south-western USA (Fig. 3; labelled ‘USA arid/semi’). The intercept approached zero deep drainage at just under 850 mm of R + I and increased to 500 mm of deep drainage at just under 3000 mm of R + I. This contrasts with the relationships from China and India (Fig. 3), due to the lower rainfall inputs and higher evaporation. The USA deep-drainage–total input line is displaced to the right, so that more irrigation is needed to instigate deep drainage but the slope is similar to the 25% of input line.

|
McMahon et al. (2006) measured deep drainage increasing from north to south in the High Plains, apparently due to increasing irrigation inputs (Table 2). Average deep drainage was 59 mm/year and the highest values were ~105 mm/year in the southern High Plains. These deep drainage rates were considerably higher than under rangeland.
In the Texas (southern) High Plains (Scanlon et al. 2010a), the ranges in R + I and deep-drainage rates were limited, with no relationship (Table 2, Fig. 3). There was a general similarity in the range of deep-drainage rates beneath rainfed and irrigated agroecosystems, despite the additional water inputs in irrigated areas. This was attributed partly to (i) deficit irrigation practices, (ii) higher crop yields and (iii) higher ET rates with irrigation, and (iv) irrigation applications (300 mm/year) well below that required for optimal crop yield (580 mm/year), for irrigated relative to rainfed agroecosystems. By contrast, where much higher application rates were used in Nevada (Scanlon et al. 2005) and New Mexico (Roack and Healy 1998), deep drainage rates were also much higher. In summary, (a) deep drainage in the USA is considerably greater for irrigated sites than rangeland or rainfed agriculture; (b) considerable salt has been leached downward in irrigated profiles (Scanlon et al. 2010b); and (c) total water additions (R + I) (Fig. 3) and climatic factors are important in determining deep drainage in irrigated farming systems.
Consequences of deep drainage
The Indus basin irrigation system of Pakistan is one of the largest contiguous surface irrigation systems in the world (Ahmad et al. 2002). Losses from earthen channels and irrigated fields resulted in rising groundwater in some areas, leading to waterlogging and salinisation in parts of the Indus Plain (Smedema 2000). According to Ahmad et al. (2002): ‘The first symptoms of the problem appeared in the first half of the twentieth century, but the problem reached alarming proportions in the period between 1950 and 1960. To combat this menace, the government of Pakistan took several measures and encouraged the farming community, through tax reduction and other subsidies, to install private tubewells to pump groundwater for irrigation.’ However, the resulting development of groundwater has reached a point where over-extraction of groundwater is occurring. This highlights a common theme seen in Pakistan, China and the US High Plains—groundwater extraction for irrigation can sometimes be used to manage the rising groundwater associated with irrigation, but focusing on better quality aquifers leads to their depletion.
In the USA, higher recharge (deep drainage arriving at the watertable) was generally associated with increased salinity in groundwater, due to flushing of salts from the unsaturated zone, or accumulation of salts in the unsaturated zone in areas where irrigation is more efficient (Scanlon et al. 2010b). Estimated travel times to the watertable ranged from 9 to 46 years at the arid Nevada sites, to 132–373 years at the Texas High Plain site (watertables ~35+ m deep). In the Southern High Plains, median total dissolved salts in groundwater increased by 34% and 31% under irrigated and rainfed areas, respectively (Scanlon et al. 2005). Median groundwater nitrate-N concentrations increased by 221% beneath irrigated areas and 163% beneath rainfed areas, reflecting land-use change induced contamination of groundwater. Scanlon et al. (2005) found increases in soil and groundwater salinisation with increased irrigation efficiency: ‘Degradation of groundwater quality caused by irrigation will not be readily reversed by changes from irrigated to dryland or rangeland settings.’ Thus, there is much more to be done to manage both the water and salt balances of large-scale irrigation developments.
Australian deep drainage studies relevant to the cotton industry
Emerald Irrigation Area (1973–1974) (Shaw and Yule 1978)
Shaw and Yule (1978) used two indicators of deep drainage in their study of soil water-holding capacity, ponded infiltration rates and irrigation water requirements during development of the Emerald Irrigation Area (EIA). These were change in soil moisture content below the root-zone and changes in soil Cl profiles, which indicate that leaching had occurred. Soils were Vertosols of basaltic, alluvial and Tertiary sedimentary origin and Sodosols of alluvial origin, and had clay content ranging from 30 to 70%. Cation exchange capacity (CEC) ranged from low (12 cmol(+)/kg) to high (75 cmol(+)/kg) and exchangeable sodium percentage (ESP) from 1 to 26. Infiltration rates (during 36–72 h ponding) were 2–21 mm/day. Shaw and Yule (1978) noted: ‘All soils showed water movement below the root zone and in some sites, quite high water movement occurred’, and ‘Significant drainage and substantial leaching of chloride occurred under prolonged ponding’.
Subsequently, the EIA suffered from localised water logging and salinity, due to groundwater rise into the root-zone in areas of poor lateral discharge (Yule 1997). This was managed successfully using tile and surface drainage, but at a cost greater than the land was worth (Yule 1997). The EIA is small enough and the flow in the Nogoa River (where the drainage water is discharged) is large enough that the export of the drained salt is not problematic for river salinity. Gardner and Coughlan (1982) conducted similar studies in the Burdekin Irrigation Area in North Queensland, with generally similar results. This area also has shallow watertables under extensive areas, due to excessive deep drainage, and also zones of seawater intrusion due to excessive groundwater extraction (Brough et al. 2008).
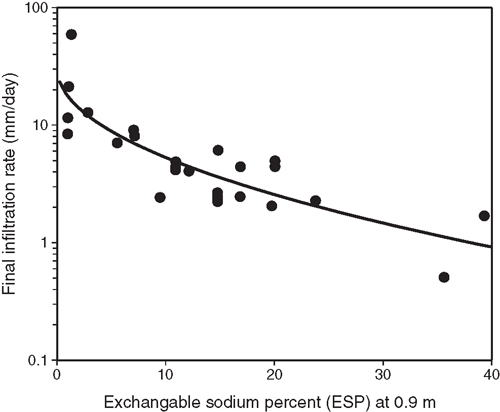
Final infiltration rates for soils used for irrigation
Shaw (1995) synthesised the results from Shaw and Yule (1978) and Gardner and Coughlan (1982). Final infiltration rate (FIR; at 3–7 days’ ponding) had a good relationship with ESP at 0.9 m depth (Fig. 4). The range in FIR is from 1 to 23 mm/day (ignoring high and low outliers). The value of 1 mm/day at high ESP is consistent with the value of 1 mm/day measured by Mason et al. (1980). (While these also seem to be low rates of infiltration, an interpretation of what they mean for annual deep drainage rates is given below.) For Black Vertosol soils in Queensland, Foley et al. (2006) reported near-saturated hydraulic conductivity (Ksat) of 0.3–2 mm/h (7–48 mm/day) for shallow plough pans (annual cropping and lucerne leys, controlled traffic, minimum tillage), and 8–25 mm/h (192–600 mm/day) under grass pasture. The cropping and ley values span a similar range to the Shaw (1995) FIR values. (The lower permeability of the cropped site compared with pasture sites is probably indicative of structural degradation in the cropped soils.)
|
Interpretation of soil infiltration or hydraulic conductivity rates for determining deep drainage has apparently been problematic. For example, see discussion in Smith (2008) of early ideas that clays in the Ord River Irrigation Area were suitable for rice production (i.e. would not lead to excessive deep drainage): ‘Chapman (1984) also pointed out the contradiction that the infiltration rates measured in the previous studies were still significant at the conclusion of the infiltration tests, even though there was no evidence of moisture change below a depth of around 1.5 m’ Smith (2008).
When estimating deep drainage rates, the final infiltration rate is only one part of the answer. The number of days that the profile is draining at this rate must also be estimated. Although a small soil core may equilibrate to drained upper limit in 2 or 3 days, a soil profile will continue to drain for many days after saturation (e.g. 16 and 30 days after irrigation, Gardner 1988; 16 days, Moss et al. 2001). Infiltration rates or hydraulic conductivities by themselves are insufficient for estimating deep drainage without understanding the duration of drainage and the hydraulic gradient operating after a wetting event (See below: Understanding flow processes in clay soils).
Condamine alluvia (Lane 1979)
Lane (1979) investigated the sources of recharge for the Condamine alluvial aquifers—a large plain in southern Queensland dominated by Vertosols (Dafny and Silburn 2013)—including diffuse recharge by rainfall and irrigation (deep drainage) and various means of artificial recharge. This included measurements of the depth to drier soil after 756 mm of rainfall over ~3 months (the wettest 3 months on record), and surface inundation for much of this time (13 sites) and infiltration measurements in seven natural depressions inundated for ~3 months. It was found that the water penetrated only to shallow depths (~1–2.5 m) and it was concluded that infiltration of rainfall would not reach the aquifer. Diffuse recharge on the clay soils was excluded as a source of recharge for the aquifers ≥20 m below the surface. That is, deep drainage from rainfall and irrigation were considered negligible. Lane (1979) also determined that the final infiltration rate was ~6 mm/day in the natural depressions, which was used for calculating recharge from the Condamine River, but not deep drainage.
More recent investigations, e.g. rainfed cropping and pasture (Silburn et al. 2011; Tolmie et al. 2011) and irrigated cropping (Zischke and Gordon 2000; Foley et al. 2010; Gunawardena et al. 2011; described below), have shown that Lane’s conclusions were incorrect—soil and unsaturated zone profiles in the same area have wet to large depths. While Lane’s reasoning may suit investigations on rigid soils, it cannot be applied to cracking clays. Prolonged rainfall and flooding resulted in poor infiltration depths because the surface soil swelled, pore spaces closed and soil conductivity declined to very low rates (Foley et al. 2006), whereas periodic rainfall and furrow irrigation events result in deep wetting of clay profiles and in deep drainage.
Australian Cotton Research Institute irrigation trials—Narrabri and related sites
Mason et al. (1980) irrigated two soybean varieties with two irrigation frequencies (90 and 135 mm deficits) for 3 years, on a sodic grey cracking clay at the Australian Cotton Research Institute (ACRI). Soil water loss (deep drainage below 1.5 m) was measured from bare soil under plastic for 12 days after irrigation. The average rate of water loss was 1.3 mm/day or ~1.0 mm/day after accounting for lateral losses or ~10 mm per irrigation. The frequently irrigated crops received ~four or five irrigations plus a pre-irrigation. Thus, a rough estimate of total deep drainage is 50 mm (5 irrigations × 10 mm) or ~6% of total water supplied (ET plus runoff). This estimate is similar to the Darcian flux measurements on another block on the same research station at Narrabri by Montgomery (2003) and estimates by Weaver et al. (2005) and Hulugalle et al. (2010).
Both Chan and Hodgson (1981) in the Namoi Valley and Hulme et al. (1991) in the Macquarie Valley found that furrow irrigation water did not infiltrate into sodic soils beyond 0.8 m, even in soil at permanent wilting point to a depth of 1.5 m before irrigation. This has been used as evidence for a lack of deep drainage. However, Chan and Hodgson (1981) also show full soil water profiles 3 weeks after a pre-irrigation and following a winter fallow, and Hulme et al. (1991) show a reasonably full profile after a cultivated fallow. This indicates that deep infiltration and drainage are possible, but that the method or rate of wetting is important in determining the outcome. In the Macquarie case, ESP was ~20%, electrical conductivity (EC) 0.76 dS/m and bulk density ~1500 kg/m3 below 0.8 m, and the soil was structurally degraded. That is, infiltration is expected to be poor.
Soil chloride profiles and transient chloride mass balance
Chloride concentrations in the soil profile provide an insight into past drainage through a soil, particularly when it is compared with a Cl profile from native vegetation, which does not change at time-scales of decades (Silburn et al. 2009), or with other profiles through time. This is because Cl, which occurs naturally in rain and soil, is conservative, soluble and mobile, and in the long-term moves where the water moves (subject to various caveats; see Walker 1998). Under native vegetation in semi-arid and sub-humid regions, Cl concentrations typically increase with soil depth to a maximum and are then variable but similar in deeper layers (Silburn et al. 2011; Tolmie et al. 2011), due to storage of historic Cl from rainfall (see e.g. Fig. 5). Observations of significantly lower EC or Cl levels in irrigated soils compared with paired native vegetation or rainfed sites are common (Shaw and Yule 1978; Gardner and Coughlan 1982; McKenzie et al. 1991; Willis and Black 1996; Scanlon et al. 2010a), indicating an increase in deep drainage.

|
Changes in Cl profiles can be analysed to determine deep drainage rates using steady-state (USSL 1954) or transient Cl mass balance (CMB). Transient CMB uses change in the Cl mass either in the soil profile (e.g. SODICS, Thorburn et al. 1987, 1990) or in the unsaturated zone (Cl front displacement, Walker et al. 1991). Transient CMB assumes complete mixing and does not include deep drainage by bypass flow, and therefore may underestimate deep drainage, although Prendergast (1995) has shown that bypass flow can have the same Cl concentrations as the soil matrix pore water and CMB would include this form of leaching. Chloride profiles often attain a new steady-state reasonably rapidly under irrigation (Thorburn et al. 1990; Weaver et al. 2005), and the simpler steady-state analysis is then valid. Several studies have found reasonable agreement between transient CMB and water balance modelling (Yee Yet and Silburn 2003; Huth et al. 2010). Transient CMB does have some advantages: it indicates whether the Cl is in steady-state; it can consider long periods and thus give results approaching a long-term average; it is inexpensive enough to use for many sites, replicates or composited samples; it can detect low rates of deep drainage (e.g. 1 mm/year) if the change in mass of soil Cl is sufficient (i.e. given enough drainage or time); and it provides clear and compelling evidence of deep drainage (Silburn et al. 2009).
Thorburn et al. (1990) estimated deep drainage from paired Cl profiles and irrigation water quality data from 42 irrigated soils in the Lockyer Valley and in Central Queensland, using the transient CMB model SODICS. For soils with a wide range of properties (Table 3), deep drainage was 0–100 mm/year for half of the sites, 100–300 mm/year for 18 sites (43%) and 500–1200 mm/year for three sites. Time to establish a new soil Cl equilibrium (i.e. to attain steady-state) mostly ranged from 3 to 40 years, depending on the drainage rate and irrigation salinity, but was as short as 1 year with very high drainage and 50–100+ years for soils with low drainage rates. The new equilibrium under irrigation involved cases of both increased (salinisation) and decreased soil Cl. Dowling et al. (1991) used similar methods on a furrow-irrigated, sodic duplex soil in the Burdekin, North Queensland, with and without applied gypsum. Deep drainage was highest at the head-ditch end of the field (98 mm/year, without gypsum) and decreased towards the tail-drain (0 mm/year), or 200 and 70 mm/year with gypsum.

|
Willis and Black (1996) also found lower soil Cl for irrigated sites compared with non-irrigated sites in the Macquarie Valley for four soils (generally ‘lighter textured’ soils, although one was a Grey Vertosol). They used measured changes in soil Cl profiles and transient CMB to calculate long-term changes in deep drainage associated with flood irrigation. Their results (Table 3) indicate a wide range in the increase in deep drainage under irrigation, with a larger increase for the lightest textured soils. Partly because of their greater drainage, the lightest textured soils received more irrigation water, thus further contributing to greater drainage. The increase in drainage was lower on soils with higher clay content (Mullah and Mitchell), due to their higher water-holding capacity, leading to less frequent irrigation, lower drainable porosity and (presumably) lower subsoil permeability. The low drainage for the Grey Vertosol is roughly equivalent to the drainage estimated for sodic Grey Vertosols in the Namoi Valley (work of Hulugalle and Weaver, discussed below), but is much lower than the deep drainage measured on a similar soil by Willis et al. (1997) (Table 3).
Willis et al. (1997) compared deep drainage by measured water balance, steady-state CMB and Darcian flux calculation, for the Mullah cracking clay and Wilga duplex soil (Table 3). Deep drainage was 214 and 104 mm, respectively, using steady-state CMB for the years of irrigation, and 236 and 145 mm, respectively, for the one cotton season monitored. The CMB was considered the most reliable method, although the measured water balance did give deep drainage for individual irrigations. These results showed that deep drainage was greatest early in the growing season following initial wetting of the soil, when the crop had a low leaf area index.
Zischke and Gordon (2000) estimated the leaching fraction and thus deep drainage from soil properties at sites on the Darling Downs alluvia (n = 7) and in the Namoi Valley (n = 5) and Macquarie (n = 6), using a method originally based on steady-state salt mass balance (SaLF, Shaw and Thorburn 1985). They obtained average values of 270, 68 and 300+ mm/year for the regions, respectively, or 24, 5 and 30+% of water inputs. Moss et al. (2001) reported transient CMB results for some of the same sites, averaging 258 (n = 4), 64 (n = 3) and 224 (n = 3) mm/year, respectively, or 31, 8 and 27% of water inputs. The steady-state SaLF and transient CMB results appear reasonably comparable, and represent longer term estimates of deep drainage (i.e. for the period under irrigation).
Montgomery (2003) (see Silburn and Montgomery 2004) measured Cl profiles in irrigated and adjacent rainfed fields in the Gwydir Valleys, NSW. Irrigated fields had lower Cl concentrations in the soil profile than adjacent rainfed sites (Fig. 5), indicating that Cl has been leached downwards and drainage was greater than under rainfed cropping. Modelling with SODICS (Thorburn et al. 1990) indicates that deep drainage had increased by 62 mm/year for the Vertosol and 35 mm/year for the Red Dermosol over the 17 years since development (Table 3), or 123 and 69 mm/year, respectively, if only the years with irrigation are considered to cause increased drainage, compared with rainfed cropping (i.e. total deep drainage would be greater). Measured water balances for the same fields for one season gave deep drainage of 158 and 53 mm, respectively. The Red Dermosol had a higher potential for drainage (e.g. higher saturated hydraulic conductivity), but only drained in the first few irrigations, as indicated by moisture probes and tensiometers, due to under-irrigation and poorer infiltration (hardsetting) as the season progressed. In contrast, deep drainage on a Grey Vertosol in the Namoi Valley (ACRI, short furrows), by measured water balance, was only 9 mm for the season (may underestimate drainage by rainfall), illustrating again the low drainage on these soils and efficient furrow practiced on this research station, which so informed the industries early views on deep drainage being small.
Scientists at ACRI, Narrabri, have measured deep drainage using steady-state and transient CMB since about 2000, for continuous cotton and various crops in rotation with cotton at various sites in the Namoi Valley (Hulugalle and Weaver 2000; Weaver et al. 2002, 2005, 2013; Hulugalle et al. 2005, 2010; 2012). Soils were self-mulching grey clays (Vertosols, or Typic Haplusterts; Soil Survey Staff 1999). The data for continuous cotton are most relevant, because this system is most commonly practiced by cotton growers (Table 3). Values for irrigated cotton include: 98 mm/year for continuous cotton and 76–151 mm/year for cotton with various prior crops and incorporated or standing stubbles (Hulugalle et al. 2005); 35–78 for cotton sown into standing wheat stubble and 62–83 for cotton sown into incorporated wheat stubble, both with low rates of irrigation (Weaver et al. 2005); and 25 and 33 mm/year on average for four cotton monoculture crops with conventional tillage and permanent beds, respectively (Hulugalle et al. 2010).
Hulugalle et al. (2010) found that deep drainage was greater with permanent beds than for conventional tillage, with wheat in rotation on permanent beds, and with more frequent irrigation. Hulugalle et al. (2012) found that deep drainage under irrigated cotton on a Grey Vertosol (six seasons) at Narrabri was greater when rotated with wheat (41 mm) or wheat–vetch (31) than with cotton (24 mm) or vetch (19 mm), and under lengthy fallows than under short fallows, especially dry winter fallows. During wet winters, drainage was greater in fallow than crops. Reasonably large losses of nitrate-N, ions and salt (as EC) occurred in deep drainage. Similarly, Weaver et al. (2013) found salinity and sodium adsorption ratio (SAR) of drainage leachate were many times higher than those of irrigation water and that losses of nitrate (NO3-N) in leachate were large.
It would be useful if all of these results could be tied together to summarise the main drivers of deep drainage, including the effects, if any, of soil properties, irrigation management and water quality, and crop and tillage practice. Figures 2 and 3 indicate that total rainfall plus irrigation should explain a considerable portion of the variation in deep drainage.
Measured water balances
Tennakoon and Milroy (2003) obtained production and water use data from 25 cotton farms and ≥200 individual fields representing the six largest cotton-production areas in Australia. They estimated ET by calculating a daily water balance for each field using a computer model. They assessed total water use, including in-season rainfall, change in soil water, and water pumped, harvested or taken from storages. Average water excess, i.e. total water use (1115 mm) minus ET (735 mm), was 379 mm/year, or 259 mm/year excluding an unusually large value for the Gwydir Valley. This excess could be lost in transmission and storage or by in-field losses such as deep drainage. Where water is stored on-farm in raised earth dams (‘ringtanks’), losses can be large, mainly due to evaporation (Dalton et al. 2001; Roth et al. 2013). Runoff is not considered a loss (rather a cost) as it is recycled. If half of the excess (259 mm/year) is lost in transmission or storage, deep drainage is ~130 mm/year.
McHugh (2003) (also McHugh et al. 2008) used measured water balance on an alluvial Vertosol and found deep drainage of 118 mm/year for furrow irrigation with farmer practice and almost nil the following year with furrow irrigation after optimisation, in years when in-season rainfall was almost absent (Table 3). With subsurface drip irrigation (SDI) at 90% of the soil water deficit, considerably less water was applied and deep drainage was only 18 mm/year in one year and nil the next. Both SDI and optimised furrow irrigation were shown to be capable of high WUE when minimal rainfall occurred.
Dalton et al. (2001) and Dalton (2003) measured deep drainage by measuring water balance on the Border Rivers alluvia and Darling Downs, respectively. In the Border Rivers, they measured deep drainage in single seasons on eight fields on various Vertosols and determined values of >75–235 mm/season (11–30% of water input), averaging >136 mm (Table 3). On two other fields (Table 3) they determined deep drainage of 128 and 166 mm/season (11–12% of water input). Dalton (2003) measured deep drainage by volume balance, furrow advance and soil CMB, on a heavy clay on the Darling Downs, obtaining values of 124, 144 and 72 mm/season, respectively (Table 3). The lower rate from CMB may indicate deep drainage by bypass flow not detected by CMB, or errors inherent in each method.
Analysis of furrow advance data for 79 furrow irrigation events conducted by growers in southern Queensland found average deep drainage losses of 42.5 mm per irrigation and potential annual losses of up to 250 mm (Smith et al. 2005) (Table 3). This represents a loss of up to2.5 ML/ha of water that could be used beneficially to grow more cotton. The same methodology was used to estimate application efficiencies (percentage of water applied that infiltrated into soil) for each irrigation. Application efficiencies were shown to vary widely from 17 to 100%, with an average of 48%. Smith et al. (2005) used the SIRMOD model, calibrated with data from each field, to model strategies that would lead to gains in efficiency and reductions in the deep-drainage losses. Deep drainage could be halved or better using improved irrigation management (Table 3). Smith et al. (2005) concluded that: ‘Additional simulations of selected events showed that further significant improvements in performance can be achieved by the application of more advanced irrigation management practices, involving infield evaluation and optimisation of the flowrate and irrigation time to suit the individual soil conditions and furrow characteristics. Application efficiencies in the range 85–95% are achievable in all but the most adverse conditions. The dependency between deep drainage and irrigation management was demonstrated, confirming that substantial reductions in deep drainage are possible by ensuring that irrigation applications do not exceed the soil moisture deficit.’
Modelled water balances
Connolly et al. (1999) used the GLEAMS model to assess water balance and soil erosion in the EIA, while Connolly et al. (2001) assessed water balance and the potential and management of endosulfan runoff in the EIA and in fields at Auscott, Warren (Macquarie Valley). Rainfall, irrigation and runoff data measured at each site were used to calibrate the models. Deep drainage was not reported in those papers, but the results were reported by Silburn and Montgomery (2004). The results (Table 3) indicate considerable deep drainage is likely when irrigation of 7.2 ML/ha.year is applied (720 mm/year), that is, about the average used for cotton crops (Hearn 1998). Drainage (246 mm/year) and leaching fraction (19%) are similar to those from the furrow-irrigated lysimeter study (leaching fraction ~20%) of Moss et al. (2001) and SaLF model results for Darling Downs soils (Table 3). Average annual runoff is similar to the average measured over 12 years in the EIA (174 mm) (Silburn et al. 1997, 1998).

|
When considerably less irrigation is used (2.6 ML/ha.year), mimicking a system with ‘perfect’ irrigation, that is, only just refilling the soil water deficit to field capacity, then considerably less drainage is predicted (75 mm or 9% of R + I) (Table 3) (Silburn and Montgomery 2004). This drainage is due to rainfall occurring during the season and is greater than for rainfed cotton, due to rain falling on soil wet by irrigation. This provides a leaching fraction for maintaining the soil salt balance, even though irrigation is not causing drainage. With no irrigation (rainfed cotton), deep drainage was 6 mm (1%), runoff 16 mm (3%) and ET 589 mm (96% of rainfall), consistent with other drainage estimates for rainfed cropping in the Fitzroy Basin (Radford et al. 2009).
Modelled deep drainage (56 mm/year, 4% of R + I) for furrow-irrigated cotton in the Macquarie Valley on a hard-setting, red-brown alluvial soil was less than at Emerald. This is due to slightly greater runoff and less irrigation, the soil’s lower permeability and differences in irrigation management.
It is surprising that other modelling studies of deep drainage for irrigated cropping were not found, except for those reported from China and the USA. This may indicate a lack of confidence in modelling except where the terms in the water balance are reasonably well defined, as in the case of Connolly et al. (1999, 2001). Most currently available models do not represent bypass flow and may not fully capture the change in deep drainage often seen across the season (Brett Robinson, pers. comm.), with higher deep drainage pre-irrigation and declining through the season. The soil hydraulic conductivity would need to be adjusted through the season (to represent subsoil swelling) to represent this behaviour.
Drainage lysimeters
Moss et al. (2001) measured deep drainage at 2 m depth on the Condamine alluvia, Queensland, using two, large-area (1.5 by 3 m), undisturbed constant suction lysimeters. These were in furrow-irrigated and SDI Vertosols (80% clay, EC ~1 dS/m, ESP 15–30% for the furrow site) (Table 3), for 3 and 2 years, respectively (Table 3). Measured deep drainage was 152–182 mm/year for furrow irrigation and 305 and 95 mm/year for SDI. The furrow site had a sodic soil but had been irrigated with poor quality groundwater; in any case, deep drainage was reasonably high (~18% of R + I) and typical of deep drainage for older style furrow irrigation. The maximum drainage rate after a furrow irrigation was 5 mm/day (i.e. driven by hydraulic gradient >1.0), which then settled to ~1–2 mm/day—consistent with Shaw (1995) for a sodic soil (Fig. 4)—resulting in 22 mm of drainage over a 16-day period before drainage ceased (including one 37-mm rainfall event). Deep drainage arrived at the lysimeter within one day of significant rainfall or irrigation. Soil water content at 1.75 m settled to 0.49 v/v between wettings and rose to 0.52 v/v (~total porosity) after wetting.
The high deep drainage resulted in leaching of large masses of nitrate (~200 kg N/ha.year) and Cl (~3000 kg Cl/ha.year). The herbicide prometryn was detected (0.5–1.1 µg/L) in leachate at both sites, which is expected given it is used in most years. However, atrazine (and its derivative desethylatrazine, DEA) and hexazinone were also detected in almost all samples (atrazine 16.8–1 µg/L declining with time, and DEA and hexazinone 0.8–0.1 µg/L), even though they were last applied 5 years previously. This is probably because the subsoil was near saturated (anaerobic), has low organic carbon and is alkaline, thus preserving these herbicides.
The deep-drainage results for SDI (in fact, pressurised buried tape at 0.4 m depth) are not representative of well-managed drip irrigation, which can achieve near zero deep drainage with irrigation at 100% or less of soil water deficit (Table 3; McHugh 2003; McHugh et al. 2008). Ponding of water over the SDI lysimeter in one year (due to poor local surface drainage) resulted in 857 mm of deep drainage, indicating that SDI may require land levelling and that, despite high clay and sodic soil, there is still a high potential for deep drainage.
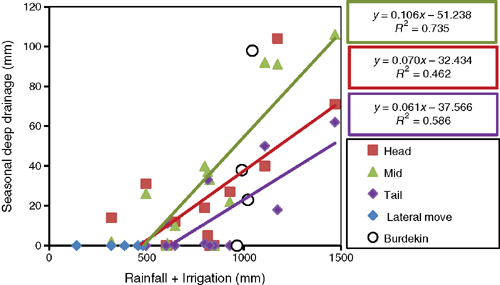
Gunawardena et al. (2011) measured deep drainage in eight fields, some starting in 2002, to 2011, growing cotton and other crops watered with furrow irrigation, over 59 seasons of which 29 had a full record of rainfall, irrigation amount applied and deep drainage. One paired field with a lateral move irrigator was also monitored from 2005 to 2011. Drainage was measured with ‘barrel’ lysimeters, which apply a constant suction to the base of the lysimeter sufficient to lift the water to the soil surface. Three lysimeters were installed to capture water passing 1.5 m depth in each field at head, mid and tail locations. Gunawardena et al. (2011) noted some seasons when the deep drainage was affected by blocked field exits, which led to large deep-drainage amounts; although this is real deep drainage that did occur, for our purposes we have removed these data (coded B in their table 2). Deep drainage ranged from 0 to 235 mm/season (27% R + I). However, there were many examples at all sites where little or no deep drainage was recorded, and only ~20% of seasons had measured deep drainage >100 mm (1 ML/ha). Low or zero deep drainage seasons were in part related to the combination of limited water supply and above-average evapotranspiration (due to the Millennium drought) and possibly to equipment failure on some occasions. Seasonal deep drainage was related to season total rainfall plus irrigation (Fig. 6) and generally required >500 mm of rainfall plus irrigation to cause drainage. However, there were seasons with 800–900 mm of rainfall plus irrigation where no drainage occurred, particularly at the tail sites. There are evidently other factors that determine seasonal deep drainage, including the occurrence of large rainfall events and various irrigation management practices. For instance, Smith et al. (2005) found that deep drainage could be halved using optimised management of furrow irrigation. The data of Dowling et al. (1991) from furrow irrigation in the Burdekin are comparable to the data from cotton sites (Fig. 6).
|
Some other conclusions are:
-
Deep drainage generally increased from head to mid to tail positions (except where the outflow of tail-water was blocked) due to decreasing opportunity time for infiltration (this is not always apparent in Fig. 6, e.g. due to the season with 1497 mm of R + I). Indeed waterlogging and reduced crop growth was often observed in the head position.
-
Deep drainage was most prevalent at the start of the irrigation season, so reduction in water applied in the pre- or first-irrigations can dramatically reduce deep drainage.
-
Infiltration capacity, measured by furrow advance, also decreased with irrigation later during the season at most sites, presumably due to smaller soil-water deficits and moister subsoil.
-
One site was under lateral-move irrigation, gave no deep drainage and had up to 59% reduction in water applied with equivalent cotton yield compared with a paired furrow-irrigation site. The lack of deep drainage could lead to salt accumulation in the root-zone, although this may yet be leached by rainfall in wetter times. Longer term monitoring is required to derive conclusions at this site.
We note that barrel lysimeters applying a constant suction may overestimate deep drainage when the soil is more saturated than the applied suction (Foley et al. 2003). However, the magnitude of overall error (e.g. each season) is unknown and the results appear reasonable compared with other methods.
Deep drainage leachate at all sites was relatively saline, showing the potential for salts to be moved to groundwater and streams. Irrigation management needs to balance the need for a leaching requirement (some deep drainage) to minimise root-zone salinity and the need to avoid off-site drainage impacts. The deep drainage rates for furrow irrigation exceeded the leaching requirement for all sites except one (see table 3 in Gunawardena et al. 2011). In the long-term, the required leaching fraction for these sites is provided by deep drainage caused by rainfall on irrigated cropping (Yee Yet and Silburn 2003). The remaining site uses poor quality irrigation water which may not be sustainable.
Since 2006, Ringrose-Voase and Nadelko (2013) have operated equilibrium tension lysimeters (Foley et al. 2003) to directly measure deep drainage at ACRI, Narrabri (see also Silburn et al. 2013). Six lysimeter trays collecting drainage over an area of 1.6 m2 were installed by tunnelling horizontally at 2.1 m depth from an access shaft, leaving the overlying soil undisturbed. This type of lysimeter (Foley et al. 2003; Pegler et al. 2003) is able to accurately measure drainage by applying a suction to the collection trays (with sintered metal plates in contact with the soil above) that is constantly adjusted so it is equal to the suction of the surrounding soil at similar depth. Deep drainage was measured under cotton, wheat and fallow conditions and ranged from 0 to 74 mm/season, confirming other lower drainage rates at ACRI.
It was also found that deep drainage in cracking clay soils occurs in two ways: bypass drainage and matrix drainage. Bypass drainage is more rapid than matrix drainage and can drain below 2 m without fully wetting the subsoil. It was mostly observed during furrow irrigation, particularly during the first few irrigations in the season. Bypass drainage typically has salinity of 2000–3000 µS/cm, whereas matrix drainage had salinities of ~8000 µS/cm. Leaching of dissolved nitrogen also occurs; for example, 9.5 kg N/ha was leached during the 2008–09 season. Preliminary observations of groundwater below the site suggest that the peak in seasonal recharge into the upper aquifer (at ~16 m below surface) may occur just 15 days after the peak in seasonal deep drainage at 2 m.
Deep drainage after 2004, the Millennium drought and improved WUE
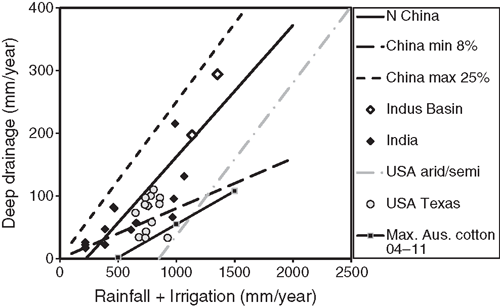
The ‘maximum’ deep drainage v. R + I of Gunawardena et al. (2011) (Fig. 6) is compared with global data in Fig. 7. The more recent data from Weaver et al. (2005), Hulugalle et al. (2010, 2012) (Table 3) and Ringrose-Voase and Nadelko (2013) are compatible with, or lower than, those of Gunawardena et al. (2011). Although these studies are not a representative sample of all Australian cotton-growing districts, they do include nine diverse, commercial sites across the Queensland Darling Basin (Gunawardena et al. 2011) and five in the Namoi Valley (Weaver et al. 2005) and at ACRI, Narrabri. These data indicate that modern (~post 2004) furrow irrigation practices in Australian cotton are giving deep-drainage rates per unit of water inputs that are less than or equal to the lowest rates in global studies.
|
Understanding flow processes in clay soils—variable-tension lysimeters and tensiometry
Foley et al. (2003) installed a variable-tension lysimeter (Pegler et al. 2003) in a cracking clay soil (Black Vertosol), with banks of tensiometers measuring matric potential over an extended fallow period (i.e. no crop) and for two simulated irrigations, reported by Silburn et al. (2010). Deep drainage measured at 1 m depth was dominated by matrix flow, with only 10% of drainage attributed to preferential flow (note that the soil was never dry enough to crack); that is, 90% of drainage was explained by Darcy flow. Findings include: (i) a compacted, throttle layer was important in determining flow through the profile; (ii) flow was usually unsaturated except in the throttle layer; (iii) downward travel time for ponded water was rapid (0.75 m/h); (iv) hydraulic gradient rather than hydraulic conductivity (K) was the largest term in determining flow; (v) the profile was never at unit gradient/steady-state throughout the study; (vi) downward gradients were up to three times the saturated hydraulic conductivity (Ksat) in wet soil and nine times at about drained upper limit, i.e. gradient dominated flow (gradient × K); (vii) maximum drainage rate was 6 mm/h compared with a saturated hydraulic conductivity of 0.85 and 0.63 mm/h (20 and 15 mm/day), respectively, measured by ponded rings and the lysimeter; and (viii) deep drainage during the irrigations was 23 and 18 mm, somewhat less than the drainage for commercial irrigation events determined by Smith et al. (2005), where irrigations were run for longer.
Soil moisture and matric potential
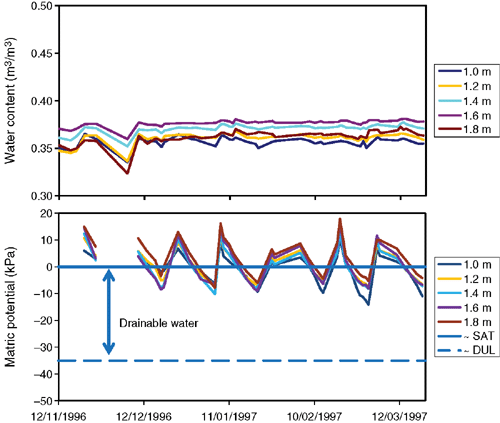
In the past, emphasis has been put on constant subsoil moisture content (e.g. from neutron moisture meters and capacitance probes) as evidence of no drainage. Figure 8a is an example of such data from a Black Vertosol in the Gwydir valley (Silburn and Montgomery 2004). All layers from 1 to 1.8 m show fairly constant moisture contents in the range 0.35–0.38 v/v, which would seem a moderate water content (i.e. wilting point in some Vertosols). However, with a bulk density of 1590 kg/m3, total porosity is 0.40 v/v, so a water content of 0.38 v/v is in fact near saturation. We expect drained upper limit (field capacity) to be ~0.05 v/v below total porosity (typical air content in clay subsoils at drained upper limit; Gardner 1988), i.e. drained upper limit = 0.35 v/v. Thus, the measured subsoil moisture contents are likely to be between drained upper limit and saturation, and some soil water is drainable. This was confirmed by tensiometer data (soil matric potential) from the subsoil (Fig. 8b), which indicates that all layers between 1.2 and 1.8 m were at, or near, saturation throughout the irrigation season. (Roots appear to have penetrated to only ~1 m). Thus, water was probably draining through the subsoil throughout the season. Water balance measurements at the site indicated that 158 mm drained below 1.8 m during the season monitored (Table 3; Montgomery 2003).
|
Observations of soil water (or lack of change in soil water) have proved to be unreliable indicators of deep drainage; see, for example, discussion by Smith (2008) of early ideas that clays in the Ord River Irrigation Area (ORIA) were suitable for rice production—‘Marshall (1944) found that surface water infiltrated no deeper than 1.07 m into Cununurra clay after surface water ponding for 54 h. He postulated that groundwater accession beneath rice growing should not be a problem’—compared with more recent observations of deep drainage for both wet season rainfall and furrow irrigation in the ORIA, from modelling and daily groundwater levels.
Moisture capacity and status under native vegetation and irrigation
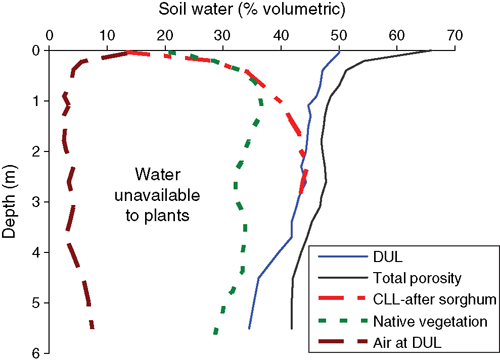
Foley et al. (2010, 2012) and Silburn et al. (2010) measured soil moisture, matric potential and bulk density of deep soil cores (e.g. 6 m) in native vegetation, and irrigated cropped sites at crop lower limit, upper limit (after ponding as per Dalgliesh and Foale 1998) and drained to ~–20 kPa (verified with tensiometers installed at a range of depths), at three sites each in the Condamine alluvia and Lower Border Rivers, thus defining the plant-available water capacity (PAWC) and the moisture status of the unsaturated zone. At most sites, three positions were wet up in a paddock and four to six cores taken in the ponded area and again adjacent to the wet zone. Water retention characteristics at various depths and a range of physiochemical properties (including particle size analysis, pH, EC, Cl and NO3-N) were measured.
Electrical resistivity tomography (ERT) transects were imaged at selected PAWC sites with (where possible) transects running through native vegetation and adjoining irrigated paddocks to look at differences in water and salt contents due to long-term irrigation (Foley et al. 2010, 2012). Soil cores were also taken along the transects to measure water content, particle size analysis and chemistry (pH, EC, Cl and NO3-N) to assess the influence of salt and clay content on resistivity measurements. Two-dimensional resistivity images were inverted using the RES2DINV software. Data were converted to conductivity, with high conductivity generally indicating more water and salts, and higher clay content.
Consistently across the irrigated paddocks, the soil was wet to drained upper limit or above (i.e. actively draining) to 1–2 m depth even after a crop had been grown (example given in Fig. 9). Beyond 2 m, most irrigated sites remained wet at depth; air content at drained upper limit was 3–5%. Coring in adjacent native vegetation revealed very dry soil to depth, indicating that under trees there is virtually no deep drainage, with trees able to extract more water and to greater depth.
|
The ERT images at all sites typically show a highly conductive zone of soil (very wet, with medium salinity typical of soils in the region) throughout the irrigated portions of transects. An example of this can be seen in Fig. 10, where the darker blue area in the top 6 m of soil, from 120 to 600 m along the transect, corresponds to the location of the irrigated paddock. Conversely, under native vegetation (0–120 m) the regolith remained dry in the surface. Trees were able to extract more water from the soil, indicated by measured soil water potentials of around –4 to –6 MPa compared with –1 to –2.5 MPa for rainfed crops and usually less that this again under irrigation. This maintained a ‘buffer’ against deep drainage losses. For example, there was a buffer (unfilled storage capacity) of 240 mm to 2 m or 580 mm to 6 m under native vegetation at the Dalby site (Fig. 11). This compares with a buffer of only 90 mm to 2 m in the irrigated soil. This 90 mm is smaller than a single irrigation application, and suggests that any irrigation application of approximately this volume would cause deep drainage.

|
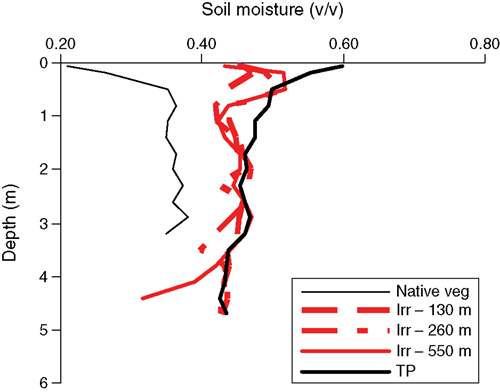
|
Soil coring confirmed that (on average) the blue areas in the image were very wet (Fig. 11), with up to 250 mm of the water in the top 6 m above drained upper limit, i.e. actively draining. In Fig. 10, the soil texture changes at around 5–6 m, with increasing sand and occasional gravel layers. These layers have a lower conductivity due to the increasing presence of unsaturated sands (and hence the colour changes in the image). However, water continues to drain to deeper in the regolith at a rate proportional to the hydraulic conductivity of these deeper clay and sand layers.
The coring program has provided considerable data to support the widespread occurrence of an historical change in regolith water storage as a result of deep drainage under irrigation. This is further supported by results from the resistivity imaging, where a layer of near-saturated soil in the profile between 2 and 6 m was found in all irrigated paddocks (Foley et al. 2010). Kelly et al. (2011) and Foley and Silburn (2013) also observed water movement below the root-zone in Vertosols in ERT images in the Namoi Valley and Lockyer Valley, respectively. This coring and imaging has confirmed that deep drainage has been occurring extensively across these landscapes. This is in agreement with Scanlon et al. (2010a), who found that the unsaturated zone pore water beneath irrigated agroecosystems can be fingerprinted by higher matric potentials (wetter soils) than that beneath natural ecosystems.
Consequences of deep drainage
To understand the consequences of excess deep drainage, we must consider three topics: the quality of deep drainage/leachate; the effects on groundwater rise and possible lag times; and groundwater discharge, i.e. what effects it might have.
Quality of deep drainage/leachate
Duncan et al. (2008) found in a review of water and salt fluxes for irrigation areas globally that significant amounts of salt are mobilised and discharged. This is due to either the existence of large amounts of salt in the soil and groundwater system, or large amounts of salt imported into areas with irrigation water. In the Namoi Valley, Weaver et al. (2013) found that salinity and SAR of drainage water under irrigated cotton were many times higher than those of irrigation water: ‘Salinisation and sodification of shallow groundwater reserves under irrigated cotton in Vertisols are, therefore, a distinct possibility.’ Similarly, Gunawardena et al. (2011) measured deep drainage and sampled leachate using multiple lysimeters in nine irrigated, commercial cotton fields in the upper Murray–Darling Basin, on Vertosols with a wide range of clay contents (38–75%). They consistently found high salinities in the leachate (e.g. 3700–13 400 µS/cm, mainly as NaCl), indicating that large amounts of salt were being mobilised and that irrigation-induced deep drainage is a source of poor quality recharge. McMahon et al. (2003, 2006) found large Cl, NO3 and atrazine reserves in deep, unsaturated-zone soil water under irrigated fields in the central High Plains in south-western Kansas. Similar outcomes and issues occur in the southern High Plains (Scanlon et al. 2010b). Considerable fluxes of NO3-N are often found in the deep drainage (Moss et al. 2001; Weaver et al. 2013).
However, in some situations, at some long time after the change of land use from native vegetation to irrigated agriculture, a new equilibrium is established in the irrigated soil, unsaturated zone and groundwater. In the Lockyer Valley, large masses of salts have been flushed from the unsaturated zone and deep drainage is now supplying recharge that is of no worse quality than that of the groundwater (Foley and Silburn 2013). While the previously leached salts have increased the aquifer salinity, in major parts of the Valley the groundwater salinity is still of reasonable quality (Gunawardena et al. 2013).
Groundwater rise and possible lag times
Three examples are given for the groundwater response to irrigation deep drainage. Irrigation began in the St George Irrigation Area (SGIA) in the 1960s. Compared with the regional groundwater surface, the SGIA appears as a groundwater mound (Kellet et al. 2004). However, in individual monitoring bores, responses are a mix of no response, rising or fluctuating. Figure 12 shows one bore near irrigated land rising and one remaining more-or-less steady, whereas reference bores under native vegetation or rainfed cropping typically show no response.
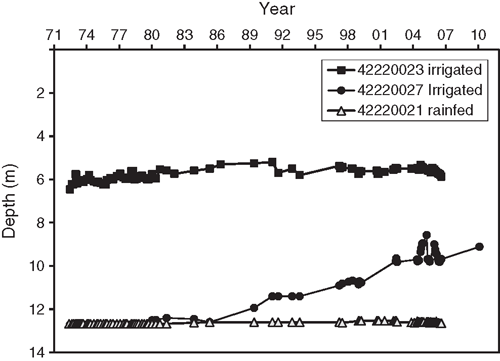
|
Irrigation has only occurred in the western Border Rivers alluvia since the 1980s and monitoring only began in 2000 (Biggs et al. 2006). Groundwater levels near irrigated fields in the western Border Rivers alluvia are typically closer to the surface than those away from irrigation and have a more pronounced rising trend (Fig. 13). The water level in one bore has been rising at nearly 1 m/year since installation in 2009 and is currently at 2 m below ground surface (data not shown). Some bores show no discharge, that is, they rise continuously. Salinity in these aquifers is typically 40–50 000 µS/cm and the water is often acidic (pH ~4) (Biggs et al. 2005). Changes in groundwater levels do not occur in bores away from irrigated fields throughout the Border Rivers. This is because, for native vegetation, deep drainage rates are at or near zero and the unsaturated zone is very dry, and for rainfed cropping, deep drainage rates are low (~5–10 mm/year) and are slowly filling the remnant dry unsaturated zone from native vegetation (Silburn et al. 2011).
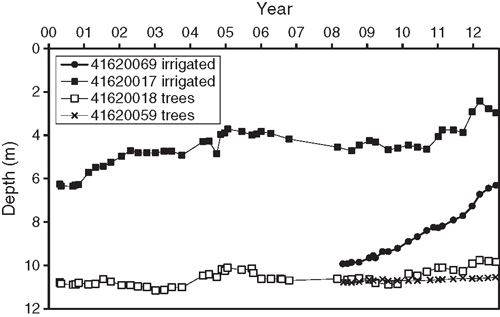
|
In the Condamine alluvia, irrigation using groundwater developed rapidly after 1960, and pumping has generally exceeded the range of estimates of recharge (Dafny and Silburn 2013). Thus, the deeper, good-quality, high-yielding aquifers have consistently had falling water levels throughout the Condamine alluvia. Generally, the shallowest aquifers were dewatered before irrigation development (including by hand-dug wells) and have remained dry or unmonitored. However, monitoring sometimes intersects shallow aquifers with water that is rising while levels are falling in deeper aquifers (Fig. 14). The falls in water level after each major rise (~3–5 m) in the shallow aquifer indicate discharge, either laterally and/or downwards. The salinity of the shallow aquifer was 11 500 µS/cm (in 2009), whereas the salinity in the deep aquifers was 2500 µS/cm. The salinity of the shallow aquifer is similar to the salinity of deep drainage leachate measured under irrigation (Gunawardena et al. 2011) and under rainfed cropping (Tolmie et al. 2011). There is a risk that the more saline water in the shallower aquifer is leaking into the deeper aquifers, particularly given the increased gradient between them, although few rising salinity trends have been detected thus far.
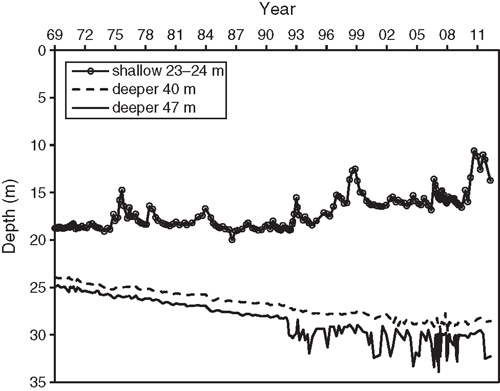
|
Groundwater discharge
The major pathways for discharge are via groundwater flow and seepage, particularly for irrigation areas beside incised rivers, and via groundwater use by trees. For groundwater rise and flow to occur, the systems must be in a mature state of hydrologic development, with the increase in deep drainage due to irrigation flowing through to groundwater rise and discharge (Grundy et al. 2007; Silburn et al. 2008). This is probably the case for some older irrigation areas in Queensland where groundwater is not pumped and high watertables occur (e.g. Emerald, which requires a su-surface drainage system, and Burdekin alluvia, Brough et al. 2008; ORIA, Smith 2008). However, it is not generally the case in most irrigated cotton valleys, either because the groundwater is pumped and water levels are below the streams (e.g. Namoi, Kelly et al. 2013; Condamine, Dafny and Silburn 2013), or because the groundwater has not yet risen to intersect streams or the land surface. That is, the system is not yet in equilibrium with the higher drainage rate under irrigation.
In summary, deep drainage under irrigation is filling or has filled the dry unsaturated zone left over from native vegetation and will cause or has caused groundwater to rise, with high salinity from the soil or the groundwater, creating several risks to land and water resources. These risks, and several mitigating factors and uncertainties, are discussed in the following section.
Discussion
It is apparent from the studies reviewed above, that the statement that ‘clay soils don’t drain’ is well disproved. Rather, the key questions surround the magnitude and frequency of deep drainage, the potential impacts, ways to minimise the problem and opportunities to use the lost water productively. This points to the heart of the issue—are some soil types/irrigation areas or irrigation methods inherently unsustainable as a result of excessive deep drainage? Are some water types simply too saline for use in irrigation? Certainly history indicates that many irrigation areas are unsustainable, in that economically and environmentally significant impacts have resulted on- and off-site. Even with best case irrigation management, there will always be certain soils and landscapes where risk factors are such that an adverse outcome is virtually a certainty. While the body of knowledge regarding deep drainage in cotton-growing soils needs further refinement in terms of process understanding, it also needs to be more effectively utilised to describe the potential risks associated with irrigation,either at the paddock or district scale.
A variety of frameworks and methods exist by which to asses these risks, including the salinity risk assessment framework (Grundy et al. 2007), which has been applied extensively in Queensland. Within such frameworks, the level of complexity can also vary. For instance, a simple, conservative ‘bucket’-type calculation, which only requires an estimate of the deep drainage, size of the unsaturated zone and an assumption of no outflows, has been an effective tool in areas such as the Border Rivers, whereas in other localities, more complex approaches using real paddock data, geophysics, complex groundwater models, etc., have been used. Table 4 presents a simple list of risks and factors that have been proven to be relevant to assessing the impacts of excessive deep drainage from irrigated lands. Associated with these are a variety of uncertainties, in terms of either process knowledge or spatial knowledge. Many of the uncertainties relate to the lack of characterisation of the landscape at the local scale. Despite these uncertainties, the mitigating factors and management actions related to excessive deep drainage are well known, as they largely relate to the gross amount of water added to the landscape, irrigation efficiency and management (see discussion below).
Management of deep drainage
A thorough review of management for reducing deep drainage is beyond the scope of the paper. However, the review of deep drainage has highlighted that irrigation globally is in dire need of improved management. The Australian cotton industry has made good progress, prompted in part by water shortages, but further improvements are possible. Ultimately, deep drainage is related to the total rainfall and irrigation (Figs 6 and 7) or their excess over the crop water requirement, and the largest deep drainage losses occur due to over-application of water.
The need for further improvement is particularly so given that the approaches needed are available and well proven; i.e. for furrow irrigation, controlling irrigation application to less than the soil water deficit and optimisation of furrow irrigation. This involves monitoring or modelling the soil water deficit, and irrigating to match that deficit on a schedule fitting the crops water stress and yield response (e.g. Constable and Hearn 1980). Optimisation of furrow irrigation involves field-specific measurements of inflow, furrow advance and outflow during selected irrigations, modelling to derive that field’s infiltration characteristics and performance (estimating deep drainage, uniformity etc.), and then modelling to minimise deep drainage and runoff and maximise uniformity (McClymont and Smith 1996; Smith et al. 2005). The National Centre for Engineering in Agriculture (NCEA) has developed a suite of equipment (IRRIMATE©), software (INFILT and SIRMOD) and training for consultants to perform these optimisations. Management options include reducing furrow lengths, increasing inflow rate and reducing irrigation duration (early cut-off) (Dalton et al. 2001; Smith et al. 2005). These can result in a reduction of deep drainage by >50% (Table 3) (Smith et al. 2005), or near elimination of deep drainage in some cases when rainfall is low (McHugh 2003). Further tools need to be developed to calculate the leaching requirements to prevent soil salinity, including considering the leaching provided by rainfall. The authors and NCEA have been contracted by Cotton Research and Development Corporation to develop these tools.
Alternatively, deep drainage can be nearly eliminated by replacing furrow irrigation with centre-pivot or lateral-move irrigators (Gunawardena et al. 2011) or drip irrigation (McHugh 2003). High capital and energy costs can limit this approach (Baillie et al. 2007) but benefits will accrue in the longer term, particularly as adoption of CPLM methods can also increase crop choice. In summary, there is a large increment of excessive deep drainage that can be prevented reasonably simply.
Conclusions
A large body of evidence shows that clay soils, of most types, do have considerable deep drainage under irrigation that supplies a surplus of water, such as surface/furrow irrigation. This is because: they have structure and bio/macro-pores; they have large sorptivity and develop large gradients in matric potential which overcome their low to medium hydraulic conductivity; there are long opportunity times for drainage; and they have generally been watered to well above the crop water requirement or soil water deficit. Interpretation of soil infiltration rates and hydraulic conductivities has often been overly simplistic and over-generalised (as being low); final infiltration rates can be from >30 to <1 mm/day. Observations of constant subsoil moisture contents have been misinterpreted as no drainage; measurements of matric potential show they are near-saturated and draining continuously. Similarly, measurements of changes of profile soil moisture with less-than-precise instruments have often been misleading.
Reasonably rapid losses of soil Cl from the soil profile and increases in unsaturated zone moisture status provide compelling evidence of deep drainage under irrigated fields. Losses of Cl from the soil matrix indicate that matrix flow occurs. Bypass flow also occurs, but the amount is poorly defined and is dependent on the degree and rate of wetting/saturation.
Management options for reducing deep drainage are available and well proven, whether by optimising furrow irrigation management, which can reduce deep drainage by >50%, or by changing to lateral move, centre pivot or drip systems. Leaching fractions to prevent accumulation of soil salts are often provided by deep drainage from rainfall on irrigated soil, except when water of the poorest quality is used. Experience globally has shown that over-dependence on excessive leaching fractions or on constructed drainage works, which both assume a licence to pollute the wider environment, will fail eventually. They simply export the problem.
While the Millennium drought and a general decline in water availability led to substantial improvements in WUE in the cotton industry in Australia over the last decade, this has not entirely negated the risk and potential for adverse impacts. This risk exists purely as a function of the increase in deep drainage that occurs as a result of a change from native vegetation to agriculture (irrigated or not), but irrigation changes the time response. Further effort is required to better characterise the local landscape risks and potential impacts in cotton-growing areas and, in particular, the likely time-frames for risks to express and the capacity of management actions to reduce risk to an acceptable level.
Acknowledgements
We would like to thank the collaborating cotton growers and irrigators, the scientists who actually measured deep drainage under irrigation, CEOs of the Cotton Cooperative Research Centres (CRC), Dr Gary Fitt (1999–2003), Dr Guy Roth (2003–2007) and Philip Armytage (2008–2012) for encouragement, and Cotton Catchment Communities CRC, Cotton Research and Development Corporation, Grains Research and Development Corporation, Queensland Murray–Darling Committee, Condamine Alliance and Border Gwydir CMA for co-funding. We thank Dave Burton (DNRM) for making the map and Kevin Kodur for checking the manuscript. We also fondly remember our departed colleague Dr Des McGarry, the pessimist with great persistence.
References
Abbs K, Littleboy M (1998) Recharge estimation for the Liverpool Plains. Australian Journal of Soil Research 36, 335–357.| Recharge estimation for the Liverpool Plains.Crossref | GoogleScholarGoogle Scholar |
Ahmad M, Bastiaanssen WGM, Feddes RA (2002) Sustainable use of groundwater for irrigation: a numerical analysis of the subsoil water fluxes. Irrigation and Drainage 51, 227–241.
| Sustainable use of groundwater for irrigation: a numerical analysis of the subsoil water fluxes.Crossref | GoogleScholarGoogle Scholar |
Athavale RN, Chand R, Rangarajan R (1983) Groundwater recharge estimates for two basins in the Deccan Trap Basalt formation. Hydrological Sciences Journal 28, 525–538.
| Groundwater recharge estimates for two basins in the Deccan Trap Basalt formation.Crossref | GoogleScholarGoogle Scholar |
Australian Bureau of Statistics (2012) Water use on Australian farms. 2010–11, 4618.0. Australian Bureau of Statistics, Commonwealth of Australia, Canberra, ACT. Available at: www.abs.gov.au
Baillie J, Baillie C, Heinrich N, Murray A (2007) ‘On-farm water use efficiency in the Northern Murray–Darling Basin.’ Developed by National Centre for Engineering in Agriculture University of Southern Queensland, Toowoomba, Qld. Publication No. 03/08. (Murray–Darling Basin Commission: Canberra, ACT)
Biggs AJW, Power RE, Silburn DM, Owens JS, Burton DWG, Hebbard CL (2005) ‘Salinity Audit—Border Rivers and Moonie Catchments, Queensland Murray–Darling Basin.’ Publication No. QNRM05462. (Department of Natural Resources and Mines: Brisbane, Qld)
Biggs AJW, Silburn DM, Power RE, Free D (2006) The Border Rivers catchment—still fresh as a daisy?—Five years on. In ‘Murray–Darling Basin Groundwater Conference’. 18–20 September 2006, Canberra. (Murray–Darling Basin Commission: Canberra, ACT)
Biggs AJW, Silburn DM, Power E (2013) Catchment salt balances in the Queensland Murray–Darling Basin. Journal of Hydrology 500, 104–113.
| Catchment salt balances in the Queensland Murray–Darling Basin.Crossref | GoogleScholarGoogle Scholar |
Bos MG, Nugteren J (1990) ‘On irrigation efficiencies.’ Publication No. 19. (International Institute for Land Reclamation and Improvement: Wageningen, The Netherlands)
Brough DM, Silburn DM, Biggs AJW, Wilson PR, Rasiah V, Cresswell RG (2008) Salinity in Queensland—irrigation. In ‘2nd International Salinity Forum’. 31 March-3 April 2008, Adelaide, S. Aust. (CD-ROM) (Australian Government: Canberra, ACT)
Chan KY, Hodgson AS (1981) Moisture regime of a cracking clay soil under furrow irrigated cotton. Australian Journal of Experimental Agriculture and Animal Husbandry 21, 538–542.
| Moisture regime of a cracking clay soil under furrow irrigated cotton.Crossref | GoogleScholarGoogle Scholar |
Chand R, Chandra S, Rao VA, Singh VS, Jain SC (2004) Estimation of natural recharge and its dependency on sub-surface geoelectric parameters. Journal of Hydrology 299, 67–83.
| Estimation of natural recharge and its dependency on sub-surface geoelectric parameters.Crossref | GoogleScholarGoogle Scholar |
Chapman AL (1984) Preferential flow paths in Cununurra clay and seasonal variation in infiltration rates under rice field ponding at Kimberley Research Station, Ord River Irrigation Area, W.A. Tropical Agronomy Technical Memorandum No. 37. CSIRO Division of Tropical Crops and Pastures, Canberra, ACT.
Connolly RD, Kennedy IR, Silburn DM, Simpson BW, Freebairn DM (1998) Exploring farms design and management options with modelling. In ‘Minimising the impact of pesticides on the riverine environment: key findings from research with the cotton industry’. Occasional Paper No. 23/98. (Eds NJ Schofield, VE Edge) pp. 94–98. (Land and Water Resources Research and Development Corporation: Canberra, ACT)
Connolly RD, Carroll C, Frances J, Silburn DM, Simpson B, Freebairn DM (1999) A simulation study of erosion in the Emerald Irrigation Area. Australian Journal of Soil Research 37, 479–494.
| A simulation study of erosion in the Emerald Irrigation Area.Crossref | GoogleScholarGoogle Scholar |
Connolly RD, Kennedy IR, Silburn DM, Simpson B, Freebairn DM (2001) Simulating endosulfan transport in runoff from cotton farms in Australia with the GLEAMS model. Journal of Environmental Quality 30, 702–713.
| Simulating endosulfan transport in runoff from cotton farms in Australia with the GLEAMS model.Crossref | GoogleScholarGoogle Scholar | 1:CAS:528:DC%2BD3MXntFWrsLc%3D&md5=3c7a2657979c1cc0730c657fe964916aCAS | 11401260PubMed |
Constable GA, Hearn AB (1980) Irrigation for crops in sub-humid environment. I. The effect of irrigation on the growth and yield of soybean. Irrigation Science 2, 1–12.
| Irrigation for crops in sub-humid environment. I. The effect of irrigation on the growth and yield of soybean.Crossref | GoogleScholarGoogle Scholar |
CRDC and ACCRC (1999) ‘Proceedings of the Cotton Industry Water Balance Workshop.’ October 28–29 1999, Toowoomba, Qld. Prepared by Brian Hearn (CRDC), Helen Dugdale (CRDC), Nicky Schick (ACCRC). (Cotton Research and Development Corporation and the Australian Cotton CRC: Narrabri, NSW)
Dafny E, Silburn DM (2013) The hydrogeology of the Condamine River Alluvial Aquifer (Australia)—a critical review. Hydrogeology Journal
| The hydrogeology of the Condamine River Alluvial Aquifer (Australia)—a critical review.Crossref | GoogleScholarGoogle Scholar |
Dalgliesh NP, Foale MA (1998) ‘Soil matters. Monitoring soil water and nutrients in dryland farming.’ (Agricultural Production Systems Research Unit/CSIRO: Toowoomba, Qld)
Dalton P (2003) An investigation of in-field irrigation management practices to improve the efficiency of furrow irrigated cotton production systems. Milestone Report No. 3, Research and Development Program, Program 11, Rural Water Use Efficiency Initiative. (National Centre for Engineering in Agriculture, University of Southern Queensland/Dalton Consulting Engineers Pty Ltd: Toowoomba, Qld/Balwyn, Vic.)
Dalton P, Raine S, Broadfoot K (2001) Best management practices for maximising whole farm irrigation efficiency in the cotton industry. Final Report for CRDC Project NEC2C. National Centre for Engineering in Agriculture Publication 179707/2. University of Southern Queensland, Toowoomba, Qld.
Dowling AJ, Thorburn PJ, Ross PJ, Elliot PJ (1991) Estimation of infiltration and deep drainage in a furrow-irrigated sodic duplex soil. Australian Journal of Soil Research 29, 363–375.
| Estimation of infiltration and deep drainage in a furrow-irrigated sodic duplex soil.Crossref | GoogleScholarGoogle Scholar |
Dugan JT, Zelt RB (2000) ‘Simulation and analysis of soil-water conditions in the Great Plains and adjacent areas 1951–80.’ Water-Supply Paper No. 2427. (US Geological Survey: Reston, VA)
Dugdale H, Harris G, Neilsen J, Richards D, Roth G, Williams D (Eds) (2004) ‘WATERpak a guide for irrigation management in cotton.’ (Cotton Research and Development Corporation: Narrabri, NSW)
Duncan RA, Bethune MG, Thayalakumaran T, Christen EW, McMahon TA (2008) Management of salt mobilisation in the irrigated landscape – A review of selected irrigation regions. Journal of Hydrology 351, 238–252.
| Management of salt mobilisation in the irrigated landscape – A review of selected irrigation regions.Crossref | GoogleScholarGoogle Scholar |
Farbrother HG (1972) Field behaviour of Gezira clay under irrigation. Cotton Grower Review 49, 1–27.
Foley JL, Silburn DM (2013) Physical assessment of the regolith salt and water balance in the Lockyer Valley under irrigation., In ‘Implications of using purified recycled water as an adjunct to groundwater resources for irrigation in the Lockyer Valley’. Section 5. Technical Report No. 103. (Ed. L Wolf) (Urban Water Security Research Alliance: Brisbane, Qld) Available at: www.urbanwateralliance.org.au/
Foley JF, Rassam D, Silburn DM (2003) Conceptual designs for lysimetry on swelling clay soils. In ‘International Soil Tillage Research Organisation (ISTRO) 16th Triennial Conference’. 13–18 July 2003, Brisbane, Qld. pp. 429–434. (University of Queensland: Brisbane, Qld)
Foley JL, Tolmie PE, Silburn DM (2006) Improved measurement of conductivity on swelling clay soils using a modified disc permeameter method. Australian Journal of Soil Research 44, 701–710.
| Improved measurement of conductivity on swelling clay soils using a modified disc permeameter method.Crossref | GoogleScholarGoogle Scholar |
Foley JL, Silburn DM, Greve A (2010) Resistivity imaging across native vegetation and irrigated Vertosols of the Condamine catchment—a snapshot of changing regolith water storage. In ‘19th World Congress of Soil Science’. 1–6 August 2010, Brisbane, Qld. pp. 159–162. (International Union of Soil Sciences)
Foley JL, Greve A, Huth N, Silburn DM (2012) Comparison of soil conductivity measured by ERT and EM38 geophysical methods along irrigated paddock transects on Black Vertosol soils. In ‘Proceedings of 16th Agronomy Conference’. 14–18 October 2012, Armidale, NSW. (Ed. I Yunusa) (Australian Society of Agronomy, the Regional Institute: Gosford, NSW)
Gardner EA (1988) Soil water. In ‘Understanding soils and soil data’. Ch. 10. (Ed. IF Fergus) pp. 153–185. (Australian Society of Soil Science Inc. (Qld Branch): Brisbane, Qld)
Gardner EA, Coughlan KJ (1982) Physical factors determining soil suitability for irrigated crop production in the Burdekin–Elliot river area. Technical Report No. 20. Agricultural Chemistry Branch, Queensland Department of Primary Industries, Brisbane, Qld.
Goel PS, Datta PS, Rama Sangal SP, Kumar H, Bahadur P, Sabherwal PK, Tanwar BS (1975) Tritium tracer studies on groundwater recharge in the alluvial deposits of Indo-Gangetic Plains of Western U.P., Punjab and Haryana. In ‘Approaches and methodologies for development of groundwater resources. Proceedings of Indo-German Workshop’. pp. 309–322. (National Geophysical Research Institute: Hyderabad, India)
Goyne PJ, McIntyre GT (2003) Water use efficiency improvement program in Queensland’s cotton industry. In ‘Proceedings Beltwide Cotton Conference’. 6–10 January 2003, Nashville, TN. pp. 1740–1746. (National Cotton Council of America: Cordova, TN)
Grundy MJ, Silburn DM, Chamberlain T (2007) A risk framework for preventing salinity. Environmental Hazards 7, 97–105.
| A risk framework for preventing salinity.Crossref | GoogleScholarGoogle Scholar |
Gunawardena TA, McGarry D, Robinson JB, Silburn DM (2011) Deep drainage through Vertosols in irrigated fields measured with drainage lysimeters. Soil Research 49, 343–354.
| Deep drainage through Vertosols in irrigated fields measured with drainage lysimeters.Crossref | GoogleScholarGoogle Scholar |
Gunawardena TA, Foley JF, Harris M, Silburn DM, Wolf L (2013) Detailed groundwater monitoring after the 2011 flood. In ‘Implications of using purified recycled water as an adjunct to groundwater resources for irrigation in the Lockyer Valley’. Section 6. Technical Report No. 103. (Ed. L Wolf) (Urban Water Security Research Alliance: Brisbane, Qld)
Gurdak JJ, McMahon PB, Dennehy K, Qi SL (2009) ‘Water quality in the High Plains Aquifer, Colorado, Kansas, Nebraska, New Mexico, Oklahoma, South Dakota, Texas, and Wyoming, 1999–2004.’ Circular No. 1337. (U.S. Geological Survey: Reston, VA)
Harris G (2012) A decade of change in water productivity. In ‘The Australian cotton water story—A decade of research and development’. (Eds J Trindall, G Roth, S Williams, G Harris, D Wigginton) pp. 6–7. (Cotton Catchment Communities CRC Limited, Australian Cotton Research Institute: Narrabri, NSW) Available at: www.cottoncrc.org.au
Hearn AB (1998) Summer rains on Vertisol Plains: A review of cotton irrigation research in Australia. In ‘Water is gold. National Conference’. 19–21 May, Brisbane, Qld. (Irrigation Association, Australia: Sydney)
Hearn B (2000) The science of water balance: Why do we need to know? In ‘Proceedings of the 10th Australian Cotton Conference’. 16–18 August, Brisbane. pp. 351–360. (Australian Cotton Growers’ Research Association Inc.: Orange, NSW)
Hulme PJ, McKenzie DC, Abbott TS, MacLeod DA (1991) Changes in the physical properties of a Vertisol following an irrigation of cotton as influenced by the previous crop. Australian Journal of Soil Research 29, 425–442.
| Changes in the physical properties of a Vertisol following an irrigation of cotton as influenced by the previous crop.Crossref | GoogleScholarGoogle Scholar |
Hulugalle N, Weaver T (2000) Leaching in cracking clays. The Australian Cotton Grower 21, 61–63.
Hulugalle NR, Weaver TB, Ghadiri H (2005) A simple method for estimating the value of salt and nutrient leaching in irrigated Vertisols in Australia. Advances in Geoecology 36, 578–588.
Hulugalle NR, Weaver TB, Finlay LA (2010) Soil water storage and drainage under cotton-based cropping systems in a furrow-irrigated Vertisol. Agricultural Water Management 97, 1703–1710.
| Soil water storage and drainage under cotton-based cropping systems in a furrow-irrigated Vertisol.Crossref | GoogleScholarGoogle Scholar |
Hulugalle NR, Weaver TB, Finlay LA (2012) Soil water storage, drainage, and leaching in four irrigated cotton-based cropping systems sown in a Vertosol with subsoil sodicity. Soil Research 50, 652–663.
| Soil water storage, drainage, and leaching in four irrigated cotton-based cropping systems sown in a Vertosol with subsoil sodicity.Crossref | GoogleScholarGoogle Scholar |
Huth NI, Thorburn PJ, Radford BJ, Thornton CM (2010) Impacts of fertilisers and legumes on N2O and CO2 emissions from soils in subtropical agricultural systems: A simulation study. Agriculture, Ecosystems & Environment 136, 351–357.
| Impacts of fertilisers and legumes on N2O and CO2 emissions from soils in subtropical agricultural systems: A simulation study.Crossref | GoogleScholarGoogle Scholar | 1:CAS:528:DC%2BC3cXisFenurk%3D&md5=c3ccb7df6678ad299a168d7925523d98CAS |
ICID (2009) ‘Annual report 2009–10.’ (International Commission of Irrigation and Drainage)
Isbell RF (2002) ‘The Australian Soil Classification.’ Revised edn (CSIRO Publishing: Melbourne)
Jensen ME, Rangeley WR, Dieleman PJ (1990) Irrigation trends in world agriculture. In ‘Irrigation of agricultural crops’. (Eds BA Stewart, DR Nielsen) pp. 32–63. (American Society of Agronomy, Crop Science Society of America, Soil Science Society of America: Madison, WI)
Jolly ID, Williamson DR, Gilfedder M, Walker GR, Morton R, Robinson G, Jones H, Zhang L, Dowling TI, Dyce P, Nathan RJ, Nandakumar N, Clarke R, McNeil V (2001) Historical stream salinity trends and catchment salt balances in the Murray-Darling Basin, Australia. Marine and Freshwater Research 52, 53–63.
| Historical stream salinity trends and catchment salt balances in the Murray-Darling Basin, Australia.Crossref | GoogleScholarGoogle Scholar |
Keating BA, Gaydon D, Huth N, Probert ME, Verburg K, Smith CJ, Bond W (2002) Use of modelling to explore the water balance of dryland farming systems in the Murray-Darling Basin, Australia. European Journal of Agronomy 18, 159–169.
| Use of modelling to explore the water balance of dryland farming systems in the Murray-Darling Basin, Australia.Crossref | GoogleScholarGoogle Scholar |
Kellet JR, Pearce BR, Coram J, Herczeg AL, Wilkinson K, Cresswell RG (2004) Groundwater. In ‘Salinity investigations using airborne geophysics in the Lower Balonne area, Southern Queensland’. (Eds T Chamberlain, K Wilkinson) pp. 81–138. (Natural Resources and Mines, Bureau of Rural Sciences, CRC Landscapes, Environments and Mineral Exploration, National Action Plan for Salinity and Water Quality: Brisbane, Qld)
Kelly BFJ, Acworth RI, Greve AK (2011) Better placement of soil moisture point measurements guided by 2D resistivity tomography for improved irrigation scheduling. Soil Research 49, 504–512.
| Better placement of soil moisture point measurements guided by 2D resistivity tomography for improved irrigation scheduling.Crossref | GoogleScholarGoogle Scholar |
Kelly BFJ, Timms WA, Andersen MS, McCallum AM, Blakers RS, Smith R, Rau GC, Badenhop A, Ludowici K, Acworth RI (2013) Aquifer heterogeneity and response time: the challenge for groundwater management. Crop & Pasture Science 64, 1141–1154.
Kendy E, Gerard‐Marchant P, Walter MT, Zhang Y, Liu C, Steenhuis TS (2003) A soil‐water‐balance approach to quantify groundwater recharge from irrigated cropland in the north China plain. Hydrological Processes 17, 2011–2031.
| A soil‐water‐balance approach to quantify groundwater recharge from irrigated cropland in the north China plain.Crossref | GoogleScholarGoogle Scholar |
Kendy E, Zhang YQ, Liu CM, Wang JX, Steenhuis T (2004) Groundwater recharge from irrigated cropland in the North China Plain: Case study of Luancheng County, Hebei Province, 1949–2000. Hydrological Processes 18, 2289–2302.
| Groundwater recharge from irrigated cropland in the North China Plain: Case study of Luancheng County, Hebei Province, 1949–2000.Crossref | GoogleScholarGoogle Scholar |
Kurtzman D, Scanlon BR (2011) Groundwater recharge through Vertisols: irrigated cropland vs. natural land, Israel. Vadose Zone Journal 10, 662–674.
| Groundwater recharge through Vertisols: irrigated cropland vs. natural land, Israel.Crossref | GoogleScholarGoogle Scholar |
Lane WB (1979) Progress report on Condamine underground investigation to December 1978. Groundwater Branch Report, June 1979. Queensland Water Resources Commission, Brisbane, Qld.
Lin D, Jin M, Liang X, Zhan H (2013) Estimating groundwater recharge beneath irrigated farmland using environmental tracers fluoride, chloride and sulfate. Hydrogeology Journal 21, 1469–1480.
| Estimating groundwater recharge beneath irrigated farmland using environmental tracers fluoride, chloride and sulfate.Crossref | GoogleScholarGoogle Scholar |
Lu X, Jin M, van Genuchten MT, Wang B (2011) Groundwater recharge at five representative sites in the Hebei Plain, China. Ground Water 49, 286–294.
| Groundwater recharge at five representative sites in the Hebei Plain, China.Crossref | GoogleScholarGoogle Scholar | 1:CAS:528:DC%2BC3MXjtVahsbo%3D&md5=da495e0b5ba56d1ed28df8d3e0eed3deCAS | 20100294PubMed |
Marshall TJ (1944) Physical properties of Ord River soils. In ‘Soil surveys and other related investigations in the Ord River area East Kimberley 1944’. Technical Bulletin No. 80. (Ed. DAW Johnston) pp. 55–61. (Western Australian Department of Agriculture: South Perth, W. Aust.)
Mason WK, Constable GA, Smith RCG (1980) Irrigation for crops in sub-humid environment. II. The water requirement of soybeans. Irrigation Science 2, 13–22.
| Irrigation for crops in sub-humid environment. II. The water requirement of soybeans.Crossref | GoogleScholarGoogle Scholar |
McClymont DJ, Smith RJ (1996) Infiltration parameters from optimisation on furrow irrigation advance data. Irrigation Science 17, 15–22.
| Infiltration parameters from optimisation on furrow irrigation advance data.Crossref | GoogleScholarGoogle Scholar |
McHugh AD (2003) Sub-surface drip irrigation on a Vertosol under cotton: Increased water use efficiency and reduced off-farm environmental impacts. Report to Cotton Research and Development Corporation, Narrabri, NSW. Department of Natural Resources and Mines, Emerald, Queensland.
McHugh AD, Bhattari S, Lotz G, Midmore DJ (2008) Effects of subsurface drip irrigation rates and furrow irrigation for cotton grown on a vertisol on off-site movement of sediments, nutrients and pesticides. Agronomy for Sustainable Development 28, 507–519.
| Effects of subsurface drip irrigation rates and furrow irrigation for cotton grown on a vertisol on off-site movement of sediments, nutrients and pesticides.Crossref | GoogleScholarGoogle Scholar | 1:CAS:528:DC%2BD1cXhsFekurbI&md5=11bff34cc24b1d10edf4f0c7a0f255f8CAS |
McKenzie DC, Abbott TS, Higginson FR (1991) The effect of irrigated crop production on the properties of a sodic Vertisol. Australian Journal of Soil Research 29, 443–453.
| The effect of irrigated crop production on the properties of a sodic Vertisol.Crossref | GoogleScholarGoogle Scholar |
McMahon PB, Dennehy KF, Michel RL, Sophocleous MA, Ellett KM, Hurlbut DB (2003) ‘Water movement through thick unsaturated zones overlying the central High Plains aquifer, southwestern Kansas, 2000–2001.’ Water Resources Investigation Report No. 03-4171. (US Geological Survey: Reston, VA)
McMahon PB, Dennehy KF, Bruce BW, Bohlke JK, Michel RL, Gurdak JJ, Hurlbut DB (2006) Storage and transit time of chemicals in thick unsaturated zones under rangeland and irrigated cropland, High Plains, United States. Water Resources Research 42, W03413
| Storage and transit time of chemicals in thick unsaturated zones under rangeland and irrigated cropland, High Plains, United States.Crossref | GoogleScholarGoogle Scholar |
Montgomery JF (2003) An investigation of the soil water balance for irrigated cotton and water use efficiency. PhD Thesis, University of New England, Armidale, NSW, Australia.
Montgomery J, Wigginton D (2012) Benchmarking WUE in the Australian cotton industry. In ‘The Australian cotton water story—A decade of research and development’. (Eds J Trindall, G Roth, S Williams, G Harris, D Wigginton) pp. 8–10. (Cotton Catchments Communities CRC, Australian Cotton Research Institute: Narrabri, NSW) Available at: www.cottoncrc.org.au
Moss J, Gordon IJ, Zischke R (2001) Best management practices to minimise below root zone impacts of irrigated cotton. Final Report to the Murray–Darling Basin Commission (Project I6064), March 2001. Department of Natural Resources and Mines, Brisbane, Qld.
Payero JO, Harris G (2007) Benchmarking water management in the Australian cotton industry. Report submitted to the Cotton Catchment Communities CRC. Queensland Department of Primary Industries and Fisheries, Brisbane, Qld.
Pegler D, Foley JL, Silburn DM (2003) Design and construction of an equilibrium tension lysimeter for use in swelling clay soils. In ‘International Soil Tillage Research Organisation (ISTRO) 16th Triennial Conference’. Brisbane, Australia, 13–18 July 2003. pp. 891–896. (University of Queensland: Brisbane, Qld)
Prendergast JB (1995) Soil water bypass and solute transport under irrigated pasture. Soil Science Society of America Journal 59, 1531–1539.
| Soil water bypass and solute transport under irrigated pasture.Crossref | GoogleScholarGoogle Scholar | 1:CAS:528:DyaK2MXpvVSqsLg%3D&md5=68ed65727483b36b72843067a8cd1719CAS |
Pyke BA (2007) The impact of high adoption of Bollgard®II cotton on pest management in Australia. In ‘World Cotton Research Conference—4. Cotton: Nature’s High-Tech Fiber’. 10–14 September 2007, Lubbock, TX, USA. (International Cotton Advisory Committee: Washington, DC) Available at: http://wcrc.confex.com/wcrc/2007/techprogram/P1940.HTM
Radford BJ, Silburn DM, Forster B (2009) Soil chloride and deep drainage responses to land clearing for cropping at seven sites in central Queensland, northern Australia. Journal of Hydrology 379, 20–29.
| Soil chloride and deep drainage responses to land clearing for cropping at seven sites in central Queensland, northern Australia.Crossref | GoogleScholarGoogle Scholar | 1:CAS:528:DC%2BD1MXhsVanu77F&md5=1123abeaa3907d6b29fdf7445f9eed39CAS |
Raine SR, Foley JP (2001) Application systems for cotton irrigation—are you asking the right questions and getting the answers right? In ‘Growing opportunities. Irrigation 2001 National Conference’. 11–12 July 2001, Toowoomba, Qld. (Irrigation Association of Australia: Sydney)
Raine SR, Foley JP (2002) Comparing systems for cotton irrigation. The Australian Cottongrower 23, 30–35.
Reddy JM, Jumaboev K, Matyakubov B, Eshmuratov D (2013) Evaluation of furrow irrigation practices in Fergana Valley of Uzbekistan. Agricultural Water Management 117, 133–144.
| Evaluation of furrow irrigation practices in Fergana Valley of Uzbekistan.Crossref | GoogleScholarGoogle Scholar |
Ringrose-Voase AJ, Nadelko AJ (2013) Deep drainage in a Grey Vertosol under furrow-irrigated cotton. Crop & Pasture Science 64, 1155–1170.
Ringrose-Voase AJ, Young RR, Paydar Z, Huth NI, Bernardi AL, Cresswell HP, Keating BA, Scott JF, Stauffacher M, Banks RG, Holland JF, Johnston RM, Green TW, Gregory LJ, Daniells I, Farquharson R, Drinkwater RJ, Heidenreich S, Donaldson S (2003) Deep drainage under different land uses in the Liverpool Plains catchment., Report No. 3. NSW Agriculture, Orange, NSW
Roack DM, Healy DF (1998) ‘Quantification of deep percolation from two flood-irrigated alfalfa fields, Roswell Basin, New Mexico.’ Water Resources Investigation Report No. 98-4096. p. 32. (US Geological Survey: Reston, VA)
Robinson JB, Silburn DM, Rattray D, Freebairn DM, Biggs AJW, McClymont D, Christodoulou N (2010) Modelling shows that the high rates of deep drainage in parts of the Goondoola Basin in semi-arid Queensland can be reduced with changes to the farming systems. Australian Journal of Soil Research 48, 58–68.
| Modelling shows that the high rates of deep drainage in parts of the Goondoola Basin in semi-arid Queensland can be reduced with changes to the farming systems.Crossref | GoogleScholarGoogle Scholar |
Roth G (2006) ‘Towards sustainable and profitable water use in the Australian Cotton Industry.’ (Cotton Catchment Communities CRC: Narrabri, NSW)
Roth G, Harris G, Gillies M, Montgomery J, Wigginton D (2013) Water-use efficiency and productivity trends in Australian irrigated cotton: a review. Crop & Pasture Science 64, 1033–1048.
Scanlon BR, Reedy RC, Stonestrom DA, Prudic DE, Dennehy KF (2005) Impact of land use and land cover change on groundwater recharge and quality in the southwestern US. Global Change Biology 11, 1577–1593.
| Impact of land use and land cover change on groundwater recharge and quality in the southwestern US.Crossref | GoogleScholarGoogle Scholar |
Scanlon BR, Jolly IM, Sophocleous M, Zhang L (2007a) Global impacts of conversions from natural to agricultural ecosystems on water resources: Quantity versus quality. Water Resources Research 43, W03437
| Global impacts of conversions from natural to agricultural ecosystems on water resources: Quantity versus quality.Crossref | GoogleScholarGoogle Scholar |
Scanlon BR, Reedy RC, Tachovsky JA (2007b) Semiarid unsaturated zone chloride profiles: Archives of past land use change impacts on water resources in the southern High Plains, United States. Water Resources Research 43, W064239
| Semiarid unsaturated zone chloride profiles: Archives of past land use change impacts on water resources in the southern High Plains, United States.Crossref | GoogleScholarGoogle Scholar |
Scanlon BR, Reedy RC, Gates JB (2010a) Effects of irrigated agroecosystems: 1. Quantity of soil water and groundwater in the southern High Plains, Texas. Water Resources Research 46, W09537
Scanlon BR, Gates JB, Reedy RC, Jackson A, Bordovsky J (2010b) Effects of irrigated agroecosystems: 2. Quality of soil water and groundwater in the southern High Plains, Texas. Water Resources Research 46, W09538
Shaw RJ (1995) A unified soil property and sodicity model of salt leaching and water movement. PhD Thesis, University of Queensland, Brisbane, Qld, Australia.
Shaw RJ, Thorburn PJ (1985) Prediction of leaching fraction from soil properties, irrigation water and rainfall. Irrigation Science 6, 73–83.
| Prediction of leaching fraction from soil properties, irrigation water and rainfall.Crossref | GoogleScholarGoogle Scholar |
Shaw RJ, Yule DF (1978) The assessment of soils for irrigation, Emerald, Queensland. Agricultural Chemistry Branch, Technical Report No. 13. Queensland Department of Primary Industries, Brisbane, Qld.
Silburn DM, Montgomery J (2004) Deep drainage under irrigated cotton in Australia—A review. In ‘WATERpak: a guide for irrigation management in cotton’. Section 2.4. pp. 29–40. (Cotton Research and Development Corporation, Australian Cotton Cooperative Research Centre: Narrabri, NSW)
Silburn DM, Simpson B, Kennedy IR, Connolly RD (1997) Soil erosion in the Australian cotton industry. In ‘Proceedings Cropping Systems Forum’. 4 December 1997, Narrabri, NSW. (Eds I Rochester, H Dugdale, D Anthony) pp. 30–36. (Cotton Research and Development Corporation: Narrabri, NSW)
Silburn DM, Waters DK, Connolly RD, Simpson BW, Kennedy IR (1998) Techniques for stabilising soil erosion on cotton farms. In ‘Minimising the impact of pesticides on the riverine environment: key findings from research with the cotton industry’. Occasional Paper No. 23/98. (Eds NJ Schofield, VE Edge) pp. 99–105. (Land and Water Resources Research and Development Corporation: Canberra, ACT)
Silburn DM, Vervoort RW, Schick N (2004) ‘Deep drainage—so what?’ Part A. Report on the 2nd Northern Murray–Darling Water Balance Workshop. 19–20 November 2003, Narrabri, NSW. (online) (Cotton Research and Development Corporation: Narrabri, NSW)
Silburn DM, Robinson JB, Freebairn DF (2007) Why restore marginal cropland to permanent pasture? Land resource and environmental issues. Tropical Grasslands 41, 139–153.
Silburn DM, Biggs AJW, Owens JS, Tolmie PE, Foley JL, Cresswell RG (2008) Salinity in Queensland—hydrologic change from soils to catchments. In ‘2nd International Salinity Forum’. 31 March–3 April 2008, Adelaide, S. Aust. (CD-ROM) (Australian Government: Canberra, ACT)
Silburn DM, Cowie BA, Thornton CM (2009) The Brigalow Catchment Study revisited: effects of land development on deep drainage determined from non-steady chloride profiles. Journal of Hydrology 373, 487–498.
| The Brigalow Catchment Study revisited: effects of land development on deep drainage determined from non-steady chloride profiles.Crossref | GoogleScholarGoogle Scholar | 1:CAS:528:DC%2BD1MXot1eltb4%3D&md5=8df0b8036b613c8e84f31a1571b80881CAS |
Silburn DM, Foley JF, Robinson B, Biggs AWB (2010) Capturing our understanding of soil water balance and deep drainage under irrigation in models—a basis of design of efficient farming and for assessing impacts on catchments. Final Report for Project No. 2.01.02 to Cotton CRC and Cotton Research and Development Corporation. Cotton Research and Development Corporation, Narrabri, NSW.
Silburn DM, Tolmie PE, Biggs AJW, Whish JPM, French V (2011) Deep drainage rates of Grey Vertosols depend on land use in semi-arid subtropical regions of Queensland. Soil Research 49, 424–438.
| Deep drainage rates of Grey Vertosols depend on land use in semi-arid subtropical regions of Queensland.Crossref | GoogleScholarGoogle Scholar |
Silburn DM, Montgomery J, McGarry D, Gunawardena T, Foley J, Ringrose-Voase A, Nadelko (2013) ‘Deep drainage under irrigated cotton in Australia—A review.’ WATERpak Chapter 1.5. (Cotton Research and Development Corporation: Narrabri, NSW)
Smedema L (2000) ‘Irrigation-induced river salinization: Five major irrigated basins in the arid zone.’ (International Water Management Institute (IWMI): Colombo, Sri Lanka)
Smith AJ (2008) Rainfall and irrigation controls on groundwater rise and salinity risk in the Ord River Irrigation Area, northern Australia. Hydrogeology Journal 16, 1159–1175.
| Rainfall and irrigation controls on groundwater rise and salinity risk in the Ord River Irrigation Area, northern Australia.Crossref | GoogleScholarGoogle Scholar |
Smith RJ, Raine SR, Minkevich J (2005) Irrigation application efficiency and deep drainage potential under surface irrigated cotton. Agricultural Water Management 71, 117–130.
| Irrigation application efficiency and deep drainage potential under surface irrigated cotton.Crossref | GoogleScholarGoogle Scholar |
Soil Survey Staff (1999) ‘Soil Taxonomy: A basic system of soil classification for making and interpreting soil surveys.’ Agriculture Handbook. 2nd edn (USDA-Natural Resources Conservation Service: Washington, DC)
Sophocleous M (2005) Groundwater recharge and sustainability in the High Plains aquifer in Kansas, USA. Hydrogeology Journal 13, 351–365.
| Groundwater recharge and sustainability in the High Plains aquifer in Kansas, USA.Crossref | GoogleScholarGoogle Scholar | 1:CAS:528:DC%2BD2MXkt1Sgt74%3D&md5=f2da469e4fe13c272cbab2f6b2f81b48CAS |
Sukhija BS, Reddy DV, Nagabhushanam P, Hussain S, Giri VY, Patil DJ (1996) Environmental and injected tracers methodology to estimate direct precipitation recharge to a confined aquifer. Journal of Hydrology 177, 77–97.
| Environmental and injected tracers methodology to estimate direct precipitation recharge to a confined aquifer.Crossref | GoogleScholarGoogle Scholar | 1:CAS:528:DyaK28Xitl2lu7c%3D&md5=9dfa520fc4bcba3885dd1dc5855924b0CAS |
Tennakoon SB, Milroy SP (2003) Crop water use and water use efficiency on irrigated cotton farms in Australia. Agricultural Water Management 61, 179–194.
| Crop water use and water use efficiency on irrigated cotton farms in Australia.Crossref | GoogleScholarGoogle Scholar |
Thorburn PJ, Rose CW, Shaw RJ, Yule DF (1987) SODICS: a program to calculate solute dynamics in irrigated clay soils. In ‘Landscape, soil and water salinity. Bundaberg Regional Salinity Workshop’. April 1987, Bundaberg, Qld. Conference and Workshop Series QC87001. pp. B12-1–B12-9. (Queensland Department of Primary Industries: Brisbane, Qld)
Thorburn PJ, Rose CW, Shaw RJ, Yule DF (1990) Interpretation of solute profile dynamics in irrigated soils. I Mass balance approaches. Irrigation Science 11, 199–207.
| Interpretation of solute profile dynamics in irrigated soils. I Mass balance approaches.Crossref | GoogleScholarGoogle Scholar |
Tolmie PE, Silburn DM (2002) Estimates of deep drainage from a range of land uses in the Queensland Murray-Darling Basin. II. Using chloride profiles. In ‘FutureSoils. Australian Society of Soil Science National Conference’. University of Western Australia. (Eds D Williamson, C Tang, A Rate) pp. 170–171. (Australian Society of Soil Science Inc.: Perth, W. Aust.)
Tolmie PE, Silburn DM (2003) ‘Estimating deep drainage in the Queensland Murray-Darling Basin. Review of past research.’ Report No. QNRME04100. (Department of Natural Resources and Mines: Brisbane, Qld)
Tolmie PE, Silburn DM, Biggs AJW (2003) ‘Estimating deep drainage in the Queensland Murray-Darling Basin using soil chloride.’ Report No. QNRM03020. (Department of Natural Resources and Mines: Brisbane, Qld)
Tolmie PE, Silburn DM, Biggs AJW (2011) Deep drainage and soil salt loads in the Queensland Murray–Darling Basin using soil chloride. Comparison of land uses. Soil Research 49, 408–423.
| Deep drainage and soil salt loads in the Queensland Murray–Darling Basin using soil chloride. Comparison of land uses.Crossref | GoogleScholarGoogle Scholar |
Trindall J, Roth G, Williams S, Harris G, Wigginton D (Eds) (2012) ‘The Australian cotton water story—A decade of research and development.’ (Cotton Catchments Communities CRC, Australian Cotton Research Institute: Narrabri, NSW) Available at: www.cottoncrc.org.au
USSL (1954) ‘Diagnosis and improvement of saline and alkali soils.’ Handbook No. 60. (United States Department of Agriculture: Washington, DC)
Walker G (1998) Using soil water tracers to estimate recharge. In ‘The basics of recharge and discharge 7’. (Eds L Zhang, GR Walker) (CSIRO Publishing: Melbourne)
Walker GR, Jolly ID, Cook PG (1991) A new chloride leaching approach to the estimation of diffuse recharge following a change in land use. Journal of Hydrology 128, 49–67.
| A new chloride leaching approach to the estimation of diffuse recharge following a change in land use.Crossref | GoogleScholarGoogle Scholar |
Walker GR, Zhang L, Ellis TW, Hatton TJ, Petheram C (2002) Estimating impacts of changed land use on recharge: review of modelling and other approaches appropriate for management of dryland salinity. Hydrogeology Journal 10, 68–90.
| Estimating impacts of changed land use on recharge: review of modelling and other approaches appropriate for management of dryland salinity.Crossref | GoogleScholarGoogle Scholar |
Wang B, Jin M, Nimmo JR, Yang L, Wang W (2008) Estimating groundwater recharge in Hebei Plain, China under varying land use practices using tritium and bromide tracers. Journal of Hydrology 356, 209–222.
| Estimating groundwater recharge in Hebei Plain, China under varying land use practices using tritium and bromide tracers.Crossref | GoogleScholarGoogle Scholar | 1:CAS:528:DC%2BD1cXnslKksro%3D&md5=19b14fb2cf2bb6a4f998f2986093c5bbCAS |
Weaver TB, Hulugalle NR, Ghadiri H (2002) Measuring deep drainage and nutrient leaching under irrigated cotton. In ‘Proceedings of the 11th Australian Cotton Conference’. (Australian Cotton Growers’ Research Association: Orange, NSW)
Weaver TB, Hulugalle NR, Ghadiri H (2005) Comparing deep drainage estimated with transient and steady state assumptions in irrigated vertisols. Irrigation Science 23, 183–191.
| Comparing deep drainage estimated with transient and steady state assumptions in irrigated vertisols.Crossref | GoogleScholarGoogle Scholar |
Weaver TB, Hulugalle NR, Ghadiri H, Harden S (2013) Quality of drainage water under irrigated cotton in Vertisols of the lower Namoi Valley, New South Wales, Australia. Irrigation and Drainage 62, 107–114.
| Quality of drainage water under irrigated cotton in Vertisols of the lower Namoi Valley, New South Wales, Australia.Crossref | GoogleScholarGoogle Scholar |
Wigginton D (2012) Measuring to improve water storage efficiency. In ‘The Australian cotton water story—A decade of research and development’. (Eds J Trindall, G Roth, S Williams, G Harris, D Wigginton) pp. 13–15. (Cotton Catchments Communities CRC, Australian Cotton Research Institute: Narrabri, NSW) Available at: www.cottoncrc.org.au
Willis TM, Black AS (1996) Irrigation increases groundwater recharge in the Macquarie Valley. Australian Journal of Soil Research 34, 837–847.
| Irrigation increases groundwater recharge in the Macquarie Valley.Crossref | GoogleScholarGoogle Scholar |
Willis T, Black AS, Meyer WS (1997) Estimates of deep percolation beneath cotton in the Macquarie Valley. Irrigation Science 17, 141–150.
| Estimates of deep percolation beneath cotton in the Macquarie Valley.Crossref | GoogleScholarGoogle Scholar |
Yee Yet JS, Silburn DM (2003) Deep drainage estimates under a range of land uses in the Queensland Murray–Darling Basin using water balance modelling. Report No. QNRM03021. (Department of Natural Resources and Mines: Brisbane, Qld)
Young R, McLeod M (2001) Estimation of historic deep drainage under grassed woodland, lucerne pastures and cropped paddocks in the upper Liverpool Plains catchment using the SODICS model. In ‘Update of research in progress at the Tamworth Centre for Crop Improvement 2001’. (Ed. B Martin) pp. 107–110. (NSW Agriculture: Tamworth, NSW)
Young R, Huth N, Harden S, McLeod R (In press) Deep drainage and salt mobilisation under continuous cropping and native vegetation on alluvial clays in semi arid Eastern Australia. Soil Research In press.
Yule DF (1997) Irrigation. In ‘Sustainable crop production in the sub-tropics: an Australian perspective’. (Eds AL Clarke, PB Wylie) Information Series QI97035, Ch. 17. pp. 271–288. (Queensland Department of Primary Industries: Brisbane, Qld)
Zischke R, Gordon I (2000) Addressing the issues of root zone salinity and deep drainage under irrigated cotton. In ‘Proceedings of the 10th Australian Cotton Conference’. 16–18 August, Brisbane, Qld. pp. 371–377. (Australian Cotton Growers’ Research Association: Orange, NSW)