

Separation, detection and characterisation of engineered nanoparticles in natural waters using hydrodynamic chromatography and multi-method detection (light scattering, analytical ultracentrifugation and single particle ICP-MS)
Kim Proulx A and Kevin J. Wilkinson A BA Department of Chemistry, Biophysical Environmental Chemistry group, University of Montreal, C.P. 6128, succursale Centre-ville, Montreal, QC, H3C 3J7, Canada.
B Corresponding author. Email: kj.wilkinson@umontreal.ca
Environmental Chemistry 11(4) 392-401 https://doi.org/10.1071/EN13232
Submitted: 17 December 2013 Accepted: 2 May 2014 Published: 24 July 2014
Journal Compilation © CSIRO Publishing 2014 Open Access CC BY-NC-ND
Environmental context. The effects of engineered nanoparticles on the environment and on human health are difficult to evaluate largely because nanoparticles are so difficult to measure. The main problems are that concentrations are low and the engineered nanoparticles are often difficult to distinguish from the environmental matrices in which they are found. We report a separation technique that facilitates the detection of engineered nanoparticles in natural waters.
Abstract. Few analytical techniques are presently able to detect and quantify engineered nanoparticles (ENPs) in the environment. The major challenges result from the complex matrices of environmental samples and the low concentrations at which the ENPs are expected to be found. Separation techniques such as asymmetric flow field flow fractionation (AF4) and more recently, hydrodynamic chromatography (HDC) have been used to partly resolve ENPs from their complex environmental matrices. In this paper, HDC was first coupled to light scattering detectors in order to develop a method that would allow the separation and detection of ENPs spiked into a natural water. Size fractionated samples were characterised using off-line detectors including analytical ultracentrifugation (AUC), dynamic light scattering (DLS) and single particle inductively coupled plasma mass spectrometry (SP-ICP-MS). HDC was able to separate a complex mixture of polystyrene, silver and gold nanoparticles (radii of 60, 40, 20 and 10 nm) contained within a river water matrix. Furthermore, the feasibility of using HDC coupled to SP-ICP-MS was demonstrated by detecting 4 µg L–1 of a 20-nm (radius) nAg in a river water sample.
Introduction
Engineered nanoparticles (ENPs) represent a diverse group of manmade materials that have at least one dimension in the 1–100 nm size range. Owing to their nanoscale sizes, they have a large proportion of their atoms on the particle surface, often resulting in significant differences in their reactivity with respect to either the bulk materials or the dissolved ions.[1] ENPs such as carbon nanotubes, silver nanoparticles, quantum dots and metal oxides can now be found in thousands of commercial products (Project on Emerging Nanotechnologies, see http://www.nanotechproject.org/cpi, accessed 6 June 2014).
Owing to the growing and widespread use of ENPs, their impacts on the environment and on human health are growing concerns; however, environmental risk is poorly known[2] mainly because of the difficulties involved with quantifying exposure concentrations. Several groups have used regional-scale flow analyses to evaluate ENP loading to the environment and these studies have suggested that for nano silver (nAg), nano titanium dioxide (nTiO2) and nano zinc oxide (nZnO), current levels in the environment may already pose risks to aquatic organisms.[3] Nonetheless, modelling studies generally do not take into account transformations to the ENPs, including their removal by sedimentation or by dissolution. Indeed, only a few studies have attempted, with limited success, to detect ENPs in the environment (e.g. Tiede et al.,[4,5] Domingos et al.,[6] Kaegi et al.[7] and Weinberg et al.[8]).
Sensitive and robust techniques are thus urgently required to detect, characterise and quantify ENPs in natural samples. Key requirements include the ability to distinguish ENPs from the complex environmental matrices in which they are found and assurance that the technique itself does not induce dissolution, aggregation or agglomeration. To that end, several groups have coupled asymmetric flow field flow fractionation (AF4)[9–11] to various detectors, including inductively coupled plasma mass spectrometry (ICP-MS). The use of other promising techniques such as hydrodynamic chromatography (HDC) has been somewhat limited.[3–5] Like AF4, HDC separates particles on the basis of the particles’ diffusion coefficients, which are inversely related to their hydrodynamic diameters through the Stokes–Einstein equation.[12,13] In HDC, the stationary phase is a packed bed of non-porous and non-coated silica spheres that have been developed in order to minimise interactions with the sample. The column void volume can be considered to be a network of flow channels or capillaries in which a parabolic flow profile is established. In this manner, larger particles that cannot reach the surface of the beads are eluted faster[12] in a separation process that is, in principle, independent of particle density or particle composition.[5] Minimal sample preparation is required and in theory, minimal sample perturbation occurs during the passage of the sample through the HDC column.[12] As with AF4, it is possible to couple HDC to multiple detection techniques. Nonetheless, AF4 generally requires both greater technical expertise and longer run times and it can be limited by artefacts that occur due to interactions of the sample with the AF4 channel membrane.[12,14] Although only a few research groups have examined ENP detection using HDC, Tiede et al.[4] convincingly showed that HDC coupled to ICP-MS could be used to separate gold and silver nanoparticles from their dissolved ions.[4,5,12]
In this study, we have tested the hydrodynamic separation of several ENP size standards: gold (nAu), polystyrene (nPS) and silver (nAg) nanoparticles and their mixtures. Initially, techniques were optimised at environmentally high concentrations (2–100 mg L–1) in order to use the available on-line detectors (static (SLS) and dynamic light scattering (DLS)), which provide direct information on the radii of gyration (Rg) and the hydrodynamic radii (Rh) of the ENPs. Once the experimental parameters were well defined for the elution, off-line detection of HDC fractions were realised using DLS, analytical ultracentrifugation (AUC[15–17]) and single particle inductively coupled plasma mass spectrometry (SP-ICP-MS[18,19]) at lower ENP concentrations (200 µg L–1 to 3 mg L–1 for DLS and AUC and 0.1–2.0 µg L–1 for SP-ICP-MS). Finally, the direct coupling of the HDC column to SP-ICP-MS allowed the direct detection and characterisation of a nanosilver particle that was spiked into a river water sample at the environmentally relevant concentration of 4 µg L–1. The paper will demonstrate some of the advantages and disadvantages of using HDC for the separation of ENP in natural waters.
Experimental section
Reagents
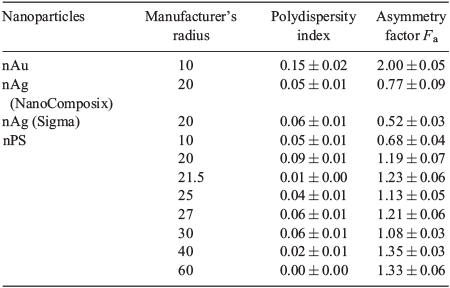
All reagents were prepared in Milli-Q water (Millipore, Billerica, MA, USA, R > 18 MΩ cm, organic carbon < 2 μg L–1). Sodium nitrate (Fluka, Basel, Switzerland, >99 %) was used to adjust the ionic strength of the eluent whereas sodium hydroxide (Sigma–Aldrich, SigmaUltra, St Louis, MO, USA) and nitric acid (Fisher Scientific, TraceSELECT Ultra, Waltham, MA USA) were used to adjust its pH. Sodium dodecyl sulfate (SDS, G-Biosciences, Biotechnology grade, St Louis, MO) and Triton X-100 (Sigma Triton X-100 solution BioUltra) were respectively added to the eluent as anionic and non-ionic surfactants. Except when specified, an eluent of 1 mM NaNO3, 0.0013 % w/w SDS, 0.0013 % w/w Triton X-100 at a pH of 7.5 (±0.2) was used (the motivation for this eluent composition has been provided in the Supplementary material, Table S1). Sodium azide (0.02 % w/w, Fisher Scientific) was added to solutions that were used to rinse the HDC column at the end of each experiment. Several types of nanoparticles (nPS, nAg, nAu) were used during the column optimisation (Table 1) and in order to evaluate the role of ENP composition on retention times. Samples were filtered over a 0.45-µm membrane (Millipore) in order to remove large aggregates and dust particles, before their injection into the HDC.

|
Hydrodynamic chromatography
The HDC column was a PL-PSDA cartridge, type 1 column with a separation range of 5 to 300 nm, a length of 80 cm and an internal diameter of 7.5 mm (Agilent Technologies Canada Inc., Mississauga, ON, Canada). An Agilent 1260 Infinity Bio-inert Quaternary HPLC fitted with an Agilent 1260 Infinity Standard Autosampler (Agilent) was used for the separations. A Dawn Heleos II detector (Wyatt Technologies, Santa Barbara, CA, USA) was employed to acquire the on-line SLS and DLS data. On-line DLS data reported in this paper were acquired at a scattering angle of 99°. Translational diffusion coefficients of the ENPs were determined from the exponential decay of an autocorrelation function, which was then used to calculate their hydrodynamic radii (Rh) based upon the Stokes–Einstein equation. In SLS, the particle’s radius of gyration is determined from the angular dependence of the scattered light (18 angles measured). For a spherical particle, the Rg is theoretically related to its hydrodynamic radius by Rg2 = (3/5)Rh2. For the particles studied here (radii of 10–60 nm), a linear order Zimm fit model was used to analyse the SLS data. For nAu and nAg, the difference between their refractive indices and that of water was too high to allow the angular dependence of the scattered light to be used to determine the Rg. Moreover, owing to the absence of a dependency of the scattered light on scattering angle, Rg could not be obtained for particles with radii below 10–15 nm.
All tubing was made of inert materials. An injection volume of 20 μL was employed as a compromise to obtain optimal sensitivity, peak widths and retention times (Supplementary material, Fig. S1) using a flow rate of 1.00 mL min–1 and a pressure of ~78 bar. pH measurements were made using a 744 Metroohm pH-meter (Metrohm, Riverview, FL, USA). An Infinity 1260 analytical scale fraction collector (Agilent Technologies Canada) was used to collect sample fractions for off-line analysis. Numerous calibration curves were prepared by analysing spiked nanoparticles in Milli-Q water and both blanks and standards were run frequently (before and after each batch of experiments) in order to monitor the analytical performance of the instruments.
Off-line particle characterisation
Data were also acquired from several off-line detectors, including an AUC, a second DLS instrument (Mobius, Wyatt Technologies, scattering angle of 171.5°) and an inductively coupled plasma mass spectrometer (PerkinElmer NexION 300X, Mississauga, ON, Canada) run mainly in single particle mode. AUC (Beckman Coulter, ProteomeLab XL-1, Indianapolis, IN, USA) was carried out by performing 100 to 150 interference scans (655 nm) per sample using a centrifugation speed of 5000 to 10 000 rpm (~1800–7300g) at 20 °C. Radii obtained from the AUC are sedimentation based radii (Stokes’ radii) that can be determined from Stokes’ law using known particle densities.
SP-ICP-MS experiments were carried out on triplicate samples using the following data acquisition parameters: 1 sweep per read; 20 000 reads per replicate; settling time of 0.1 ms and a dwell time of 3 ms. Nebulisation efficiency was determined from the sample flow rate (0.5 mL min–1) and the concentration (100 ng L–1), size (Rh = 30 nm) and density of the nAu (19 320 kg m–3) by analysing a standard solution of nAu with a known concentration.[20] The particle number concentration was obtained from the frequency of detected pulses and the calculated nebulisation efficiency.[21,22] Diluted suspensions were employed so that, statistically speaking, only single particles reached the mass spectrometer during any given measurement (dwell) time.[23] For example, sample fractions (75 µL) collected from the HDC column were generally diluted by a factor of 100 before SP-ICP-MS analysis (an additional dilution of ~500 occurred during ENP elution in the HDC column). A threshold limit of three standard deviations (3σ) above the background signal was set in order to discriminate between dissolved metal and pulses due to the ENPs.[21,23,24]
Means and standard deviations were determined from triplicate measurements. An analysis of variance was performed at P = 0.05 and where applicable, significant differences were identified using the Student–Newman–Keuls test, also at P = 0.05. Although all separations were run in triplicate, only a single representative chromatogram has been presented.
Results and discussion
ENP size determinations
Where possible, the manufacturer’s particle dimensions were verified for each of the ENP standards using SLS, DLS, AUC and SP-ICP-MS (Table 2). For SLS and DLS, radii were obtained from on-line measurements on diluted samples (~500× due to elution through the HDC column). AUC, DLS and SP-ICP-MS were performed off-line on standards (concentrations provided in Table 1) that did not pass through the HDC column (samples diluted to 0.1 μg L–1 for SP-ICP-MS). It must be emphasised that each of the detection techniques relies on different fundamental principles and provides slightly different values of radii (e.g. Rg, Rh, sedimentation or mass based R) such that results cannot be directly compared.[6] For example, when using DLS or SLS, radii (Rh or Rg) were often slightly larger than the radii provided by the manufacturer. In the literature, this effect is generally attributed to sample polydispersity because large particles will scatter much more light than smaller ones. Although this explanation may be valid for the offline DLS,[6,17] it is unlikely to be the unique explanation for the samples measured post-column (on line), where an important decrease in their polydispersity is expected because of their passage through the HDC column. AUC results gave (sedimentation) radii that were generally very close to the manufacturer’s radii. In that case, a small underestimation of particle sizes may have been due to an overestimation of the particle densities used to estimate particle sizes in the Stokes’ law calculations. Indeed, particle densities based upon the ENP core material were used without taking into account the outer shell stabilisers, which could result in a lower overall density and thus a larger calculated radius.[25] Finally, only metal based ENPs with radii >10–20 nm can be detected by SP-ICP-MS. For the nAg, the physical sizes determined by SP-ICP-MS were very close to the manufacturers’ nominal sizes.

|
Chromatographic evaluation of the ENP standards
Particle standards were first run individually. Visual analysis of the chromatographs (Supplementary material, Fig. S2) showed that peaks were symmetrical and narrow. Because only a single peak was obtained in each case, this is again strong evidence that the ENP standards were monodisperse, even after transport through the HDC column. Indeed, asymmetry factors (Fa) corresponding to the ratio of the back half-width of the peak to the front half-width of the peak taken at 10 % maximal intensity[26,27] were calculated (Table 3). Peak symmetries are considered to be excellent when they are between 0.95 and 1.05, and acceptable when in the ranges of 0.8–0.95 or 1.05–1.20. Polydispersity indices (standard deviation ÷ mean) that were obtained with the off-line DLS measurements were also provided. The data showed that the nAu was the least monodisperse of the ENPs. In addition to its intrinsic polydispersity, the larger asymmetry factor may have been due to its small nominal size, which results in slightly longer elution times. Nevertheless, it is possible to conclude that the standards were initially all very monodisperse and that they were able to pass through the column with relatively few interactions with the HDC stationary phase.
|
Column calibration
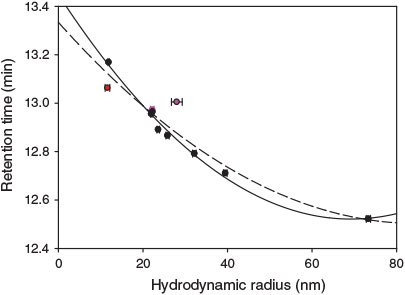
Calibration curves were prepared from the measured retention times and the measured hydrodynamic radii (on-line DLS) for the nPS (Fig. 1). An excellent polynomial fit of the experimental data was obtained over the size range of 20–80 nm (R2 = 0.98). The observed, non-linear relationship between the retention times and hydrodynamic radii is predicted by theory and because of the fact that the velocity profile of the eluent in the column is not flat but parabolic.[5,28] Retention times were extremely reproducible from one day to another (coefficient of variation of 0.10 %, n = 30).
|
Addition of the nAg and the nAu data to the nPS calibration curve (Fig. 1) weakened the R2 (0.91 as opposed to 0.98). Note, however, that when the manufacturers’ radii were employed for the calibration (Supplementary material, Fig. S3), the coefficients of determination were excellent, increasing to 0.98 and 0.97 when plotted against the respective retention times of the nPS and of all of the ENPs. The small decrease in the coefficient of determination that was observed when nAu and nAg were included likely resulted from the additional experimental error due to their DLS measurements. Indeed, it can be more difficult to measure the sizes of nAg and nAu as compared to nPS given that they are slightly more prone to dissolution or agglomeration. Light scattering measurements of the nAg gave radii that were slightly larger than nominal radii (Table 2) (and the other analytical techniques). The above data suggest that it may be necessary to use both retention times and independent particle sizing techniques (e.g. DLS, SLS and SP-ICP-MS) in order to get accurate determinations of ENP sizes.
Reproducibility analysis
Retention times and sizes were measured for 2 mg L–1 nAg samples (NanoComposix) at three different pH values over 18 days. No buffer was used, however pH measurements were verified before and after each experiment. The reproducibility of the retention times and the signal intensities are indicated by the standard deviations of repeated measurements whereas the Rh values provide an indicator of the consistency of the light scattering detector over time. Overall, retention times and particle radii were fairly constant, although at the longest equilibration times, a slight increase in retention times may have occurred, consistent with a measured decrease in Rh (Table 4). Given the general overall consistency in the analytical signals, it appears that a slight dissolution of the nAg was occurring (ENP sizes determined by DLS decreased slightly with time; Student–Newman–Keuls, P < 0.05), rather than there being any significant decrease in column reproducibility over time (≤18 days).

|
Role of sample concentration
The effect of ENP concentration on retention times, signal intensities and radii was also verified (Table 5). For concentrations between 5 and 500 mg L–1, signal intensity increased with ENP concentration, with relatively good correlation coefficients (R2 = 0.86, nAu; R2 = 0.98, nAg; R2 = 0.99, nPS). As above, no significant differences in retention times or HDC radii were observed with increasing concentration (one-way analysis of variance, ANOVA, P > 0.05), although an increase in the hydrodynamic radii was observed by DLS (nAg and nPS, Student–Newman–Keuls, P < 0.05). This result, in addition to the reproducibility analysis (above), indicated that light scattering was probably a more sensitive indicator of particle size changes than were retention times. Nevertheless, the observed trends in particle size with concentration were not consistent among the different particle types (cf. nAu and nAg) nor was there an obvious explanation for the observed decrease in particle size with increasing particle concentration (nAg, nPS). It is likely that the differences were due to data quality with increasing signal to noise; however, the relationship is not straightforward given that signal intensity depends on both particle size and particle composition. For the on-line light scattering detector, it was important to have an analytical signal that was substantially greater than the detector noise of ~0.02 V. However, whereas higher concentrations give a better signal to noise, the potential for ENP agglomeration also increases.

|
ENP mixtures
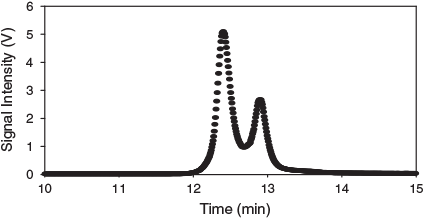
HDC and other size exclusion chromatographies do not have the same resolving capability as other chromatographic techniques. For example, it was not possible to completely resolve a 60-nm nPS from a 20-nm nAg (Fig. 2), although this may have been partly due to the high concentrations that were required to get good signal to noise from the light scattering detectors. At lower, more environmentally relevant concentrations, greater resolution of the ENPs may have been possible, because at the lower concentrations, less co-elution should occur due to the smaller peak widths.
|
The ability of the HDC to separate ENP mixtures of different types and sizes was further evaluated. First, 10 mg L–1 of each of four different ENPs were mixed and separated (Table 6a). Clearly, resolution of the four particle types was difficult to obtain; nAg showed the highest light scattering intensity, followed by nAu and then the two nPS. Particle size was also critical with the larger particles scattering more light than the smaller ones, which may explain the poor agreement between the nominal sizes and the Rh determined for the nAu and the nAg in Table 6a. The fact that the peaks were not clearly distinguishable (just enough to be able to observe four maximum intensities for the four ENP retention times) limited the ability of the DLS detector to determine particle radii. Clearly, the ability to resolve different particle sizes and compositions will depend greatly on the size and nature of the ENPs, the number of components and the sample matrix. When concentrations of the ENPs in the mixtures were varied in order to obtain similar peak intensities, more individual components could be resolved (Table 6b, c).

|
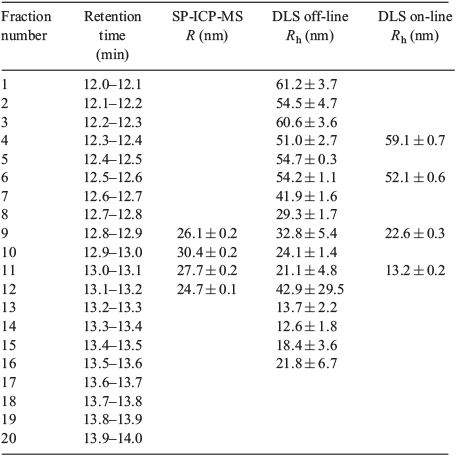
Fractions that were collected after the separation of two of the ENP mixtures (i.e. mixtures corresponding to Fig. 2 and Table 6b) were also analysed using the off-line detectors. In general, both the on-line and off-line light scattering confirmed that the separation of the ENP mixtures was occurring, as expected, in the order of decreasing particle size (Table S2, Table 7). Radii obtained using both the off-line and on-line DLS decreased with time, in agreement with HDC separation principles and in reasonable agreement with the calibration curve that was obtained for the individual particle standards (Fig. 1). SP-ICP-MS data were also consistent with those determined by DLS and retention times. Size distributions corresponding to the SP-ICP-MS data in Table 7 are provided in the Supplementary material (Fig. S3).
|
Analysis of a spiked natural river water sample
One of the major difficulties with detecting ENPs in natural waters results from the concomitant presence of natural nanoparticles, including fulvic and humic acids (~2–5 nm[29]) and natural colloids.[30] Furthermore, repartitioning of the ENPs may occur due to dissolution and agglomeration, among other processes.[7,31] In this context, the observation of Ag in the 1–100-nm size fraction can be due to the real presence of nAg or due to the adsorption or precipitation of Ag+ or nAg in the colloidal size fraction.[23] Similarly, dissolved Ag determined by SP-ICP-MS refers to Ag+ but also to any Ag complexes or Ag nanoparticles with diameters smaller than those that can be distinguished as ENPs (~20 nm using the method described above).[23,31,32]
HDC was used for the separation and detection of the four ENP mixtures (as per Table 6b) and the nAg–nPS mixture (as per Fig. 2) that were spiked into a natural water sample (0.45-µm filtered water taken from the Ste Rose River in Laval, QC, on 24 September 2013). The resulting HDC separations are presented in Tables 8 and 9. Once again, SP-ICP-MS data were obtained for the nAg; calculated SP-ICP-MS size distributions are provided in Figs S4 and S5. The control chromatogram (without the addition of ENPs) is presented in Fig. S6. The fractions collected after the separation of the spiked ENPs were analysed using off-line detection.

|

|
In the river water matrix, the HDC column was indeed able to acceptably separate both of the spiked ENP mixtures (Tables 8, 9). Indeed, both retention times (12.7 to 13.1 min) and off-line radii measurements (SP-ICP-MS, AUC) were similar to those detected in Milli-Q water and during the column calibration. The observation that the radii of nAg were in the range of their nominal sizes and their similarity to the results obtained in Milli-Q water suggested that little or no particle transformation (such as dissolution or agglomeration) was occurring in the natural water. Nonetheless, both on-line and off-line DLS gave radii that were larger than both the nominal particle sizes and sizes obtained by SP-ICP-MS and AUC (fractions 8–11, Tables 8, 9). Because the polydispersity of the sample fractions is reduced following their passage through the HDC column, it is likely that the differences can be attributed to either the different nature of the measurements (DLS, Rh; AUC, sedimentation R; SP-ICP-MS, physical radius of Ag atoms) or to the simplifying calculations used to calculate R (AUC and SP-ICP-MS did not include the citrate stabiliser or the adsorbed natural organic matter in either the density (AUC) or the mass (SP-ICP-MS) calculations). Given the difficulties involved with ENP size determinations, especially using such small (~75 µL) fraction volumes, it would be speculative to attempt to draw any firmer conclusions based upon the available data.
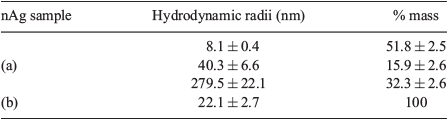
As expected, additional peaks were observed for the chromatograms that were acquired in the natural waters as compared to those obtained in Milli-Q water and it is highly likely that these peaks corresponded to natural colloidal particles. Peaks were also clearly identified in the control chromatograms (e.g. river water with no added ENP, Fig. S6). Although the presence of natural colloids has the ability to mask the ENP signal for non-specific detectors such as DLS or AUC, the HDC separation was clearly beneficial. For example, for a river water sample spiked with 200 μg L–1 of nAg, off-line DLS gave multiple peaks, none of which corresponded to the nAg. In contrast, when the sample was eluted through the HDC column, the background peaks were separated and the nAg (Table 10), with a radius of 22.1 ± 6.1 nm, could be identified in the eluent fractions collected between 12.9 and 13.1 min.
|
Detection of low nAg concentrations using HDC coupled to on-line SP-ICP-MS
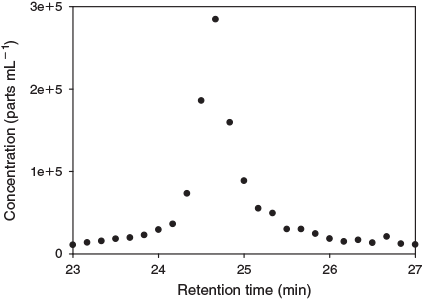
The work above was designed to demonstrate the capacity of the HDC to separate ENPs, the reproducibility of the technique and the role of matrix interferences. Clearly, ENPs will be found at much lower concentrations in environmental samples. Furthermore, samples are diluted by ~500× during HDC, depending upon particle size and elution volumes. As seen above, very few particle sizing techniques, including the AUC and the DLS, can be used for ENP concentrations below several hundred micrograms per litre, depending upon particle size and composition. Indeed, the only detector examined here that has the capacity to quantify ENPs at environmentally relevant concentrations is the ICP-MS, run in regular or single particle mode. Indeed, nAg has previously been detected at environmentally realistic concentrations using AF4 coupled to both ICP-MS[11] and SP-ICP-MS.[23] Therefore, the SP-ICP-MS was directly connected to the HDC column, in order to obtain information on the nAg concentrations and sizes. In this case, 4 µg L–1 of the nAg was spiked into the river water and the elution was performed using a reduced flow rate of 0.5 mL min–1. Owing to the lower flow rate (50 % of that used above) and the added tubing required for the coupling, the observed elution times were longer than those observed previously. Nonetheless, it was clear that an excellent signal to noise ratio could be obtained for the Ag signal seen at 24.7 min (Fig. 3, complete chromatogram shown in Fig. S7). By running the ICP-MS in single particle detection mode, a particle radius of 20.3 ± 0.6 nm was determined, consistent with the nominal size and with sizes determined previously by SP-ICP-MS, DLS and AUC (Table 2).
|
Conclusions
The capabilities of the HDC column to separate ENPs according to their sizes have been evaluated by measuring retention times and comparing calibrated times with sizes determined by several on-line (DLS, SLS) and off-line (DLS, AUC, SP-ICP-MS) detectors. Among the off-line detectors, the most straightforward and easy to use detector was the (backscattering) DLS detector (throughput of a few minutes per sample), even though the AUC (throughput of hours per sample) and SP-ICP-MS (throughput of minutes per sample) detectors gave results that were consistent with expected particle sizes. As a separation technique, HDC results were relatively straightforward to interpret, with ENP retention times increasing monotonically as a function of decreasing particle sizes. In addition, the HDC removed much of the background signal due to environmental colloids and natural organic matter, allowing for a reasonable separation of the ENPs. Although the use of on-line detectors provided the most direct confirmations of ENP size, the light scattering detectors were limited by their relatively high detection limits (i.e. minimum of ~200 µg L–1), especially when compared to expected environmental concentrations of the ENP. Given that the detection of ENPs in realistic natural samples will require sensitive detectors such as the ICP-MS or SP-ICP-MS, some initial results demonstrating clearly the ability of HDC-SP-ICP-MS to separate, characterise and quantify nAg in a river water sample have also been provided. Future developments will be required in order to optimise the technique for microgram or even nanogram per litre detection limits, especially for the smallest ENPs that are currently below the size detection limits of the SP-ICP-MS (diameters of 10–20 nm). Nonetheless, the HDC technique clearly has the capacity to complement more frequently used separation techniques, such as the AF4.
Supplementary material
Supplementary material includes some preliminary experiments to optimise the eluent composition and injection volumes, chromatograms for several size standards, a calibration curve, additional data on the separations, additional chromatograms and SP-ICPMS size distributions (see http://www.publish.csiro.au/?act=view_file&file_id=EN13232_AC.pdf).
Acknowledgements
Funding for this work is provided by the Natural Sciences and Engineering Research Council of Canada (NSERC Strategic Projects 430659; NSERC scholarship to K. Proulx), the Fonds de Recherche du Québec – Nature et Technologies and Environment Canada. A grant from the Canadian Water Network and the City of Calgary is also greatly appreciated. The authors are also grateful for the technical assistance from Madjid Hadioui, Leosvey Alessandra Diaz Lozada and Caroline Peyrot.
References
[1] M. F. Hochella, Nanoscience and technology the next revolution in the Earth sciences. Earth Planet. Sci. Lett. 2002, 203, 593.| Nanoscience and technology the next revolution in the Earth sciences.Crossref | GoogleScholarGoogle Scholar | 1:CAS:528:DC%2BD38XnvF2ksbw%3D&md5=684beb00eb2a6c772fe4a3b0690e32a0CAS |
[2] M. R. Wiesner, G. V. Lowry, P. Alvarez, D. Dionysiou, P. Biswas, Assessing the risks of manufactured nanomaterials. Environ. Sci. Technol. 2006, 40, 4336.
| Assessing the risks of manufactured nanomaterials.Crossref | GoogleScholarGoogle Scholar | 1:CAS:528:DC%2BD28XmvFWgsb4%3D&md5=658e5cb90b427a2f73b2955afad59c89CAS | 16903268PubMed |
[3] D. P. Rakcheev, A. Philippe, G. E. Schaumann, Hydrodynamic chromatography coupled with single particle-inductively coupled plasma mass spectrometry for investigating nanoparticles agglomerates. Anal. Chem. 2013, 85, 10 643.
| Hydrodynamic chromatography coupled with single particle-inductively coupled plasma mass spectrometry for investigating nanoparticles agglomerates.Crossref | GoogleScholarGoogle Scholar | 1:CAS:528:DC%2BC3sXhs1OkurnP&md5=06728bb042b93ebcf1baba0668ea8bf5CAS |
[4] K. Tiede, A. B. A. Boxall, X. Wang, D. Gore, D. Tiede, M. Baxter, H. David, S. P. Tear, J. Lewis, Application of hydrodynamic chromatography-ICP-MS to investigate the fate of silver nanoparticles in activated sludge. J. Anal. At. Spectrom. 2010, 25, 1149.
| Application of hydrodynamic chromatography-ICP-MS to investigate the fate of silver nanoparticles in activated sludge.Crossref | GoogleScholarGoogle Scholar | 1:CAS:528:DC%2BC3cXnvVSjs7o%3D&md5=c8248493cdfd4364934aac2c0b61f871CAS |
[5] K. Tiede, A. B. A. Boxall, D. Tiede, S. P. Tear, H. David, J. Lewis, A robust size-characterisation methodology for studying nanoparticle behaviour in ‘real’ environmental samples, using hydrodynamic chromatography coupled to ICP-MS. J. Anal. At. Spectrom. 2009, 24, 964.
| A robust size-characterisation methodology for studying nanoparticle behaviour in ‘real’ environmental samples, using hydrodynamic chromatography coupled to ICP-MS.Crossref | GoogleScholarGoogle Scholar | 1:CAS:528:DC%2BD1MXns1Slt78%3D&md5=2278c2cb21bd8c913e8fd0c87d1b47a9CAS |
[6] R. F. Domingos, M. A. Baalousha, Y. Ju-Nam, M. M. Reid, N. Tufenkji, J. R. Lead, G. G. Leppard, K. J. Wilkinson, Characterizing manufactured nanoparticles in the environment: multimethod determination of particle sizes. Environ. Sci. Technol. 2009, 43, 7277.
| Characterizing manufactured nanoparticles in the environment: multimethod determination of particle sizes.Crossref | GoogleScholarGoogle Scholar | 1:CAS:528:DC%2BD1MXlt1Sgsbw%3D&md5=4d8c462ebf85e0991b1c816166c5abe1CAS | 19848134PubMed |
[7] R. Kaegi, A. Voegelin, C. Ort, B. Sinnet, B. Thalmann, J. Krismer, H. Hagendorfer, M. Elumelu, E. Mueller, Fate and transformation of silver nanoparticles in urban wastewater systems. Water Res. 2013, 47, 3866.
| Fate and transformation of silver nanoparticles in urban wastewater systems.Crossref | GoogleScholarGoogle Scholar | 1:CAS:528:DC%2BC3sXlsVGhtLs%3D&md5=32518d69c9d9a270826a2c5b72f87cdbCAS | 23571111PubMed |
[8] H. Weinberg, A. Galyean, M. Leopold, Evaluating engineered nanoparticles in natural waters. TRAC – Trends in Analytical Chemistry. 2011, 30, 72.
| Evaluating engineered nanoparticles in natural waters.Crossref | GoogleScholarGoogle Scholar | 1:CAS:528:DC%2BC3cXhsF2mt7jE&md5=439ef2ab80e67242af20d2550cf4b28dCAS |
[9] S. A. Cumberland, J. R. Lead, Particle size distributions of silver nanoparticles at environmentally relevant conditions. J. Chromatogr. A 2009, 1216, 9099.
| Particle size distributions of silver nanoparticles at environmentally relevant conditions.Crossref | GoogleScholarGoogle Scholar | 1:CAS:528:DC%2BD1MXhsFSgsbvM&md5=158b224a35cfc215e0ec010da838713fCAS | 19647834PubMed |
[10] T. J. Cho, V. A. Hackley, Fractionation and characterization of gold nanoparticles in aqueous solution: asymmetric-flow field flow fractionation with MALS, DLS, and UV-Vis detection. Anal. Bioanal. Chem. 2010, 398, 2003.
| Fractionation and characterization of gold nanoparticles in aqueous solution: asymmetric-flow field flow fractionation with MALS, DLS, and UV-Vis detection.Crossref | GoogleScholarGoogle Scholar | 1:CAS:528:DC%2BC3cXhtVygs7vJ&md5=a71e894cbd213f9a1fce72048fafe1e1CAS | 20803340PubMed |
[11] M. E. Hoque, K. Khosravi, K. Newman, C. D. Metcalfe, Detection and characterization of silver nanoparticles in aqueous matrices using asymmetric-flow field flow fractionation with inductively coupled plasma mass spectrometry. J. Chromatogr. A 2012, 1233, 109.
| Detection and characterization of silver nanoparticles in aqueous matrices using asymmetric-flow field flow fractionation with inductively coupled plasma mass spectrometry.Crossref | GoogleScholarGoogle Scholar | 1:CAS:528:DC%2BC38Xkt1Cnt7s%3D&md5=fa07936c3b8ac9c5b5433d5f2f798c4aCAS | 22381889PubMed |
[12] E. P. Gray, T. A. Bruton, C. P. Higgins, R. U. Halden, P. Westerhoff, J. F. Ranville, Analysis of gold nanoparticle mixtures: a comparison of hydrodynamic chromatography (HDC) and asymmetrical flow field-flow fractionation (AF4) coupled to ICP-MS. J. Anal. At. Spectrom. 2012, 27, 1532.
| Analysis of gold nanoparticle mixtures: a comparison of hydrodynamic chromatography (HDC) and asymmetrical flow field-flow fractionation (AF4) coupled to ICP-MS.Crossref | GoogleScholarGoogle Scholar | 1:CAS:528:DC%2BC38XhtFOnu77O&md5=8d8f2ca8e84ec08d5b7d9d4b0dfff658CAS |
[13] A. M. Striegel, A. K. Brewer, Hydrodynamic chromatography. Annu. Rev. Anal. Chem. 2012, 5, 15.
| Hydrodynamic chromatography.Crossref | GoogleScholarGoogle Scholar | 1:CAS:528:DC%2BC38Xht1GmtLvN&md5=b248f0de25dad0b89970936ebbc153feCAS |
[14] K. J. Wilkinson, J. R. Lead (Eds), Environmental Colloids and Particles: Behaviour, Structure, and Characterisation 2007 (Wiley: Chichester, UK).
[15] I. Perevyazko, A. Vollrath, S. Hornig, G. M. Pavlov, U. S. Schubert, Characterization of poly(methyl methacrylate) nanoparticles prepared by nanoprecipitation using analytical ultracentrifugation, dynamic light scattering, and scanning electron microscopy. J. Polym. Sci. A Polym. Chem. 2010, 48, 3924.
| Characterization of poly(methyl methacrylate) nanoparticles prepared by nanoprecipitation using analytical ultracentrifugation, dynamic light scattering, and scanning electron microscopy.Crossref | GoogleScholarGoogle Scholar | 1:CAS:528:DC%2BC3cXpvFSktbw%3D&md5=f23308d34dd654d1ae078990fd6659deCAS |
[16] K. L. Planken, H. Colfen, Analytical ultracentrifugation of colloids. Nanoscale. 2010, 2, 1849.
| Analytical ultracentrifugation of colloids.Crossref | GoogleScholarGoogle Scholar | 1:CAS:528:DC%2BC3cXhtl2nu7fM&md5=3f4b5e3563a52605397ec3b4d143dc37CAS | 20820642PubMed |
[17] A. Bootz, V. Vogel, D. Schubert, J. Kreuter, Comparison of scanning electron microscopy, dynamic light scattering and analytical ultracentrifugation for the sizing of poly(butyl cyanoacrylate) nanoparticles. Eur. J. Pharm. Biopharm. 2004, 57, 369.
| Comparison of scanning electron microscopy, dynamic light scattering and analytical ultracentrifugation for the sizing of poly(butyl cyanoacrylate) nanoparticles.Crossref | GoogleScholarGoogle Scholar | 1:CAS:528:DC%2BD2cXhslWlu7g%3D&md5=862bb2ec6ba2c978652e7aab07b4c83fCAS | 15018998PubMed |
[18] F. Laborda, J. Jimenez-Lamana, E. Bolea, J. R. Castillo, Selective identification, characterization and determination of dissolved silver(I) and silver nanoparticles based on single particle detection by inductively coupled plasma mass spectrometry. J. Anal. At. Spectrom. 2011, 26, 1362.
| Selective identification, characterization and determination of dissolved silver(I) and silver nanoparticles based on single particle detection by inductively coupled plasma mass spectrometry.Crossref | GoogleScholarGoogle Scholar | 1:CAS:528:DC%2BC3MXnvVaqtro%3D&md5=573f705c12ca8eb90989c17d60dc11d3CAS |
[19] C. Degueldre, P. Y. Favarger, Colloid analysis by single particle inductively coupled plasma-mass spectroscopy: a feasibility study. Colloids Surf. A Physicochem. Eng. Asp. 2003, 217, 137.
| Colloid analysis by single particle inductively coupled plasma-mass spectroscopy: a feasibility study.Crossref | GoogleScholarGoogle Scholar | 1:CAS:528:DC%2BD3sXjsVWhurk%3D&md5=5cca14f0ea5faf80356a6364d532d449CAS |
[20] M. Hadioui, C. Peyrot, K. J. Wilkinson, Improvements to single particle ICP-MS by the on-line coupling of ion exchange resins. Anal. Chem. 2014, 86, 4668.
| Improvements to single particle ICP-MS by the on-line coupling of ion exchange resins.Crossref | GoogleScholarGoogle Scholar | 1:CAS:528:DC%2BC2cXmsVGlu78%3D&md5=2ebb5f2bb6b95ab80e948efa62e917c1CAS | 24745850PubMed |
[21] H. E. Pace, N. J. Rogers, C. Jarolimek, V. A. Coleman, E. P. Gray, C. P. Higgins, J. F. Ranville, Single particle inductively coupled plasma-mass spectrometry: a performance evaluation and method comparison in the determination of nanoparticle size. Environ. Sci. Technol. 2012, 46, 12 272.
| Single particle inductively coupled plasma-mass spectrometry: a performance evaluation and method comparison in the determination of nanoparticle size.Crossref | GoogleScholarGoogle Scholar | 1:CAS:528:DC%2BC38XpvFehu7g%3D&md5=2c959666a930cc02c7505c4a3ade3decCAS |
[22] H. E. Pace, N. J. Rogers, C. Jarolimek, V. A. Coleman, C. P. Higgins, J. F. Ranville, Determining transport efficiency for the purpose of counting and sizing nanoparticles via single particle inductively coupled plasma mass spectrometry. Anal. Chem. 2011, 83, 9361.
| Determining transport efficiency for the purpose of counting and sizing nanoparticles via single particle inductively coupled plasma mass spectrometry.Crossref | GoogleScholarGoogle Scholar | 1:CAS:528:DC%2BC3MXhsVCrsLvO&md5=d3106fbeaa0633f88e64814967a64db4CAS | 22074486PubMed |
[23] D. M. Mitrano, E. K. Lesher, A. Bednar, J. Monserud, C. P. Higgins, J. F. Ranville, Detecting nanoparticulate silver using single-particle inductively coupled plasma-mass spectrometry. Environ. Toxicol. Chem. 2012, 31, 115.
| Detecting nanoparticulate silver using single-particle inductively coupled plasma-mass spectrometry.Crossref | GoogleScholarGoogle Scholar | 1:CAS:528:DC%2BC3MXhs1yktr7E&md5=9234fb3e71b09355b5b281b35d380b3dCAS | 22012920PubMed |
[24] B. Franze, I. Strenge, C. Engelhard, Single particle inductively coupled plasma mass spectrometry: evaluation of three different pneumatic and piezo-based sample introduction systems for the characterization of silver nanoparticles. J. Anal. At. Spectrom. 2012, 27, 1074.
| Single particle inductively coupled plasma mass spectrometry: evaluation of three different pneumatic and piezo-based sample introduction systems for the characterization of silver nanoparticles.Crossref | GoogleScholarGoogle Scholar | 1:CAS:528:DC%2BC38XosFSksb4%3D&md5=f2cef28056b5117f09af89e81bded468CAS |
[25] D. Mahl, J. Diendorf, W. Meyer-Zaika, M. Epple, Possibilities and limitations of different analytical methods for the size determination of a bimodal dispersion of metallic nanoparticles. Colloids Surf. A Physicochem. Eng. Asp. 2011, 377, 386.
| Possibilities and limitations of different analytical methods for the size determination of a bimodal dispersion of metallic nanoparticles.Crossref | GoogleScholarGoogle Scholar | 1:CAS:528:DC%2BC3MXisVKqtL8%3D&md5=1aba8d1413c753177594a162f1d849d6CAS |
[26] J. W. Dolan, Why do Peaks Tail? 2003 (BASi Northwest Laboratory: McMinnville, OR, USA). Available at http://www.chromatographyonline.com/lcgc/data/articlestandard/lcgceurope/382003/69793/article.pdf [Verified 6 June 2014].
[27] L. R. Snyder, J. J. Kirkland, J. L. Glajch, Practical HPLC Method Development 1997 (Wiley: New York).
[28] H. Small, M. A. Langhorst, Hydrodynamic chromatography. Anal. Chem. 1982, 54, 892A.
| Hydrodynamic chromatography.Crossref | GoogleScholarGoogle Scholar | 1:CAS:528:DyaL38XksVCrsLo%3D&md5=3b25ba0a99f2f64db6625c161bfeafdfCAS |
[29] J. R. Lead, K. J. Wilkinson, S. Balnois, B. J. Cutak, C. K. Larive, S. Assemi, R. Beckett, Diffusion coefficients and polydispersities of the Suwannee River fulvic acid: comparison of fluorescence correlation spectroscopy, pulsed-field gradient nuclear magnetic resonance, and flow field-flow fractionation. Environ. Sci. Technol. 2000, 34, 3508.
| Diffusion coefficients and polydispersities of the Suwannee River fulvic acid: comparison of fluorescence correlation spectroscopy, pulsed-field gradient nuclear magnetic resonance, and flow field-flow fractionation.Crossref | GoogleScholarGoogle Scholar | 1:CAS:528:DC%2BD3cXks1Wgurs%3D&md5=8f88bb7bf61017aa91057db803764a13CAS |
[30] J. R. Lead, K. J. Wilkinson, Aquatic colloids and nanoparticles: current knowledge and future trends. Environ. Chem. 2006, 3, 159.
| Aquatic colloids and nanoparticles: current knowledge and future trends.Crossref | GoogleScholarGoogle Scholar | 1:CAS:528:DC%2BD28Xms1ersL0%3D&md5=f74241c0b96f561140b9a29645c4cd0fCAS |
[31] M. Hadioui, S. Leclerc, K. J. Wilkinson, Multimethod quantification of Ag+ release from nanosilver. Talanta 2013, 105, 15.
| Multimethod quantification of Ag+ release from nanosilver.Crossref | GoogleScholarGoogle Scholar | 1:CAS:528:DC%2BC3sXmt1WjurY%3D&md5=a2cd9d269a709af1c2d216816cd619e6CAS | 23597981PubMed |
[32] J. Tuoriniemi, G. Cornelis, M. Hassellov, Size discrimination and detection capabilities of single-particle ICPMS for environmental analysis of silver nanoparticles. Anal. Chem. 2012, 84, 3965.
| Size discrimination and detection capabilities of single-particle ICPMS for environmental analysis of silver nanoparticles.Crossref | GoogleScholarGoogle Scholar | 1:CAS:528:DC%2BC38XltVyrsr4%3D&md5=db0f4db85739ea46a260f418e658aab0CAS | 22483433PubMed |