

Foliar trait contrasts between African forest and savanna trees: genetic versus environmental effects
Franziska Schrodt A O , Tomas F. Domingues B P , Ted R. Feldpausch A Q , Gustavo Saiz C , Carlos Alberto Quesada D , Michael Schwarz E , F. Yoko Ishida D F , Halidou Compaore G , Adamo Diallo H , Gloria Djagbletey I , Fidele Hien G , Bonaventure Sonké K , Herman Toedoumg K , Loius Zapfack K , Pierre Hiernaux J , Eric Mougin J , Michael. I. Bird L , John Grace B , Simon L. Lewis A M , Elmar M. Veenendaal N and Jon Lloyd F R SA School of Geography, University of Leeds, LS2 9JT, UK.
B School of Geosciences, University of Edinburgh, EH8 9XP, Scotland, UK.
C Karlsruhe Institute of Technology, Institute of Meteorology and Climate Research, 82467, Garmisch-Partenkirchen, Germany.
D Instituto Nacional de Pesquisas da Amazonia, Manaus, Cx Postal 2223 – CEP 69080-971, Brazil.
E Fieldwork Assistance, PSF 101022, 07710, Jena, Germany.
F School of Tropical and Marine Sciences and Centre for Terrestrial Environmental and Sustainability Sciences, James Cook University, Cairns, Qld 4870, Australia.
G Institut de l’Environnement et de Recherches Agricoles, 04 BP 8645, Ouagadougou, Burkina Faso.
H Centre National des Semences Forestières, BP 2682, Ouagadougou, Burkina Faso.
I Ecosystem and Climate Change Division, Forestry Research Institute of Ghana, PO Box UP 63 KNUST Kumasi, Ghana.
J Géosciences Environnement Toulouse, Observatoire Midi-Pyrénées, 14, avenue Edouard Belin - 31400 Toulouse, France.
K Plant Systematic and Ecology Laboratory, Department of Biology, Higher Teachers’ Training College, University of Yaounde, PO Box 047, Yaounde Cameroon.
L School of Earth and Environmental Sciences and Centre for Terrestrial Environmental and Sustainability Sciences, James Cook University, Cairns, Qld 4870, Australia.
M Department of Geography, University College London, WC1E 6BT, UK.
N Centre for Ecosystem Studies, University of Wageningen, PO Box 47, 6700AA, Wageningen, Netherlands.
O Present address: Max Planck Institute for Biogeochemsitry, Postfach 10 0164 , 07701 Jena, Germany and iDiv, German Centre for Integrative Biodiversity Research, Halle-Jena-Leipzig, Deutscher Platz 5e,04103 Leipzig, Germany.
P Present address: Universidade de São Paulo, Faculdade de Filosofia Ciências e Letras de Ribeirão Preto, Av Bandeirantes, 3900 , CEP 14040-901 , Bairro Monte Alegre , Ribeirão Preto, SP, Brazil.
Q Present address: College of Life and Environmental Sciences, University of Exeter, EX4 4RJ, UK.
R Department of Life Sciences, Imperial College London, Silwood Park Campus, Buckhurst Road, Ascot, SL6 7PY, UK.
S Corresponding author. Email: jonathan.lloyd@imperial.ac.uk
Functional Plant Biology 42(1) 63-83 https://doi.org/10.1071/FP14040
Submitted: 31 January 2014 Accepted: 9 July 2014 Published: 6 November 2014
Journal Compilation © CSIRO Publishing 2015 Open Access CC BY-NC-ND
Abstract
Variations in leaf mass per unit area (Ma) and foliar concentrations of N, P, C, K, Mg and Ca were determined for 365 trees growing in 23 plots along a West African precipitation gradient ranging from 0.29 to 1.62 m a–1. Contrary to previous studies, no marked increase in Ma with declining precipitation was observed, but savanna tree foliar [N] tended to be higher at the drier sites (mass basis). Generally, Ma was slightly higher and [N] slightly lower for forest vs savanna trees with most of this difference attributable to differences in soil chemistry. No systematic variations in [P], [Mg] and [Ca] with precipitation or between trees of forest vs savanna stands were observed. We did, however, find a marked increase in foliar [K] of savanna trees as precipitation declined, with savanna trees also having a significantly lower [K] than those of nearby forest. These differences were not related to differences in soil nutrient status and were accompanied by systematic changes in [C] of opposite sign. We suggest an important but as yet unidentified role for K in the adaption of savanna species to periods of limited water availability; with foliar [K] being also an important factor differentiating tree species adapted to forest vs savanna soils within the ‘zone of transition’ of Western Africa.
Additional keywords: foliar cations, leaf mass per unit area, leaf physiology, nitrogen, phenology, phosphorus, potassium, plant functional traits, tropical, West Africa, zone of transition.
Introduction
Forest ( ) and savanna (
 ) constitute the two major biomes of the tropics (Walter and Mueller-Dombois 1971). Typically differing in stand structure, a second major difference between and is their species composition, with little overlap in woody plant taxa even when growing in close proximity (Torello-Raventos et al. 2013). As well as trees typically having trait characteristics associated with the tolerance and/or survival of the strongly pyrogenic regimes to which they are often exposed – for example, a greater bark thickness (Hoffmann and Franco 2003; Ratnam et al. 2011) numerous other vs trait differences typically exist (Ratnam et al. 2011). For example, as may be expected for trees growing in water-limited high-light environments, tropical savanna species have amongst the highest leaf mass per unit area (Ma) worldwide (Poorter et al. 2009). Indeed, even when growing in the same environment, the typically higher Ma of species (Hoffmann et al. 2005b) has been cited as one characteristic of savanna trees that sets them apart from their proximally-growing forest-associated counterparts (Ratnam et al. 2011). Other systematic differences between forest and savanna trees have also been noted, for example, lower mass based nitrogen, [N]m, and phosphorus, [P]m, for savanna trees as well as differences in root-shoot ratios (Hoffmann and Franco 2003) and other structural/hydraulic properties (Gotsch et al. 2010).
Nevertheless, to date, our knowledge of non-fire associated trait differences is based almost entirely on phylogenetically controlled contrasts between gallery-forest and savanna species in the Cerrado Region of Brazil (Hoffmann and Franco 2003; Hoffmann et al. 2005a; Hao et al. 2008; Rossatto et al. 2009; Gotsch et al. 2010; Hoffmann et al. 2012). It is unclear to what extent the observed differences apply to other regions of the planet.
It is well established that for savanna trees physiological traits may vary with precipitation regime. For example, both Buckley et al. (2002) and Cernusak et al. (2011) reported an increase in area based foliar nitrogen concentrations, [N]a, and Ma with increasing aridity for various Eucalyptus savanna species growing along a precipitation transect in the Australian Northern Territory. This is consistent with theory that suggests that [N]a will increase with declining water availability and increasing irradiance (Buckley et al. 2002), which is also seemingly the case in general (Wright et al. 2001, 2005). However, for Ma at least, such a precipitation effect may also depend on leaf habit with a decline in Ma with increasing rainfall not observed for deciduous species when examined on a global scale (Wright et al. 2005).
Evergreen vs deciduous species of the ‘dry-tropics’ (typically savanna regions) also typically show differences in leaf osmotic potential with evergreen ‘dry-tropical’ species typically having leaves operating at more negative osmotic potentials than those of their deciduous counterparts (Bartlett et al. 2012). A need for different concentrations of osmotically important ions such as potassium (Leigh and Wyn Jones 1984) might also reasonably be inferred, with higher [K] in the leaves of evergreen trees compared with their deciduous counterparts under identical edaphic and climatic growing conditions thus anticipated. Any such variations in foliar cation concentrations should also be related to variations in absolute carbon content (Poorter and Villar 1997; Patiño et al. 2012) potentially linking this trade-off to variations in Ma (Fyllas et al. 2012).
Here we report on variations in Ma as well as foliar nitrogen, phosphorus, carbon, potassium, magnesium and calcium concentrations along a precipitation transect in West Africa for which data on soil properties and leaf photosynthetic characteristics have already been presented (Domingues et al. 2010; Saiz et al. 2012). This data, collected within the ecotonal area of this transect where both savanna and forest exist in discrete patches – the so called ‘zone of transition’ (ZOT) – is also compared with a similar forest and savanna foliar trait dataset collected some 1000 km away in an independently replicated ZOT located in Cameroon. Specific questions addressed are as follows.
-
Are the previously well documented differences between leaf traits of gallery forest vs savanna species for Central Brazil also observed within African ZOT?
-
If (1) is true, to what extent are these contrasts due to inherent (genetic) differences as opposed to differing soil physical and chemical properties for forest vs. savanna vegetation formations types?
-
Are West African savanna species characterised by increased Ma and Na as precipitation declines?
-
Given their likely role as osmotica, are there variations in foliar cation concentrations associated with variations in precipitation and/or the transition from savanna to forest within ZOT?
Materials and methods
This dataset derives from ten 1.00 (100 × 100 m) and four 0.25 ha (50 × 50 m) permanent sampling plots which were established as part of the Tropical Biomes in Transition (TROBIT) project in August to September 2006 (Ghana) and October–December 2007 (Cameroon). For further details on plot locations, climate and soil characteristics see Table S1.1 and Fig. S1.1, available as Supplementary Material to this paper.
All field campaigns were conducted towards the end of the wet season. Plot locations were selected according to the following criteria: characteristic of the potential natural vegetation of the region; as low direct anthropogenic disturbance (in particular wood felling and arable agriculture) as possible; low altitudinal variation and no obvious hydrological differences. Further details are provided by Torello-Raventos et al. (2013).
The plots in Ghana, Boabeng-Fiema (BFI) Asukese (ASU) and Kogyae (KOG), were located in the transitional zone between dry semi-deciduous forest and the Guinea savanna. They experience an average dry season of 5 months duration (this being defined as the number of months with an average total precipitation of 100 mm or less) and an average annual rainfall of 1.21 m at ASU to 1.29 m at BFI (Hijmans et al. 2005).
The central African field sites (MDJ) are clustered in the Mbam Djerem National Park located in central Cameroon. This park covers 1765 km2, and was established in 2000, forming part of the 4165 km2 ‘Reserve de Faune de Pangar et Djerem’. Apart from local fishing and poaching, the park is relatively undisturbed due to low human population density in its surroundings. The dry season lasts for 4 months with an average annual rainfall around 1.65 m (Hijmans et al. 2005).
Species identification and classification
Leaf habit ( )
)
Phenology was assembled using sources in the literature and expert knowledge. Trees were categorised as being deciduous (trees remain bare until leaf flush is induced by re-hydration), brevi-deciduous (short bare period in the dry season followed by leaf flush), semi-deciduous (trees losing old foliage as growth of new leaves starts) or evergreen (trees are never leafless but flush or shed leaves in regular periods or continuously throughout the year).
Vegetation formation type affiliation ( )
)
Based on the ordination study by Torello-Raventos et al. (2013) sites were first grouped into one of either the forest or savanna vegetation domains on the basis of both floristics and structure, as detailed further in work by Veenendaal et al. (2014). Each species sampled was also classed as typically affiliated with either forest or savanna vegetation formation types using plot locality information for each species from Torello-Raventos et al. (2013), local expert knowledge and habitat information from local floras and the African Plant Database (http://www.ville-ge.ch/musinfo/bd/cjb/africa/recherche.php, accessed 23 July 2012).
Leaf sampling
Traits were assessed on an individual basis on at least 10 individuals with a diameter at breast height (1.3 m) greater than 0.1 m within each 1 ha plot. Trees were further selected on the basis that climbing the tree or cutting the branch from the ground could retrieve sun-exposed top-canopy branches. For each tree, a branch was harvested from the top canopy as described in work by Lloyd et al. (2010).
Sample preparation and analysis locations
Sample preparation was undertaken at the University of Leeds (UK). Leaf samples not used for the determination of Ma were dried as described above. About 20 g DW subsamples were then taken for the determination of foliar nutrients and isotopes. In order to prepare the leaf samples for these analyses, the main vein and petiole of each leaf were removed before drying and subsamples ground through a 1.0 mm (20 mesh) sieve.
Leaf mass per unit area (Ma)
The ratio of fresh, one-sided area of a leaf to its DW was obtained by separating at least 10 healthy adult leaves from the bulk leaf sampled from each branch. Each leaf was then scanned using a flatbed scanner attached to a laptop as fast as possible after harvesting in the field. Where scanning on the day of collection was impossible due to logistic reasons, leaves were stored in tightly sealed plastic bags under cool and dark conditions for a maximum of 2 days to avoid changes in the leaf area. The surface area of the leaf-scans was subsequently analysed on an individual basis using WinFOLIA (Regent Instruments Inc., Ottawa, Canada). The scanned leaves were then oven-dried to constant weight at 70°C for ~24 h to prevent enzymatic decomposition, and their dry mass determined after cooling in a desiccator. Where this was not possible due to logistical reasons, leaves were air-dried in the field and oven-dried as soon as possible.
Carbon and nitrogen determinations
Foliar nitrogen [N]m and carbon [C]m in the bulk leaf samples were determined on 15–30 mg of the ground plant material using elemental analysis (EURO EA CHNSO analyser, HEKAtech GbhB, Wegberg, Germany).
Cation and phosphorus determinations
Foliar cations (calcium, potassium and magnesium) and phosphorus in the ground samples were determined by inductively coupled plasma optical emissions spectrometry (ICP-OES) (Optima 5300DV, PerkinElmer, Shelton, CT, USA) following acid digestion (Lloyd et al. 2010).
Soil physical and chemical analyses
Soil sampling and laboratory analyses of the soil samples reported were performed by the University of Leeds, UK, using standard protocols (Quesada et al. 2010, 2011). In brief, across each plot, five soil cores up to 2 m depth (substrate permitting) were sampled in addition to one soil pit, which was dug to 2 m depth. Average values for 0–0.3 m depth are reported here (i.e. six samples per plot). Soil carbon and nitrogen were determined using an automated elemental analyser (Pella 1990), exchangeable cations by the silver thiourea method (Pleysier and Juo 1980) and particle size distribution using the Boyoucos method (Gee and Bauder 1986). Total soil exchangeable bases were calculated as the sum of Ca, Mg, K and Na. Phosphorus fractionations were as in work by Quesada et al. (2010).
Climatological data
Precipitation climatologies for all sites were obtained from the interpolated WorldClim dataset (Hijmans et al. 2005).
Statistical analyses
Exploratory analysis and precipitation effects
The effects of vegetation formation type () and precipitation on the seven measured foliar traits were first examined using a generalised additive modelling approach using the gam mgcv. function (Wood 2006, 2011) as available within the R statistical package (R-Development-Core-Team 2012). The equation individually fitted for each trait (Θ) was

where μ represents the dataset mean for trees located within the forest () vegetation formation type, is an indicator variable taking a value of one for all trees located within savanna formations and zero otherwise, s is a non-parametric smoother, PA is the mean annual precipitation of the plot in which the tree was growing, US is a random effect assuming a different value for each species and ε is the residual error: In terms of fixed effects, the parameterisation of Eqn 1, allows an assessment of trait differences between forest and savanna stands after controlling for any precipitation effects (the trends in which could also be both visually inspected and statistically assessed). The variance in the dataset not accounted for by or PA is partitioned into that attributable to a trees’ taxonomic identity (US) and then to other causes (ε, in this case, soils, other climatic effects, intra-specific variability and measurement error).
Differences in trait characteristics between forest and savanna species and between the four leaf pre-defined habit types () for sites within the forest/savanna transition zone were then further assessed applying non-parametric multivariate ANOVA (Anderson 2001) and dispersion tests using similarity matrices (Anderson 2006) estimated using Gower’s metric (Gower 1971) to help define our final three vegetation/habit groups ( ) using the adonis, betadisp and vegdist functions available in the R vegan package (Oksanen et al. 2012). These tests were conducted without reference to taxonomic identity. Here, in a multivariate sense, ‘habit type’ can be thought of as a measure of centrality (as in mean or median for the univariate case) with ‘dispersion’, by a similar analogy, being a measure of the multivariate scatter.
Forest/savanna differences in the zone of transition
Two approaches were used to assess the magnitude of trait differences between the three obtained as described above. In the first a simple generalised linear model was fitted for each logarithmically transformed trait (Θ) according to

using the R function nlme(gls) (Pinheiro and Bates 2000; Pinheiro et al. 2011). The results of this in loco (in place, i.e. plot effects) analysis (effectively an unbalanced ANOVA) then being compared with a mixed-effect model with each tree’s taxonomic affiliation and plot location incorporated as crossed random effects according to

where US is the species-level random effect and UP the plot-level random effect. Comparison of Eqn 2 and Eqn 3 shows that the first analysis considers the estimate of the mean Θ for each to be independent of the site conditions in which the tree was found as well as species identity. On the other hand, Eqn 3 allows for systematic variations in Θ to occur across plots, also probing the extent to which trait differences within the various vary systematically with genotype. For each trait this allowed each species to be assigned a characteristic value ( + US), with these ‘species’ estimates then representing the expected Θ at the dataset average site for that trait (i.e. with UP = 0) with the UP for each site giving a measure of the associated plot modulating effect on the trait values observed. We thus term the estimates of Θ so derived in this case as being ab intra (‘from within’, i.e. species effects); this being considered the trait value characteristic of each species before modulation by the environment (or more precisely, the mean value of the trait that would be expected for that species should all species have been uniformly distributed across all the plots sampled as part of this study).
Model diagnostics show that the log-transformation provided for a reasonable homoscedacity in the variances with unbiased estimates of the fixed effect terms. There was, however, a tendency for the retrieved fitted values (involving both fixed and random terms) to overestimate at low Θ and vice versa to underestimate at high Θ. This is to be expected when random effects are quantified through the best linear unbiased predictor (BLUP) method, with shrunken estimates of the differences between terms and the overall means (Galwey 2006). Nevertheless, as shown in the supplementary information of work by Fyllas et al. (2009) this effect (which is greatest for those observations the farthest from the overall mean) affects bivariate slope estimates (see below) to only a trivial degree.
Bivariate relationships
Bivariate relationships were first assessed for each and for the dataset as a whole using Pearson’s correlation coefficient (r2), and standardised major axis (SMA) line fits, which were subsequently investigated where r2 was significantly different from zero. SMA regression lines represent the first axis of a principal component analysis (of a correlation matrix) and are often used in plant allometry studies. When the slopes of these lines were not statistically different we further tested for differences in elevation and shift across the SMA lines between high and low fertility plots, with all analyses being performed using the R smatr library (Warton et al. 2012). These analyses were undertaken for both the ‘raw’ dataset and for the species effects derived as outlined above (centred on the dataset mean) with the latter analyses also incorporating the inevitable error associated with the statistical retrieval of the ab intra ‘species effects’.
Principal component analysis (PCA)
For the plot effects emerging from Eqn 3, a PCA was undertaken using the R prcomp(stats) function with all variances scaled to unity. Common principal components (CPC) analysis (Flury 1988) was undertaken using the program as outlined in work by Phillips and Arnold (1999) for which further details on the approach used may be found in work by Patiño et al. (2012).
Results
Trait variation in relation to precipitation
Individual tree values for each of the seven traits (Θ) examined viz leaf mass per unit area (Ma) and mass based concentrations of nitrogen [N]m, phosphorus [P]m, carbon [C]m, potassium [K]m, magnesium [Mg]m, and calcium [Ca]m are plotted as a function of mean annual precipitation (PA) in Figures 1–7. For each Θ there are three subpanels: (a) for trees growing in savanna vegetation formation types (); (b) for trees growing in forest vegetation formation types () and (c) the Θ frequency distribution for and trees growing in the ZOT.

|

|

|

|

|

|

|
Leaf mass per unit area
For trees there was a slight but insignificant trend towards an increase in Ma with PA with the variability of Ma within plots (each of which has its own x-axis ordinate) typically much greater than between the overall plot means (Fig. 1a). With the more abundant species designated by a unique symbol/colour combination, clear systematic differences between species at the same site were also evident. For example, at the two (adjacent) lowest PA sites of HOM-01 and HOM-02 (Sahel region) only three tree species were found, with Combretum glutinosum having Ma varying from 140 to 168 g m–2, more than four times higher than for the two Acacia species also found in the same plots (A. tortilis and A. senegal) for which Ma varied from 27 to 43 g m–2. It follows then with the gls model fit of Eqn 1 only accounting for 0.15 of the total dataset variance that an examination of the random terms shows that ~0.6 of the remaining 0.85 was attributable to the trees taxonomic affiliation with only 0.4 attributable to unmeasured factors such as edaphic effects and/or intra-species variability (see Table S2.1). In Fig. 1.1b, data is shown for trees growing in forest plots ( = ) but with the lines shown simply being a reproduction of the savanna fit of Eqn 1 (as in Fig. 1b). Comparing the points with the line thus illustrates a clear tendency for trees to have lower Ma than their equivalents; as is also shown by the significant term of 16 ± 5 g m–2 obtained from the Eqn 1 Ma model fit (Table S2.1).
Identified on Fig. 1a, b are several species that were sampled in both forest and savanna. Although the effect is by no means ubiquitous, a tendency for the same species to have a slightly lower Ma when growing in as compared with formations is suggested. With different symbol styles for different leaf habit characteristics, also note the virtual absence of evergreen species within with no obvious differences between the three deciduous groupings in either or . Nor are there any obvious differences in Ma between the forest evergreen and the various deciduous types. Fig. 1c shows the distribution of Ma for and trees within the ZOT. This shows little difference in the overall range observed, but with the Ma distribution of trees skewed markedly towards the right.
Leaf nitrogen
For trees, there was a decline in [N]m with increasing PA from 0.35 to 1.1 m a–1 though with no systematic pattern within the higher rainfall ZOT (Fig. 2a). As for Ma there were large differences within sites, especially at the lowest PA for which distinct species differences were similarly readily discernible (species identification accounting for ~0.6 of the variance not explained by the simple Eqn 3; see Table S2.2). Fig. 2b also shows a distinct tendency for trees to have higher [N]m than their counterparts within the ZOT (the fitted value for in Eqn 1 as given in Table S2.2 being –6.2 ± 0.9 mg g–1) and with the comparison of those few species found in both and suggesting lower [N]m in the latter. There are no obvious differences between the four leaf habit categories in the [N]m patterns observed. Very different frequency distributions in the variation of [N]m within the ZOT for the two were observed with tree [N]m being distributed more or less symmetrically around the mean, but with the [N]m distribution for trees skewed markedly to the right (Fig. 2c). For example, [N]m ≤15 mg g–1 was five times more common for trees growing in savanna formation types than for forest.
Leaf phosphorus
Fig. 3a shows little systematic variation of [P]m with PA for and with no systematic difference in [P]m between the two (the fitted value of in Eqn 1 being 0.05 ± 0.07 mg g–1; see Table S2.3). Table S2.3 also shows, through an analysis of the random terms, a slightly lower proportion of the variation in [P]m not explained by the simple precipitation model attributable to taxonomic identity (0.42) than was the case for [N]m or Ma. From Fig. 3b it can be see that there is some suggestion that the evergreen forest trees have lower [P]m than their deciduous counterparts.
For both , statistical distributions for leaves sampled within the ZOT were skewed to the right with the occasional very high value. As expected from Fig. 3a, b, there was no evidence of any systematic difference between and (Fig. 3c).
Leaf carbon
For , precipitation had a significant influence on [C]m (Fig. 4a) with the linear trend from the s(PA) model fit of 7.3 ± 1.9 mg being highly significant (P < 0.001). Within the ZOT, there was also a clear tendency for trees to have lower [C]m (Fig. 4b), the fitted value for from Eqn 1 being 13.6 ± 3.9 mg g–1 (Table S2.4). Again systematic species differences were evident (accounting for just less than 0.5 of the unexplained model variance) and with species found in both and tending to have slightly lower [C]m in the latter but with no obvious effect of leaf habit on [C]m for trees in (Table S2.4). For the [C]m distribution within the ZOT was skewed to the left with no values greater than 500 mg g–1 observed. In contrast, trees had a distribution skewed towards the right and with less than 0.2 of observations ≤425 mg g–1 (Fig. 4c).
Leaf potassium
Fig. 5a reveals a marked increase in [K]m for trees as precipitation decreases. Within the ZOT tree values were clearly higher (Fig. 5b) with the fitted term of Eqn 1 being –2.3 ± 0.5 mg g–1 (Table S2.5). There was, however, little evidence of a systematic difference between and for those species observed in both . Within an effect of leaf habit was evident with the leaves of deciduous trees tending to have the highest [K]m. As for most of the other traits examined, the proportion of variance not explained by the simple precipitation model but explained by taxonomic identity was just >0.5
For both and trees statistical distributions within the ZOT were skewed to the right and with the very highest [K]m (≥15 mg g–1) only observed for forest trees. Likewise, [K]m less than 6 mg g–1 formed the majority of the tree population, but only about one-third of that of trees (Fig. 5c).
Leaf magnesium
Across the precipitation gradient there was little evidence of an influence of a systematic effect of PA on [Mg]m for (Fig. 6a), although there was some suggestion of trees having higher [Mg]m within the ZOT (Fig. 6b). Nevertheless the term in the Eqn 1 model fit of –0.18 ± 0.24 mg g–1 was clearly non-significant (Table S2.6). Nor was there any evidence of a systematic effect of leaf habit on [Mg]m. The proportion of variance not explained by the simple precipitation model but attributable to taxonomic identity was ~0.5 (Table S2.6). Fig. 6c shows little difference in the distributional properties of [Mg]m for vs trees within the ZOT, with both distributions skewed towards the right.
Leaf calcium
There was little evidence of any consistent effect of PA on [Ca]m for (Fig. 7a) with the slope of the linear gls fit found for Eqn 1 of –1.0 ± 0.5 only being significant at P = 0.06. The effect of was also small with the fitted term in Eqn 1 being –1.9 ± 1.1 mg g–1 and only significant at P = 0.08 (Table S2.7). Within the ZOT, there was little difference in the pattern of [Ca]m distributions between the two .
Trait variation within the forest/savanna transition zone
Multivariate leaf habit: vegetation formation affiliation differences
With a view to the possible amalgamation of the three ‘deciduous’ groups to simplify subsequent interpretations, applying the non-parametric ANOVA with as a grouping factor showed no indications of any major differences between the groups after adjustment for multiple testing (see Table S3.1). Also noting that the few evergreen trees sampled in savanna were all actually ‘forest affiliated’ (i.e. more commonly found in forests) we therefore amalgamated the seven original into three ‘vegetation formation: type-leaf habit’ groups () viz. ‘Forest evergreen’ (Fe), ‘Forest deciduous’ (Fd), and ‘Savanna deciduous’ (Sd). A MANOVA on these three groups then suggested significant trait differences, some of which may be attributable to differences in dispersion as well as location (Table 1) with the Sd grouping showing markedly greater multivariate trait variations than the Fe group (Tukey’s honest significant difference = 0.035) and with the Fd leaves intermediate (data not shown). This categorisation of the three was retained for the rest of the data analysis procedure.
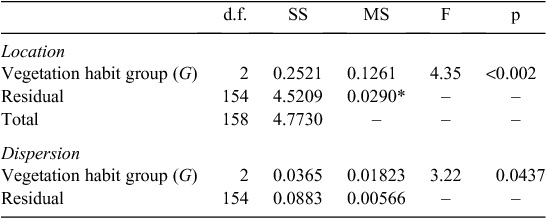
|
Intrinsic versus environmental trait differences
Differences between the three when considered both in loco and ab intra (Eqns 2 and3) are summarised in Fig. 8. The in loco value assumes that all trait differences associated with the different are intrinsic (i.e. not influenced by where the tree was growing) whereas the ab intra estimate allows for trees of the same species but located within different plots to assume a (systematically) different trait value (which is also dependent upon their species identity). For Ma there were only small differences between the three in both cases. Specifically, Sd trees have slightly higher values than the two forest habit types, but with this small difference only being significant in loco. Irrespective of analysis approach evergreen and deciduous forest trees were statistically similar with regards to [N]m, but with leaves of Sd trees significantly lower in loco. This difference was not, however, evident for the ab intra estimate; this then implying that most of the differences in [N]m between forest and savanna trees were more a consequence of plot location than a reflection of inherent physiognomic differences. Unlike [N]m there were no differences between the three in their [P]m.

|
Both trait quantification approaches gave similar results for [C]m for which there was a clear difference between the two deciduous with Sd leaves having significantly higher carbon contents and with Fe leaves intermediate. Similarly large differences between the three were found for potassium but reversed, with Sd leaves having significantly lower [K]m than their deciduous forest counterparts and with Fe lying between the two deciduous groups. Unlike [K]m, but similar to [P]m, for both [Mg]m and [Ca]m, there was little suggestion of any systematic difference between trees of the three .
Bivariate relationships
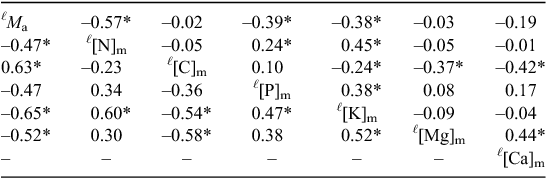
Using log2 transformed data, Table 2 gives OLS Pearson correlation coefficients (r) for the ab intra (species effect) trait estimates (upper diagonal) with the associated plot effects estimates (both from Eqn 3) given in the lower diagonal. This shows ab intra trait statistically significant (P < 0.05) negative log-log relationships for Ma with [N]m, [P]m and [K]m and with these three mass based chemical trait measures all positively correlating with each other. Also of note in the ab intra trait correlation matrix are significant negative correlations between all three of the studied cations and [C]m. Although [Mg]m and [Ca]m were reasonably strongly correlated with each other (r = 0.44), neither of these divalent cations was significantly associated with [K]m.
|
Broadly similar patterns were found for the plot effects but with the important difference that, in addition to the negative log-log correlations for Ma with [N]m, [P]m and [K]m there was also a significant negative correlation between Ma and [Mg]m with Ma. and [C]m showing a significant positive correlation. No estimates of correlation coefficients could be made for [Ca]m due to our inability to retrieve meaningful plot estimate terms.
The in loco and ab intra bivariate relationships between Ma, [N]m and [P]m are shown in Fig. 9. Noting our use of the ‘ℓ’ superscript from here on where variables have been log-transformed (Lloyd et al. 2013), for the in loco ℓ[N]m; ℓMa relationship (Fig. 9a) we found significant negative correlations for all three (P < 0.001) with no significant difference in SMA slope between the three (estimated at –0.91). In contrast, Sd had a lower intercept than either the Fe and Fd leaves, which, in turn, did not differ from each other.

|
By contrast, for the in loco ℓ[P]m; ℓMa association - although again with significant negative correlations for all three (P < 0.05) - differences in SMA slope were evident (Fig. 9b), with the gradient being shallower for Fe (–0.92) than for the forest and savanna deciduous types (–1.40) which themselves varied in intercept only. For the in loco ℓ[P]m; ℓ[N]m association, significant positive associations were found for all three (P < 0.01) but with differences in slope: with lower ℓ[N]m Sd tending to have a higher ℓ[P]m than their deciduous forest counterparts but with this difference becoming smaller (in a relative sense) at higher ℓ[N]m (Fig. 9c). The difference in in loco slope between Fd (1.80) and Fd (1.18) was also significant (P = 0.002) with the suggestion being that at high (but not low) [N]m evergreen forest tree leaves have a lower [P]m than their deciduous counterparts.
Performing the same three mass-based analyses, but this time with ab intra environmentally independent estimates, somewhat different patterns to the in loco case emerge, especially for the ℓ[N]m; ℓMa relationship (Fig. 9d: P < 0.005) with there being no significant difference in SMA slope between the three (estimated at only –0.78) and also no difference in elevation (P = 0.98). Thus, the three SMA regression equations can be considered to be equivalent, although also with a significant difference in mean location along that common line (a shift) when contrasting Fd and Sd (P < 0.05). For the ab intra ℓ[P]m; Ma association, significant regressions were again found for all three (P < 0.05) and with similar differences as for the in loco. Contrasting with the in loco case, statistically significant relationships were not found for the ab intra relationship between ℓ[N]m and ℓ[P]m for Fe or Sd (P > 0.10) although a reasonably strong relationship was still observed for Fd (P < 0.001) with a slope of 1.05
Fig. 10 shows SMA scaling relations involving cations as selected with reference to Table 2. This shows negative in loco ℓ[K]m; ℓMa relationships (Fig. 10a) for which significant negative correlations were observed for all Fd (P < 0.001) with a common slope estimated at –1.51. There were, however, significant differences in elevation (P < 0.05) with the estimated elevation of Fd significantly greater than Sd but not significantly different to Fe (P = 0.05).

|
With both ℓ[Mg]m and ℓ[Ca]m showing strong correlations with ℓ[C]m (Table 2) it was further found that the combined term ℓ([Mg]m + [Ca]m) in molar units gave a stronger correlation with ℓ[C]m than when these cations were considered individually (r = –0.47), this also being marginally better than when potassium was included (r = –0.45). Fig. 10b thus shows the scaling relationships for ℓ([Mg]m + [Ca]m) as a function of ℓ[C]m for which correlations were significant for Fd and Sd (P < 0.005) but not for Fe (P = 0.40). Comparing the two deciduous , significant differences in slope were found with greater (relative) differences between the two deciduous types at low ℓ[C]m (Fig. 10b).
Both ℓ[N]m and ℓ[P]m showed strong correlations with ℓ[K]m (Table 2) and with the in loco ℓ[P]m; ℓ[K]m associations illustrated in Fig. 10c. Here the relationship was significant for all three (P < 0.05) with a common slope of 1.14. There were, however, differences in elevation with Sd being markedly lower than Fd and Fe which did not differ significantly from each other. Although not shown, a similar analysis was also undertaken for ℓ[N]m and ℓ[K]m but with slightly different results. Again all three exhibited statistically significant relationships in loco (P < 0.001), but in this case with a significant difference in slopes as a consequence of Fd being significantly higher than Sd. Here the slope for the Fe was intermediate between the two deciduous types (1.67) and not significantly different to either.
When these analyses were repeated using ab intra estimates, patterns remained essentially the same for ℓ[K]m; ℓMa and ℓ([Mg]m + [Ca]m); ℓ[ C]m associations (Fig. 10d, e) but with a greater divergence between ℓ[K]m and ℓ[P]m for the two deciduous at high values as a consequence of differences in slope. Although the associations for the deciduous groupings were both clearly significant (Fig. 10f; P < 0.005) this was not the case for Fe (P = 0.09). Also observing the ℓ[N]m; ℓ[P]m association ab intra (data not shown), moderately strong correlations were observed for all three (P < 0.05), although with no differences in slope (P = 0.07) which was estimated for all three at 1.20 with large differences in elevation (P < 0.001). Specifically, with Fd > Fe = Sd.
With photosynthesis primarily being an area based process (Lloyd et al. 2013; Osnas et al. 2013), we also examine the inter-relationships of Ma and the area based nitrogen and phosphorus measures in Fig. 11. For the in loco Ma;[N]a association, a positive relationship was observed for all three (P < 0.001) with a common slope of 0.85 but with significant differences in elevation (P < 0.001) arising through the estimate for Sd being markedly lower than for either Fd or Fe. By contrast, the in loco Ma;[P]a association was significant for only Fe and Sd (P < 0.001) with no differences in slope or elevation, though with a significant shift along a common axis. For the Fd leaves there was clearly no evidence of any statistically meaningful relationship (r2 = 0.01, P = 0.61). Examining the [P]a;[N]a associations (Fig. 11c), a positive relationship was observed for all three (P < 0.05) with a common slope of 1.46 but with different intercepts: That for the Sd leaves being greater than the two forest types between which any difference was marginal (P = 0.052).

|
Examining the same three bivariate relationships ab intra, for the Ma;[N]a association a positive relationship was observed for all three (P < 0.005) with no significant differences between the three in elevation and with a common slope estimated as 0.82. For phosphorus the situation was somewhat different with a common slope found (0.97) but, in contrast to the in loco case, with a significant difference in elevation associated with leaf habit; Fd = Sd > Fe. For the ab intra [P]a;[N]a association the result was more or less akin to the in loco analysis with common slopes and differences in elevation: but in this case with the correlation for Sd not being significant.
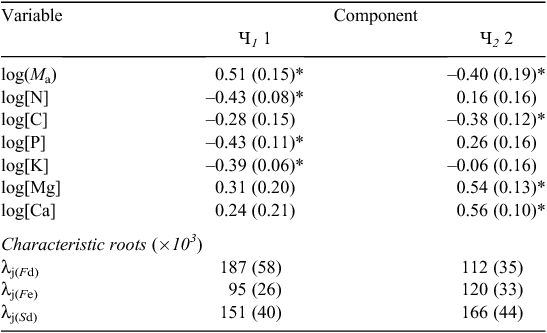
Common principal components (CPC): species traits
Results of the CPC are shown in Table 3 for which results can be interpreted for an ordinary principal components analysis, the difference here being that the relative weightings (λ) have been allowed to differ between the three . Only the first two eigenvectors appeared meaningful with Sd and Fd weightings for the first component, Ч 1 being similar but much greater than that observed for Fe. This first common principal component was characterised by strong positive weightings for [N]m, [P]m and [K]m and a strong negative weighting for Ma. For Ч 2, the λ for all three were similar; although slightly higher for Sd, and involved substantial contributions from [Mg]m and [Ca]m and, of opposite sign, Ma and [C]m.
|
Environmental (site) traits
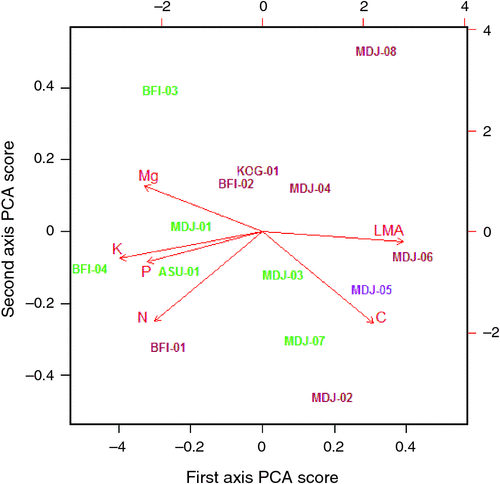
Investigation of the random terms from the model fits for the various traits (Eqn 3) showed that, in addition to a plant taxonomic identity, a substantial portion of the variance not explained by the model was attributable to the site within which a tree was growing; the only exception being for [Ca]m. Indeed in the case of [N]m and [K]m the random site effect term was the most important (data not shown). Retrieval of the trait specific terms for each site further showed strong correlations between these ‘site effects’ for the various Θ (Table 2). A principal components analysis (PCA) of these site effects was thus undertaken (see Table S5.1) the results of which showed over 0.6 of the variance being explained by a single axis (see biplot in Fig. 12). This shows strong anti-correlation between the site effects for Ma and both [K]m and [P]m, these three Θ more or less aligning with the first PCA axis (denoted here as Ч1). Negatively correlated effects of [C]m and [Mg]m were also evident, these two traits varying mostly along the first PCA axis and with a substantial contribution from [N]m.
|
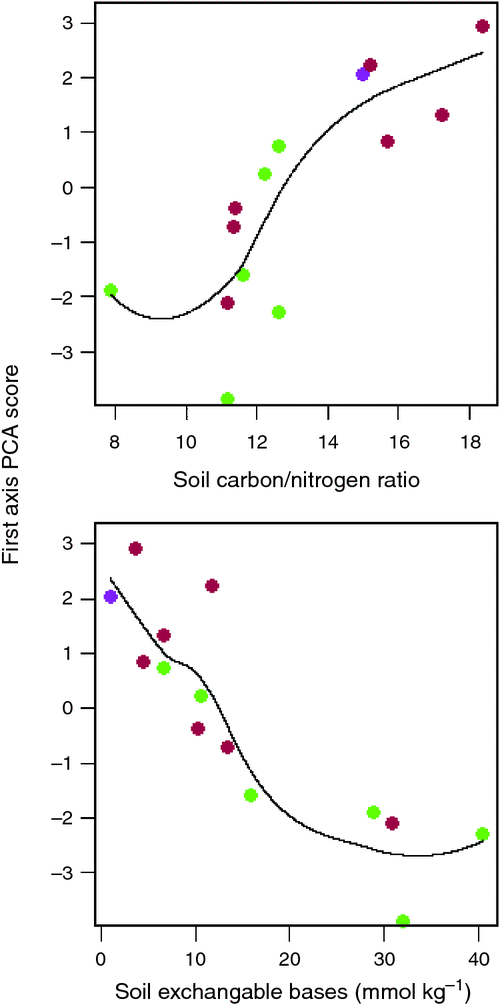
Of the soil variables investigated, two clearly emerged as being the most strongly correlated with the Ч1 site scores, namely the soil C : N ratio and the total sum of (exchangeable) bases, ΣB. Fig. 13 thus plots Ч1 as a function of these two variables illustrating a strong, albeit non-linear relationship in both cases. Although there is some overlap, the different relative locations of the forest versus savanna sites can also be seen in terms of both, the response variate Ч1, and the driving soil covariates C : N and ΣB.
|
Discussion
One part of our work has focussed on examining foliar trait differences between distinct forest and savanna species, also taking advantage of the occasional ‘casuals’ that are found growing in the other habitat in order to help determine whether trait differences between the two species groupings within ZOT are a consequence of intrinsic (genetic) differences or a response to systematic differences between forest and savanna vegetation formations in soil chemical and/or physical conditions (Cochrane 1989; Ratter 1992; Thompson et al. 1992; Hoffmann et al. 2009; Lehmann et al. 2011; Saiz et al. 2012). Here the in loco estimate simply takes the measured foliar value for each tree categorising it into either the ‘forest’ or ‘savanna’ group depending on where it was found growing (Eqn 2). Alternatively, the ab intra approach accounts for systematic trait variations occurring between plots (due, for example, to differences in soil fertility); also allowing each species to have its own unique trait value.
This second approach was only taken within the ZOT areas studied because of low species diversity and limited species overlap across sites in the drier areas. Nevertheless, as discussed below, the mixed model analysis for the precipitation component of the study (with the variance not explained by PA partitioned into species and residual effects) does provide some insight into the importance of species traits.
Savanna foliar traits and precipitation/rainfall seasonality
It has frequently been reported that Ma tends to increase with declining precipitation (Schulze et al. 1998; Fonseca et al. 2000; Wright et al. 2002; Midgley et al. 2004; Cernusak et al. 2011) and this has now been suggested as representing a general trend (Poorter et al. 2009). Nevertheless, no such pattern was observed in our savanna tree dataset which showed, if anything, a slight tendency for a decline in Ma as PA declined (Fig. 1a). Although this could be attributable to all our savanna species being of the deciduous habit (Wright et al. 2005), some of the above cited studies which report increases in Ma as PA declines have also involved deciduous species (Schulze et al. 1998; Midgley et al. 2004). This suggests that leaf habit is not the sole explanation for the study differences.
With soil nutrient effects on ecosystem level Ma clearly being important (Cunningham et al. 1999; Fyllas et al. 2009) one possibility that could account for our different result is the relatively high cation/phosphorus status of the soils in this study (see Table S1.1) compared to the relatively highly weathered soils typical of both tropical Australia and southern Africa (Buckley et al. 1987), which is where the studies suggesting a high Ma–low PA association have taken place. Alternatively, differences in the way rainfall seasonality changes as PA declines may also be important in explaining differences between the continents as there is a tendency for both the seasonality and total amount of rainfall to decline as one approaches the desert regions of both Australia and Southern Africa but not West Africa. For example, the study by Cernusak et al. (2011) was conducted along a precipitation gradient in northern Australia extending from Howard Springs (PA = 1.71 m a–1) to Boulia (PA = 0.29 m a–1). In this study, a dimensionless seasonality index (υ), which potentially varies from 0 for uniform year-round rainfall to 1.0 where all rain occurs in 1 month (Chave et al. 2010), gives values of 0.71 and 0.49 respectively. Likewise, for the Kalahari precipitation transect study of Midgley et al. (2004), PA varied from 0.59 m a–1 (Pandamatenga) to 0.30 m a–1 (Tshane) for which υ = 0.72 and 0.65 respectively. In contrast, for our West Africa study, the opposite is observed, with the driest HOM-01 and HOM-02 sites along our precipitation transect (for which PA = 0.29 m a–1) having υ = 0.85 (see Table S1.1) compared with much lower values in the higher precipitation regions further south. This strong negative υ–PA association, arising through the West African monsoon providing a highly seasonal but very stable rainfall pattern across our study region (Hall and Peyrillé 2006), means that for the northern areas close to the Sahara desert, the probability of any rain at all for over nearly 8 months of the year is effectively zero. This is in contrast with the more commonly studied low PA, low υ situation (rainfall becoming ‘less predictable’ in more arid regions) for which the structural resilience associated with a high Ma would be expected to contribute to leaf survival during extended periods between rainfall events, themselves of an intrinsically more stochastic nature.
Although we detected a slight tendency for Ma to increase with declining PA, variability within a site was as large as or larger than variability across sites: the most striking examples of which were the two driest sites (HOM-01 and HOM-02). There, despite only three woody species being present (Acacia senegal, Acacia tortilis subsp. raddiana and Combretum glutinosum) – all of which are considered to be of exceptional drought tolerance (Arbonnier 2004) – a variation in Ma more or less spanning the range of the entire dataset was observed. This was clearly genetically controlled (Fig. 1a) with these large inter-species differences in Ma possibly reflecting different leaf phenological strategies. For example, the Combretum species with the higher Ma have been shown to typically exhibit a much longer leafing period compared with the low Ma Acacia species, even when in the same environment (Poupon 1979; Devineau 1999). This is consistent with the now generally accepted Ma↔leaf lifetime trade-off (Chabot and Hicks 1982). We therefore postulate that the successful Acacia and Combretum spp. surviving in this extreme Sahelian environment represent two end points of possible leaf construction cost vs potential carbon return strategies: on the one hand, the Acacia spp. produce a very low cost leaf that nevertheless survives long enough to make use of the soil water associated with the rains occurring in the most intense phases of the short wet season. Combretum spp. on the other hand, make a more durable leaf, capable of surviving more extended drought periods and hence capable of accessing any later season rains, the value of which would be lost on the already leafless Acacia spp. Consistent with this conjecture is the observation by De Bie et al. (1998) that West African Combretum typically prolong their leafing period when water availability is extended, with Acacia spp. apparently lacking the same degree of phenological plasticity.
The clear tendency for different species to systematically differ in Ma is also evident in the mixed-model variance partitioning (see Table S2.1) for which 0.57 of the total dataset variance not accounted for by the fixed effect terms (viz. biome or precipitation) was attributed to species differences (with the rest reflecting within-species variation and experimental error). Some systematic variations at the genus level are also apparent. For example, strongly negative random effect terms (US), such as those found for the two Acacia species mentioned above, were also found for all other sampled members of this genus. In contrast, for all Combretum species, positive random effect terms were found, although some other members of this genus were not characterised by an appreciably higher Ma than average (e.g. C. adenogonium, also sampled at MLE-01 for which US is only slightly positive). A second savanna genus characterised by consistently higher than average Ma was Terminalia (pink coloured symbols in Figs 1–7) for which all five species sampled had a positive US.
For [N]m an even high proportion of the random model component was explained by species identity with τ02/(σ02 + τ02) = 0.70 (see Table S2.2), and with the positive (fixed effect) slope for PA < 1.0 m a–1 (Fig. 2) also indicating that the higher [N]m under low precipitation regimes have an additional climate induced component. Especially as there was proportionally a less marked decline in Ma (Fig. 1a), this increase in [N]m was also associated with an increase in [N]a and the high area based photosynthetic capacities as water availability declines (Domingues et al. 2010). This is consistent with theory (Buckley et al. 2002) and has also been observed for transect studies in Australia (Cernusak et al. 2011) and China (Wei et al. 2011) with a general increase in [N]a with decreasing precipitation also having been demonstrated with the global dataset presented by Wright et al. (2005).
However, our dataset also showed an increase in foliar [N] for savanna species for PA above 1.0 m a–1 suggesting that factors other than climate and species identity may have been influencing [N]m and [N]a at the moister end of the savanna spectrum. One potential candidate is the declining fire frequency associated with reductions in herbaceous cover as PA increases (Saiz et al. 2012). Nevertheless, although rates of nutrient loss through biomass combustion may be considerable, net fire-induced nutrient losses are usually minimal at a regional scale due to the subsequent return of emitted nutrients through wet- and dry-atmospheric deposition. Thus, other factors may be involved with a general increase in savanna soil N cycling rates with higher PA having been suggested by Aranibar et al. (2004).
The pattern of variation in [P]m in relation to precipitation (Fig. 3) was similar to that observed for [N]m but with a much less marked increase at lower PA. Working along this same transect, Domingues et al. (2010) suggested that, in addition to N, P may also be important in modulating the photosynthetic capacity of tropical tree species. Although much of the analysis by Domingues et al. (2010) was centred on mass-based expressions which we now know can potentially lead to spurious conclusions as to causation where the entities involved are primarily area based (Lloyd et al. 2013), we also note that the general conclusions made in that study were demonstrated to hold when area-based expressions were employed (see table 4 in Lloyd et al. 2013). That study also found that - irrespective of model – savanna trees growing at lower PA tend to have higher photosynthetic nutrient use efficiencies than their higher precipitation regime counterparts; also with some suggestion that savanna species typically have a higher photosynthetic capacity at any given level of N and/or P than their forest counterparts. This suggests that any direct translation of simple measurements of foliar N and/or P values into area-based photosynthetic capacities may not be straight forward for analyses such as ours where significant climatic gradients and/or different vegetation formation types constitute a fundamental part of the analysis.
Although the overall effect was small, the observed linear increase in [C]m with PA (7.6 mg g–1 m–1) was highly significant (see Table S2.4) and this can only partly have been due to concomitant changes in cation content. For example, the fixed model precipitation term for [K]m was lower than for [Ca]m which, along with the observation that [Mg]m tended to decrease with PA at the lower rainfall savanna sites suggests that at least half of the increase in [C]m with PA must have been due to changes in foliar carbohydrate chemistry. For example, this might be associated with a tendency for increased production of strongly reduced constitutive defence compounds, such as lignin, as potential leaf longevity increases with increasing wet season length, as the phenomenon has been well documented for tropical forest species (Fyllas et al. 2009), and it is also the case that at any one site [C]m can vary by as much as 80 mg g–1. This variability also clearly has a strong genetic component (see Table S2.4) and implies variations in foliar construction costs per unit area due to variations in carbon content to be of a similar order of magnitude to that attributable to variations in Ma.
Of the cations, it was only potassium which showed strongly significant variations with PA, with average [K]m for trees in savanna stands increasing markedly as precipitation declined (Fig. 5a). Such a trend, which as far as we know has not been reported before, cannot be readily attributed to variations in soil cation availability (see Table S1.1). This therefore suggests an increasingly important role of potassium in Sd leaf water relations as PA declines. Given its prime role as an osmotically active cation (Leigh and Wyn Jones 1984) one possibility may relate to the leaves of lower PA areas needing to have more negative osmotic potentials in order to survive more extended rain-free periods during the dry season; this notion being consistent with results of a recent literature survey where it was found that the leaves of ‘tropical-dry’ woody species tend to have more negative osmotic potentials than their ‘tropical-wet’ counterparts (Bartlett et al. 2012).
Forest/savanna differences
Within the ZOT, the extent to which in loco trait differences were accountable in terms of intrinsic (ab intra) differences between species typically associated with forest vs savanna as opposed to effects mediated by differences in growing environment depended upon the trait examined. For example, although all trait differences between forest and savanna were inevitably less when considered ab intra (as opposed to in loco) this difference was much more marked for [N]m as opposed to [C]m or [K]m and with Ma being intermediate (Fig. 8). These contrasts were also reflected in differences in scaling relationships. For example, although Sd leaves showed a lower intercept than their forest counterparts when the [N]m↔Ma relationship was examined in loco (Fig. 9a), no such difference was evident ab intra (Fig. 9d). Likewise, the contrast in slope between Fe and the two deciduous was greater when examined ab intra (Fig. 9e) than in loco (Fig. 9b). In some cases relationships were significant when examined in loco but not ab intra (e.g. [N]m↔[P]m for Fe and Sd in Fig. 9). Although this was no doubt in some part due to the multiple coordinated trait effects mediated by site as evidenced by the PCA analysis shown in Fig. 12 and Table S4.1, it must also be borne in mind that the in loco regressions inevitably have more degrees of freedom (as they are often replicates of the same species) and hence have a higher likelihood of a statistically significant association being obtained.
As noted by Lloyd et al. (2013), differences in the nature of bivariate relationships when expressed on a mass basis are readily explainable in terms of the relative variances of the traits being examined on an area basis and the strength of the area-based association (and vice versa). As might be expected from that analysis then, the area based relationships of both nitrogen and phosphorus with Ma are of an opposite sign, and for [N]m↔ Ma with the relative intercept rankings being retained (though with a small difference in intercept between the Sd leaves and the forest types). Nevertheless, for phosphorus a second more subtle difference in mass- vs area-based relationships was observed with a difference in mass-based slope between Fe leaves and the two deciduous types (Fig. 9b, e) which was reflected only in a difference in intercept when examined on an area basis (Fig. 11b, e). At first sight this might be surprising, but when one examines the mathematics of area- to mass- transformations it is clear that any differences between the three in their (in our case log-transformed) variances will be reflected in differences in mass-based SMA slopes, even if the area-based SMA slopes are identical. This is because, with the SMA slope simply being the ratio of the variances for the y vs x variable and given the slope has the same sign as the regression coefficient (Legendre and Legendre 2012) using eqns A2.1 and A4.6 in work by Lloyd et al. (2013) the mass-based SMA slope expressed in terms of the area-based variances becomes:

where ℓΘm is the log-transformed trait value on a mass basis, ℓΘa is the equivalent trait value on an area basis, ℓMa is the log-transformed mass-per unit area and r is the ℓΘa↔ℓMa regression coefficient. From Eqn 4 it follows that identical area-based bivariate slopes must differ when converted to a mass basis should either the strength of the area-based association and/or the magnitude of the areas trait variance differ between treatments. This then presumably being the reason that the [N]m↔[P]m relationships show different slopes (Fig. 9c, f) but with a common slope (although with different intercepts) being observed for [N]a↔[P]a (Fig. 11c, f).
Although there is a clear rationale for examining foliar traits such as nitrogen and phosphorus which are related to photosynthetic carbon acquisition on an area-basis (Lloyd et al. 2013; Osnas et al. 2013) for traits such as foliar carbon content and cation concentrations the situation is less clear and we have therefore limited our analysis here to these traits being expressed on a mass basis as is usually the case. As is illustrated in Fig. 10, the strongest correlations for [K]m were with Ma and [P]m with [C]m showing its strongest correlation with the term [Mg]m + [Ca]m; this also being stronger for deciduous leaves. Taken with the association of Ma, [N]m and [P]m discussed above, these relationships are also consistent with the results of the CPC analysis in Table 3 where (with a greater weighting towards the Fd and Sd groups) the first axis links [K]m with Ma, [N]m and [P]m and with the second axis having [C]m negatively associated with both [Mg]m and [Ca]m.
As for the different patterns observed for [K]m vs [Ca]m and [Mg]m along the savanna precipitation transect as noted above, this may reflect not only the well documented role of the former in stomatal function, but also through a potential role in chloroplast metabolism itself (Battie-Laclau et al. 2014). This possible role for higher potassium concentrations in helping to maintain the typically higher photosynthetic rates of the low PA trees (area basis) would be in addition to its contribution to a significant cation–carbon trade-off, which has also been observed for tropical tree species by Patiño et al. (2012). In brief, this is considered to reflect different plant strategies in terms of leaf construction costs, with the tendency for low Ma in leaves of high mineral content presumably attributable to a low tissue density associated with thinner, less lignified cell walls with the higher cation content presumably also balanced by higher levels of organic acids which are, themselves, of a relatively low C content. Such leaves also have lower overall construction costs and less investment of phenols and other carbon rich compounds in defence (Poorter and Villar 1997).
Although evergreen species are often thought of as being associated with a higher investment in expensive defence and structural compounds than deciduous or semi-deciduous species an increasing number of studies support the results obtained here. That is, at least for co-occurring tropical forest trees, there seems to be surprisingly little difference in the foliar chemistry and hydrology-related traits of these functional groups (Brodribb et al. 2002; Villar et al. 2006; Williams et al. 2008). Studies which have reported significant variations (e.g. an unpublished study cited in work by Poorter et al. (2009) and Ishida et al. (2008)) also found that differences due to phylogeny were as large or larger than differences due to phenology.
Environmental versus genetic effects
Finally we comment on the inferred importance of site conditions in influencing the foliar traits observed, especially as implied by the difference between the in loca and ab intra [N]m (and to a lesser extent Ma) estimates for savanna species (Fig. 8). Here, the clear implication is that the higher Ma and lower [N]m typically observed for trees growing in savanna formations as compared with their forest counterparts (Hoffmann et al. 2005b; Ratnam et al. 2011) are, at least in our case, attributable more to differences in the edaphic characteristics underlying savanna versus forest vegetation than inherent differences between ‘forest’ vs ‘savanna’ species per se. We noted that the first (and only significant) axis of the ‘environmental effects’ PCA (Table S4.1) contained many substantial weightings which more or less also replicated those implied by the first two axes of the CPC on the species effects (see also Fig. 13). This suggests similar patterns of co-ordinated trait variation not only between different species, but also when the foliar trait gamut of any given species is modified by its growing conditions. Both, soil cation availability and soil C : N ratio, emerged as good predictors of the magnitude of the co-ordinated ‘environmental response’, which is not surprising given their generally close associations to tropical soil types (Quesada et al. 2010). As pointed out by Lloyd et al. (2009), immobilisation of nitrogen through litter chemistry feedbacks may also be an important characteristic of savanna ecosystems which – generally speaking – also show more widespread indications of limitations to their productivity by nitrogen availability than is the case for tropical forest systems as suggested by the high soil C : N ratio.
Conclusions
Supplementing our knowledge of already well documented differences between forest and savanna trees in terms of trait adaption to pyrogenic environments, we found significant contrasts in leaf mass per unit area and mass-based foliar N concentrations attributable to both genotype and differing site conditions for naturally growing dry land forest and savanna trees in West and Central Africa. No difference was found for foliar phosphorus concentrations. The most marked contrast between the two groupings was, however, in foliar potassium concentrations which were appreciably lower in savanna species as compared with their forest counterparts. Savanna tree foliar potassium concentrations were also markedly higher at lower precipitation sites. Considered in conjunction with previous studies from moister tropical forests (Quesada et al. 2012), this suggests an important yet unidentified role for this cation in the functioning of the tropical woody species.
Acknowledgements
We gratefully acknowledge the many generous individuals who took part in the making of this work either in the field or in the UK. Fieldwork assistance was provided by A. den Holander and W. Zakaria. The Forest Research Institute of Ghana (FORIG) provided vehicles, drivers, laboratory space and local support in West Africa through the diligent work of K. Mensah. We also thank WCS-Cameroon and J. Sonké for logistical assistance in Cameroon. Shiela Lloyd assisted with manuscript and figure preparation. This work was funded as part of the UK Natural Environment Research Council TROBIT Consortium project (Award NE/D005590/1) with additional support for Simon Lewis through a Royal Society University Research Fellowship.
References
Anderson MJ (2001) A new method for non‐parametric multivariate analysis of variance. Austral Ecology 26, 32–46.Anderson MJ (2006) Distance‐based tests for homogeneity of multivariate dispersions. Biometrics 62, 245–253.
| Distance‐based tests for homogeneity of multivariate dispersions.Crossref | GoogleScholarGoogle Scholar | 16542252PubMed |
Aranibar JN, Otter L, Macko SA, Feral CJ, Epstein HE, Dowty PR, Eckardt F, Shugart HH, Swap RJ (2004) Nitrogen cycling in the soil–plant system along a precipitation gradient in the Kalahari sands. Global Change Biology 10, 359–373.
| Nitrogen cycling in the soil–plant system along a precipitation gradient in the Kalahari sands.Crossref | GoogleScholarGoogle Scholar |
Arbonnier M (2004) ‘Trees, shrubs and lianas of West African dry zones.’ (Editions Quae: Paris)
Bartlett MK, Scoffoni C, Sack L (2012) The determinants of leaf turgor loss point and prediction of drought tolerance of species and biomes: a global meta-analysis. Ecology Letters 15, 393–405.
| The determinants of leaf turgor loss point and prediction of drought tolerance of species and biomes: a global meta-analysis.Crossref | GoogleScholarGoogle Scholar | 22435987PubMed |
Battie-Laclau P, Laclau J-P, Beri C, Mietton L, Muniz MRA, Arenque BC, De Cassia Piccolo M, Jordan-Meille L, Bouillet J-P, Nouvellon Y (2014) Photosynthetic and anatomical responses of Eucalyptus grandis leaves to potassium and sodium supply in a field experiment. Plant, Cell & Environment 37, 70–81.
| Photosynthetic and anatomical responses of Eucalyptus grandis leaves to potassium and sodium supply in a field experiment.Crossref | GoogleScholarGoogle Scholar | 1:CAS:528:DC%2BC3sXhvVyjurbE&md5=a1063670eefe0db2b8cc818ab32c96feCAS |
Brodribb TJ, Holbrook NM, Gutiérrez MV (2002) Hydraulic and photosynthetic co-ordination in seasonally dry tropical forest trees. Plant, Cell & Environment 25, 1435–1444.
| Hydraulic and photosynthetic co-ordination in seasonally dry tropical forest trees.Crossref | GoogleScholarGoogle Scholar |
Buckley R, Wasson R, Gubb A (1987) Phosphorus and potassium status of arid timefield soils in central Australia and Southern Africa, and biogeographic implications. Journal of Arid Environments 13, 211–216.
Buckley TN, Miller JD, Farquhar GD (2002) The mathematics of linked optimisation for water and nitrogen use in a canopy. Silva Fennica 36, 639–669.
Cernusak LA, Hutley LB, Beringer J, Holtum JA, Turner BL (2011) Photosynthetic physiology of eucalypts along a sub-continental rainfall gradient in northern Australia. Agricultural and Forest Meteorology 151, 1462–1470.
| Photosynthetic physiology of eucalypts along a sub-continental rainfall gradient in northern Australia.Crossref | GoogleScholarGoogle Scholar |
Chabot BF, Hicks DJ (1982) The ecology of leaf life spans. Annual Review of Ecology and Systematics 13, 229–259.
| The ecology of leaf life spans.Crossref | GoogleScholarGoogle Scholar |
Chave J, Navarrete D, Almeida S, Álvarez E, Aragão LEOC, Bonal D, Châtelet P, Silva-Espejo JE, Goret JY, von Hildebrand P, Jiménez E, Patiño S, Peñuela MC, Phillips OL, Stevenson P, Malhi Y (2010) Regional and seasonal patterns of litterfall in tropical South America. Biogeosciences 7, 43–55.
| Regional and seasonal patterns of litterfall in tropical South America.Crossref | GoogleScholarGoogle Scholar |
Cochrane TT (1989) Chemical properties of native savanna and forest soils in central Brazil. Soil Science Society of America Journal 53, 139–141.
| Chemical properties of native savanna and forest soils in central Brazil.Crossref | GoogleScholarGoogle Scholar | 1:CAS:528:DyaL1MXhslahsbw%3D&md5=224f2f89c49bd2a1de153489f8470743CAS |
Cunningham SA, Summerhayes B, Westoby M (1999) Evolutionary divergences in leaf structure and chemistry, comparing rainfall and soil nutrient gradients. Ecological Monographs 69, 569–588.
| Evolutionary divergences in leaf structure and chemistry, comparing rainfall and soil nutrient gradients.Crossref | GoogleScholarGoogle Scholar |
De Bie S, Ketner P, Paasse M, Geerling C (1998) Woody plant phenology in the West Africa savanna. Journal of Biogeography 25, 883–900.
| Woody plant phenology in the West Africa savanna.Crossref | GoogleScholarGoogle Scholar |
Devineau J-L (1999) Seasonal rhythms and phenological plasticity of savanna woody species in a fallow farming system (south-west Burkina Faso). Journal of Tropical Ecology 15, 497–513.
| Seasonal rhythms and phenological plasticity of savanna woody species in a fallow farming system (south-west Burkina Faso).Crossref | GoogleScholarGoogle Scholar |
Domingues TF, Meir P, Feldpausch TR, Saiz G, Veenendaal EM, Schrodt F, Bird M, Djagbletey G, Hien F, Compaore H, Diallo A, Grace J, Lloyd J (2010) Co-limitation of photosynthetic capacity by nitrogen and phosphorus in West Africa woodlands. Plant, Cell & Environment 33, 959–980.
| Co-limitation of photosynthetic capacity by nitrogen and phosphorus in West Africa woodlands.Crossref | GoogleScholarGoogle Scholar | 1:CAS:528:DC%2BC3cXnvVagsbw%3D&md5=a4fec222ad092583d2d52fd4335039e5CAS |
Flury B (1988) ‘Common principal components and related multivariate models.’ (Wiley: New York)
Fonseca CR, Overton JMC, Collins B, Westoby M (2000) Shifts in trait-combinations along rainfall and phosphorus gradients. Journal of Ecology 88, 964–977.
| Shifts in trait-combinations along rainfall and phosphorus gradients.Crossref | GoogleScholarGoogle Scholar |
Fyllas NM, Patiño S, Baker TR, Bielefeld Nardoto G, Martinelli LA, Quesada CA, Paiva R, Schwarz M, Horna V, Mercado LM, Santos A, Arroyo L, Jiménez EM, Luizão FJ, Neill DA, Silva N, Prieto A, Rudas A, Silviera M, Vieira ICG, Lopez-Gonzalez G, Malhi Y, Phillips OL, Lloyd J (2009) Basin-wide variations in foliar properties of Amazonian forest: phylogeny, soils and climate. Biogeosciences 6, 2677–2708.
| Basin-wide variations in foliar properties of Amazonian forest: phylogeny, soils and climate.Crossref | GoogleScholarGoogle Scholar |
Fyllas NM, Quesada CA, Lloyd J (2012) Deriving plant functional types for Amazonian forests for use in vegetation dynamics models. Perspectives in Plant Ecology, Evolution and Systematics 14, 97–110.
| Deriving plant functional types for Amazonian forests for use in vegetation dynamics models.Crossref | GoogleScholarGoogle Scholar |
Galwey NW (2006) ‘Introduction to mixed modelling: beyond regression and analysis of variance.’ (Wiley: Chichester, UK)
Gee GS, Bauder JW (1986) Particle-size analysis. In ‘Methods in soil analysis. Part 1. Physical and mineralogical methods’. (Ed. A Kluite) pp. 383–409. (SSSA and ASA: Madison, WI, USA)
Gotsch S, Geiger E, Franco A, Goldstein G, Meinzer F, Hoffmann W (2010) Allocation to leaf area and sapwood area affects water relations of co-occurring savanna and forest trees. Oecologia 163, 291–301.
| Allocation to leaf area and sapwood area affects water relations of co-occurring savanna and forest trees.Crossref | GoogleScholarGoogle Scholar | 20058025PubMed |
Gower JC (1971) A general coefficient of similarity and some of its properties. Biometrics 27, 857–871.
| A general coefficient of similarity and some of its properties.Crossref | GoogleScholarGoogle Scholar |
Hall NM, Peyrillé P (2006) Dynamics of the West African monsoon. Journal de Physique. IV 139, 81–99.
| Dynamics of the West African monsoon.Crossref | GoogleScholarGoogle Scholar |
Hao G-Y, Hoffmann WA, Scholz FG, Bucci SJ, Meinzer FC, Franco AC, Cao K-F, Goldstein G (2008) Stem and leaf hydraulics of congeneric tree species from adjacent tropical savanna and forest ecosystems. Oecologia 155, 405–415.
| Stem and leaf hydraulics of congeneric tree species from adjacent tropical savanna and forest ecosystems.Crossref | GoogleScholarGoogle Scholar | 18049826PubMed |
Hijmans RJ, Cameron SE, Parra JL, Jones PG, Jarvis A (2005) Very high resolution interpolated climate surfaces for global land areas. International Journal of Climatology 25, 1965–1978.
| Very high resolution interpolated climate surfaces for global land areas.Crossref | GoogleScholarGoogle Scholar |
Hoffmann WA, Franco AC (2003) Comparative growth analysis of tropical forest and savanna woody plants using phylogenetically independent contrasts. Journal of Ecology 91, 475–484.
| Comparative growth analysis of tropical forest and savanna woody plants using phylogenetically independent contrasts.Crossref | GoogleScholarGoogle Scholar |
Hoffmann W, Franco A, Moreira M, Haridasan M (2005a) Specific leaf area explains differences in leaf traits between congeneric savanna and forest trees. Functional Ecology 19, 932–940.
| Specific leaf area explains differences in leaf traits between congeneric savanna and forest trees.Crossref | GoogleScholarGoogle Scholar |
Hoffmann WA, Franco AC, Moreira MZ, Haridasan M (2005b) Specific leaf area explains differences in leaf traits between congeneric savanna and forest trees. Functional Ecology 19, 932–940.
| Specific leaf area explains differences in leaf traits between congeneric savanna and forest trees.Crossref | GoogleScholarGoogle Scholar |
Hoffmann WA, Adasme R, Haridasan M, de Carvalho MT, Geiger EL, Pereira MAB, Gotsch SG, Franco AC (2009) Tree topkill, not mortality, governs the dynamics of savanna–forest boundaries under frequent fire in central Brazil. Ecology 90, 1326–1337.
| Tree topkill, not mortality, governs the dynamics of savanna–forest boundaries under frequent fire in central Brazil.Crossref | GoogleScholarGoogle Scholar | 19537552PubMed |
Hoffmann WA, Geiger EL, Gotsch SG, Rossatto DR, Silva LC, Lau OL, Haridasan M, Franco AC (2012) Ecological thresholds at the savanna‐forest boundary: how plant traits, resources and fire govern the distribution of tropical biomes. Ecology Letters 15, 759–768.
| Ecological thresholds at the savanna‐forest boundary: how plant traits, resources and fire govern the distribution of tropical biomes.Crossref | GoogleScholarGoogle Scholar | 22554474PubMed |
Ishida A, Nakano T, Yazaki K, Matsuki S, Koike N, Lauenstein DL, Shimizu M, Yamashita N (2008) Coordination between leaf and stem traits related to leaf carbon gain and hydraulics across 32 drought-tolerant angiosperms. Oecologia 156, 193–202.
| Coordination between leaf and stem traits related to leaf carbon gain and hydraulics across 32 drought-tolerant angiosperms.Crossref | GoogleScholarGoogle Scholar | 18297313PubMed |
Legendre P, Legendre L (2012) ‘Numerical ecology.’ (Elsevier: Amsterdam)
Lehmann CER, Archibald SA, Hoffmann WA, Bond WJ (2011) Deciphering the distribution of the savanna biome. New Phytologist 191, 197–209.
| Deciphering the distribution of the savanna biome.Crossref | GoogleScholarGoogle Scholar |
Leigh RA, Wyn Jones RG (1984) A hypothesis relating critical potassium concentrations for growth to the distribution and function of this ion in the plant cell. New Phytologist 97, 1–13.
| A hypothesis relating critical potassium concentrations for growth to the distribution and function of this ion in the plant cell.Crossref | GoogleScholarGoogle Scholar | 1:CAS:528:DyaL2cXksFequrY%3D&md5=9addfbf16ccdc106f02ae44e3e0a0f89CAS |
Lloyd J, Goulden M, Ometto JP, Fyllas NM, Quesada CA, Patino S (2009) Ecophysiology of forest and savanna vegetation. In ‘Amazonia and climate change’. (Eds M Keller, J Gash, P Silva Dias.) pp. 463–484. (American Geophysical Union: Washington DC)
Lloyd J, Patiño S, Paiva RQ, Nardoto GB, Quesada CA, Santos AJB, Baker TR, Brand WA, Hilke I, Gielmann H, Raessler M, Luizão FJ, Martinelli LA, Mercado LM (2010) Optimisation of photosynthetic carbon gain and within-canopy gradients of associated foliar traits for Amazon forest trees. Biogeosciences 7, 1833–1859.
| Optimisation of photosynthetic carbon gain and within-canopy gradients of associated foliar traits for Amazon forest trees.Crossref | GoogleScholarGoogle Scholar | 1:CAS:528:DC%2BC3cXhtl2ksrvM&md5=1e9e64d73f4356acd83bbb8ba532ef17CAS |
Lloyd J, Bloomfield K, Domingues TF, Farquhar GD (2013) Photosynthetically relevant foliar traits correlating better on a mass vs an area basis: of ecophysiological relevance or just a case of mathematical imperatives and statistical quicksand? New Phytologist 199, 311–321.
| Photosynthetically relevant foliar traits correlating better on a mass vs an area basis: of ecophysiological relevance or just a case of mathematical imperatives and statistical quicksand?Crossref | GoogleScholarGoogle Scholar | 1:CAS:528:DC%2BC3sXpvFars7s%3D&md5=c33fa5f049c4def6cb639927b43df02aCAS | 23621613PubMed |
Midgley GF, Aranibar JN, Mantlana KB, Macko S (2004) Photosynthetic and gas exchange characteristics of dominant woody plants on a moisture gradient in an African savanna. Global Change Biology 10, 309–317.
| Photosynthetic and gas exchange characteristics of dominant woody plants on a moisture gradient in an African savanna.Crossref | GoogleScholarGoogle Scholar |
Oksanen J, Blanchet FG, Kindt R, Legendre P, Minchin PR, O’Hara R, Simpson GL, Solymos P, Stevens M, Wagner H (2012) ‘vegan: community ecology package. R package.’ ver. 2.0–2. 2011. Available at http://CRAN.R-project.org/package=vegan
Osnas JL, Lichstein JW, Reich PB, Pacala SW (2013) Global leaf trait relationships: mass, area, and the leaf economics spectrum. Science 340, 741–744.
| Global leaf trait relationships: mass, area, and the leaf economics spectrum.Crossref | GoogleScholarGoogle Scholar | 1:CAS:528:DC%2BC3sXntVGjsLg%3D&md5=bc26f0852a9b362d8778afe01a8cee33CAS | 23539179PubMed |
Patiño S, Fyllas NM, Baker TR, Paiva R, Quesada CA, Santos AJB, Schwarz M, ter Steege H, Phillips OL, Lloyd J (2012) Coordination of physiological and structural traits in Amazon forest trees. Biogeosciences 9, 775–801.
| Coordination of physiological and structural traits in Amazon forest trees.Crossref | GoogleScholarGoogle Scholar |
Pella E (1990) Elemental organic analysis. Part 2. State of the art. American Laboratory 22, 28–32.
Phillips PC, Arnold SJ (1999) Hierarchical comparison of genetic variance-covariance matrices. I. Using the Flury hierarchy. Evolution 53, 1506–1515.
| Hierarchical comparison of genetic variance-covariance matrices. I. Using the Flury hierarchy.Crossref | GoogleScholarGoogle Scholar |
Pinheiro JC, Bates DM (2000) ‘Mixed effects models in S and S-PLUS.’ (Springer-Verlag: Berlin)
Pleysier JL, Juo ASR (1980) A single-extraction method using silver-thiourea for measuring exchangeable cations and effective CEC in soils with variable charges. Soil Science 129, 205–211.
Pinheiro J, Bates D, DebRoy S, Sarkar D (2011) ‘R Development Core Team. nlme: linear and nonlinear mixed effects models. R package ver. 3.1–98.’ (R Foundation for Statistical Computing: Vienna)
Poorter H, Villar R (1997) The fate of acquired carbon in plants: chemical composition and construction costs. In ‘Plant resource allocation’. (Eds FA Bazzaz, J Grace) pp. 39–72. (Academic Press: San Diego, CA, USA)
Poorter H, Niinemets U, Poorter L, Wright IJ, Villar R (2009) Causes and consequences of variation in leaf mass per area (LMA): a meta-analysis. New Phytologist 182, 565–588.
| Causes and consequences of variation in leaf mass per area (LMA): a meta-analysis.Crossref | GoogleScholarGoogle Scholar | 19434804PubMed |
Poupon H (1979) Etude de la phénologie de la strate ligneuse aFété Olé (Sénégal septentrional) de 1971 a1977. Bulletin de l’Institut Fondamental d’Afrique Noire, Tome 41, 44–85.
Quesada CA, Lloyd J, Schwarz M, Patiño S, Baker TR, Czimczik C, Fyllas NM, Martinelli L, Nardoto GB, Schmerler J, Santos AJB, Hodnett MG, Herrera R, Luizão FJ, Arneth A, Lloyd G, Dezzeo N, Hilke I, Kuhlmann I, Raessler M, Brand WA, Geilmann H, Moraes Filho JO, Carvalho FP, Araujo Filho RN, Chaves JE, Cruz Junior OF, Pimentel TP, Paiva R (2010) Variations in chemical and physical properties of Amazon forest soils in relation to their genesis. Biogeosciences 7, 1515–1541.
| Variations in chemical and physical properties of Amazon forest soils in relation to their genesis.Crossref | GoogleScholarGoogle Scholar | 1:CAS:528:DC%2BC3cXhtV2rtLrL&md5=df1f7abba5e21cd6816dd45a3b06332eCAS |
Quesada CA, Lloyd J, Anderson LO, Fyllas NM, Schwarz M, Czimczik CI (2011) Soils of Amazonia with particular reference to the RAINFOR sites. Biogeosciences 8, 1415–1440.
| Soils of Amazonia with particular reference to the RAINFOR sites.Crossref | GoogleScholarGoogle Scholar | 1:CAS:528:DC%2BC3MXht12rt7nI&md5=39f76ca0c32a95c332c801703ac569a6CAS |
R-Development-Core-Team (2012) ‘R: a language and environment for statistical computing.’ Available at http://www.R-project.org/
Ratnam J, Bond WJ, Fensham RJ, Hoffmann WA, Archibald S, Lehmann CE, Anderson MT, Higgins SI, Sankaran M (2011) When is a ‘forest’a savanna, and why does it matter? Global Ecology and Biogeography 20, 653–660.
| When is a ‘forest’a savanna, and why does it matter?Crossref | GoogleScholarGoogle Scholar |
Ratter J (1992) Transition between cerrado and forest vegetation in Brazil. In ‘Nature and dynamics of forest-savanna boundaries’. (Eds P Furley, J Proctor, JA Ratter) pp. 417–430. (Chapman and Hall: London)
Rossatto DR, Hoffmann WA, Franco AC (2009) Differences in growth patterns between co-occurring forest and savanna trees affect the forest–savanna boundary. Functional Ecology 23, 689–698.
| Differences in growth patterns between co-occurring forest and savanna trees affect the forest–savanna boundary.Crossref | GoogleScholarGoogle Scholar |
Saiz G, Bird MI, Domingues TF, Schrodt F, Schwarz M, Feldpausch TR, Veenendaal EM, Djagbletey G, Hien F, Compaore H, Diallo A, Lloyd J (2012) Variation in soil carbon stocks and their determinants across a precipitation gradient in West Africa. Global Change Biology 18, 1670–1683.
| Variation in soil carbon stocks and their determinants across a precipitation gradient in West Africa.Crossref | GoogleScholarGoogle Scholar |
Schulze E-D, Williams RJ, Farquhar GD, Schulze W, Langridge J, Miller JM, Walker BH (1998) Carbon and nitrogen isotope discrimination and nitrogen nutrition of trees along a rainfall gradient in northern Australia. Functional Plant Biology 25, 413–425.
Thompson J, Viana J, Proctor J, Ratter J (1992) Contrasting forest-savanna boundaries on Maraca Island, Roraima, Brazil. In ‘Nature and dynamics of forest-savanna boundaries’.’ (Eds P Furley, J Proctor, JA Ratter) pp. 367–391. (Chapman and Hall: London)
Torello-Raventos M, Feldpausch TR, Veenendaal E, Schrodt F, Saiz G, Domingues TF, Djagbletey G, Ford A, Kemp J, Marimon BS, Marimon BH, Lenza E, Ratter JA, Maracahipes L, Sasaki D, Sonke B, Zapfack L, Taedoumg H, Villarroel D, Schwarz M, Quesada CA, Ishida FY, Nardoto GB, Affum-Baffoe K, Arroyo L, Bowman DMJS, Compaore H, Davies K, Diallo A, Fyllas NM, Gilpin M, Hien F, Johnson M, Killeen TJ, Metcalfe D, Miranda HS, Steininger M, Thomson J, Sykora K, Mougin E, Hiernaux P, Bird MI, Grace J, Lewis SL, Phillips OL, Lloyd J (2013) On the delineation of tropical vegetation types with an emphasis on forest/savanna transitions. Plant Ecology & Diversity 6, 101–137.
| On the delineation of tropical vegetation types with an emphasis on forest/savanna transitions.Crossref | GoogleScholarGoogle Scholar |
Veenendaal E, Torello-Raventos M, Feldpausch T, Domingues TF, Gerard FF, Schrodt F, Saiz G, Quesada CA, Djagbletey G, Ford A, Kemp J, Marimon BS, Marimon Junior BH, Lenza E, Ratter JA, Maracahipes L, Sasaki D, Sonké B, Zapfack L, Villarroel D, Schwarz M, Ishida FY, Gilpin M, Nardoto GB, Affum-Baffoe K, Arroyo L, Bloomfield K, Gjeca G, Compaore H, Davies K, Diallo A, Fyllas NM, Gignoux J, Hien F, Johnson M, Mougin E, Hiernaux P, Killeen TJ, Metcalfe D, Miranda HS, Steininger M, Sykora K, Bird MI, Grace J, Lewis SL, Phillips OL, Lloyd J (2014) Structural, physiognomic and aboveground biomass variation in savanna-forest transition zones on three continents. How different are co-occurring savanna and forest formations? Biogeosciences Discussions 11, 4591–4636.
| Structural, physiognomic and aboveground biomass variation in savanna-forest transition zones on three continents. How different are co-occurring savanna and forest formations?Crossref | GoogleScholarGoogle Scholar |
Villar R, Ruiz Robleto J, de Jong Y, Poorter H (2006) Differences in construction costs and chemical composition between deciduous and evergreen woody species are small as compared to differences among families. Plant, Cell & Environment 29, 1629–1643.
| Differences in construction costs and chemical composition between deciduous and evergreen woody species are small as compared to differences among families.Crossref | GoogleScholarGoogle Scholar | 1:CAS:528:DC%2BD28XotlSmtbg%3D&md5=a314f9d9d2006b4bbf7f8c6ed25408b5CAS |
Walter H, Mueller-Dombois D (1971) ‘Ecology of tropical and subtropical vegetation.’ (Oliver & Boyd: Edinburgh, UK)
Warton DI, Duursma RA, Falster DS, Taskinen S (2012) smatr 3– an R package for estimation and inference about allometric lines. Methods in Ecology and Evolution 3, 257–259.
| smatr 3– an R package for estimation and inference about allometric lines.Crossref | GoogleScholarGoogle Scholar |
Wei H, Wu B, Yang W, Luo T (2011) Low rainfall-induced shift in leaf trait relationship within species along a semi-arid sandy land transect in northern China. Plant Biology 13, 85–92.
| Low rainfall-induced shift in leaf trait relationship within species along a semi-arid sandy land transect in northern China.Crossref | GoogleScholarGoogle Scholar | 1:CAS:528:DC%2BC3MXhsFOjsr4%3D&md5=d909e99dc6ebdd67e8525f1ba36f9323CAS | 21143729PubMed |
Williams LJ, Bunyavejchewin S, Baker PJ (2008) Deciduousness in a seasonal tropical forest in western Thailand: interannual and intraspecific variation in timing, duration and environmental cues. Oecologia 155, 571–582.
| Deciduousness in a seasonal tropical forest in western Thailand: interannual and intraspecific variation in timing, duration and environmental cues.Crossref | GoogleScholarGoogle Scholar | 18188604PubMed |
Wood SN (2006) ‘Generalized additive models: an introduction with R.’ (CRC Press: Boca Raton, FL, USA)
Wood SN (2011) Fast stable restricted maximum likelihood and marginal likelihood estimation of semiparametric generalized linear models. Journal of the Royal Statistical Society. Series B, Statistical Methodology 73, 3–36.
| Fast stable restricted maximum likelihood and marginal likelihood estimation of semiparametric generalized linear models.Crossref | GoogleScholarGoogle Scholar |
Wright IJ, Reich PB, Westoby M (2001) Strategy shifts in leaf physiology, structure and nutrient content between species of high- and low-rainfall and high- and low-nutrient habitats. Functional Ecology 15, 423–434.
| Strategy shifts in leaf physiology, structure and nutrient content between species of high- and low-rainfall and high- and low-nutrient habitats.Crossref | GoogleScholarGoogle Scholar |
Wright IJ, Westoby M, Reich PB (2002) Convergence towards higher leaf mass per area in dry and nutrient‐poor habitats has different consequences for leaf life span. Journal of Ecology 90, 534–543.
| Convergence towards higher leaf mass per area in dry and nutrient‐poor habitats has different consequences for leaf life span.Crossref | GoogleScholarGoogle Scholar |
Wright IJ, Reich PB, Cornelissen JHC, Falster DS, Groom PK, Hikosaka K, Lee W, Lusk CH, Niinemets Ü, Oleksyn J, Osada N, Poorter H, Warton DI, Westoby M (2005) Modulation of leaf economic traits and trait relationships by climate. Global Ecology and Biogeography 14, 411–421.
| Modulation of leaf economic traits and trait relationships by climate.Crossref | GoogleScholarGoogle Scholar |
1 This is an Open Access article, distributed under the terms of a Creative Commons Attribution licence CC BY (http://creativecommons.org/licenses/by/3.0/), which permits unrestricted re-use, distribution, and reproduction in any medium, provided the original work is cited in full.