

Decadal trends in shark catches and effort from the New South Wales, Australia, Shark Meshing Program 1950–2010
D. D. Reid A B , W. D. Robbins A and V. M. Peddemors AA Cronulla Fisheries Research Centre of Excellence, Industry & Investment NSW, PO Box 21, Cronulla, NSW 2230, Australia.
B Corresponding author. Email: dennis.reid@industry.nsw.gov.au
Marine and Freshwater Research 62(6) 676-693 https://doi.org/10.1071/MF10162
Submitted: 19 June 2010 Accepted: 24 March 2011 Published: 24 June 2011
Journal Compilation © CSIRO Publishing 2011 Open Access CC BY-NC-ND
Abstract
The New South Wales (NSW) government has operated a program of netting beaches for the protection of swimmers and surfers against shark attack since 1937 in Sydney, and since 1949 in Newcastle and Wollongong. The scope and directives of the Shark Meshing Program have remained constant since its inception, with operational modifications in net specifications in 1972, changes in spatial deployment in 1972, 1987 and 1992, and the elimination of winter netting since 1989. This markedly increased meshing effort in 1972, and again in 1987. In the present study, we examine the trends in catch and effort for the period from 1950–1951 to 2009–2010 over this 200-km section of the NSW coast. Significant temporal trends in species, size and sex composition are described herein. Catches were consistently dominated by three shark taxa, hammerhead sharks (Sphyrna spp.), whaler sharks (Carcharhinus spp.) and Australian angel sharks (Squatina australis), although their relative contributions to catches varied over time. Catch per unit effort has significantly declined for five of the most abundant shark taxa over the study period, increasing only for a single taxon, the sevengill shark (Notorynchus cepedianus). Catches of larger, potentially dangerous white sharks (Carcharodon carcharias) and tiger sharks (Galeocerdo cuvier) saw fewer large animals being caught over time. This pattern was not observed across other taxa. Four different monthly trends were observed in landings of the most abundant eight taxa, reflecting differences in the biology of the catch species. The current study also provides useful information on catches and sizes of grey nurse (Carcharias taurus) and white sharks before and after their protection in NSW waters in 1984 and 1998, respectively.
Additional keywords: Australia, beach protection, Shark Meshing Program, SMP, shark nets.
Introduction
Instances of shark attack have led to several methods of protection initiated around the world. Methods investigated include the use of shark-exclusion devices (barriers), surveillance schemes and shark-control (fishing) devices (Dudley and Cliff 2010). The use of anchored, large-mesh gill-nets as a preventative measure was pioneered in NSW, Australia, following recommendations that they may afford a ‘cheap and effective way of minimising the shark peril’ (New South Wales Shark Menace Committee 1929). Nets were subsequently installed off Sydney beaches in 1937 (Reid and Krogh 1992) in a program that continues today.
Although smaller-scale beach-meshing program has been employed in New Zealand (Francis 1998), and fixed exclusion nets have been in place in Hong Kong since 1995, only two other locations have comparable large-scale, ongoing fishing programs deploying shark nets (Dudley and Cliff 2010). A South African program commenced in Durban in 1951 (Davies 1964; Dudley 1997), and a similar program was initiated by the Queensland (Qld) government in 1962 (Paterson 1986; Dudley and Gribble 1999). Both the Qld and South African programs use a combination of nets and baited drum-lines to target potentially dangerous sharks, whereas the NSW program relies solely on the use of large-mesh (>50 cm) set nets.
Although a substantial proportion of the attention that these major beach-protection programs have received has been focussed on the effects that their catches have on targeted (potentially dangerous) shark populations (Paterson 1986; Cliff and Dudley 1992; Reid and Krogh 1992; Simpfendorfer 1993; Dudley and Simpfendorfer 2006) and the populations of by-catch species (Heinsohn 1972; Paterson 1979, 1990; Cockcroft 1990; Krogh 1994; Gribble et al. 1998), these programs represent an extended sampling period of coastal waters in the regions they operate. Thus, they provide a reliable record of the long-term trends in abundance and distribution of regional shark species.
The NSW Shark Meshing Program (SMP) began along 18 Sydney beaches, extending from Palm Beach to Cronulla. Meshing was introduced to the Newcastle (nine beaches) and Illawarra (four beaches) regions in December 1949, following fatal attacks at Newcastle beaches (Fig. 1). Nine more beaches were added in 1972, with a further nine beaches in a new region, the Central Coast, added to the program in January 1987. A further two beaches were included in this region from September 1992, bringing the total number of meshed beaches to 51. Until the 2010–2011 season, five contracts were in place for the SMP, each covering one geographical region, viz. Hunter – formerly Newcastle (10 beaches), Central Coast (11 beaches), Sydney North (15 beaches), Sydney South (10 beaches) and Illawarra (5 beaches) (Fig. 1).

|
The aim of the present study was to synthesise the data collected over six decades of the SMP, evaluate trends in catch rates, analyse spatial and temporal variations in catches and species composition, test for changes in size composition, sex ratios and survival rates by taxon, and where possible, relate these results to other sources of mortality on shark populations.
Changes in effort have previously been described and standardised in a review of the catch, comparing the pre- and post-major 1972 review of the NSW Shark Meshing Program (Reid and Krogh 1992). Substantial changes to the SMP are presently being implemented in the 2010–2011 season following a new joint management agreement (JMA) among the historical custodians of the program, the NSW Department of Primary Industry (now known as Industry & Investment NSW) and the NSW Department of Environment, Climate Change and Water. These changes include the reduction of maximum net soak time from 96 to 72 h, tag and release of all live sharks, dedicated collection of biological data from all deceased animals, and separation of the historical Sydney North area into two areas at North Narrabeen to ensure greater opportunity for the contractor to fulfil the more regular net-checking requirements of the JMA.
The period reported on here therefore represents the end of an era, and provides the opportunity to present historical catch in the SMP following standardised effort. The current study will examine these data in detail, presenting results for the most recent two decades of the program, and offering an extended analysis of trends in catches over the 60-year period spanning from 1950–1951 to 2009–2010 as either decadal or vicennial (20-year) periods.
Materials and methods
Collection and analysis of data
Aside from a break of 3 years during World War II (Reid and Krogh 1992), the NSW shark nets have fished almost continuously from 1937 to the present. Because records are incomplete before 1949, the current study has focussed on meshing operations from July 1950 to April 2010 (i.e. the six decades ending the final month of the 2009–2010 season). Complete data from 1990–1991 to 2009–2010 were extracted from the ongoing SMP electronic database, and for earlier years, from a combination of digital records of monthly summaries (1970–1990) and archived manual records. Data have been reported on a fiscal-year basis (from 1 July to 30 June), because this better represents the post-1987 meshing seasons, which do not encompass winter months. Information on catches and effort of the meshing operations was supplied by contractors in monthly returns. The unit of effort was net days, which were calculated directly from monthly records before 1975, and from contract requirements following this time.
Data analyses were based on linear regression models, a Loess smoothing function, which employs locally weighted linear regression (Cleveland 1993), and the Kolmogorov–Smirnov two-sample test (Siegel and Castellan 1988), using MS Excel, Sigmaplot 10 (SPSS, Chicago, IL, USA), and STATISTICA 6 (StatSoft Inc. 2001, Tulsa, OK). The Loess smoothing function essentially fits local polynomial regressions and joins them together. Being a non-parametric method, it does not provide coefficients, but it provides a method that displays the underlying structure in the data. The parameters set for the Loess smoother were span (D) of 0.33 (this determines the degree of smoothing) and polynomial degree of 1 (i.e. linear local regression).
Species identification
There are 17 species of sharks known to have been caught in the NSW SMP (Green et al. 2009). For the present study, individual data are presented for the eight most abundant species or species groups (taxa). Most of these species were accurately identified by meshing contractors, although the species of the genus Carcharhinus are difficult to distinguish, and until 1998, these sharks were all recorded as ‘whaler’. DNA results for Carcharhinus indicated that at least seven species are represented, including the recent split of blacktip sharks to include common (C. limbatus) and Australian (C. tilstoni) blacktip sharks (Boomer et al. 2010). Since 1998, contractors have been required to retain the heads of all whaler sharks for species identification by scientific staff. Tissue samples have also been collected since that time. DNA results for Sphyrna spp. have indicated only two species being caught in the program, viz. S. zygaena and S. mokarran, with the latter representing a negligible proportion of the catch (J. J. Boomer, Department of Biological Sciences, Macquarie University, pers. comm., 2010). In the present study, we collectively refer to these species as ‘hammerheads’, and group all Carcharhinus species as ‘whalers’.
Fishing methods
The nets used in the Shark Meshing Program are multifilament flat-braid polyethylene of 160-kg breaking strength and a stretched mesh size of 50–60 cm. Nets are 150 m in length and 6 m in height, leading to 12–14 meshes in depth, with a 0.67 hanging coefficient. Nets are bottom-set in water 10–12 m deep on bare sand to reduce entanglement, at a maximum offshore distance of 500 m. Although anchorage varies according to oceanographic conditions, generally, sand anchors weighing 27–30 kg are used. Present contract requirements specify nets to be set at each beach every weekend day and nine weekdays per month from September to April (inclusive). A meshing is complete when a net is run and cleared after it has been set continuously in the water for a minimum of 12 h between sunset and sunrise, up to a maximum of 96 h.
Results
Effort
Fishing effort was variable across the six decades examined. Effort was quite stable for the first 20 years (vicennium). Following a major program review in 1972, changes in the specification of nets and the number of beaches meshed increased the effort in the Hunter, Sydney North and Sydney South regions (Fig. 2a). Nine Central Coast beaches were added in January 1987, with two more beaches in this region from September 1992 (Figs 1, 2a). The winter months of June and July were removed from all contract requirements in 1983, and May and August were removed from all meshing from 1989 onwards. The net effect of these changes was that effort increased by 32% in the second vicennium, owing to an increased number of nets via addition of new beaches to the SMP. Although the removal of winter months reduced the total number of nets set per beach, total effort still increased a further 5% in the last vicennium because of the presence of Central Coast beaches in the Program.
|
Catches (total sharks)
The total catches of sharks showed an almost monotonic downward trend between 1950–1951 and 2009–2010, with the exception of a single peak centred on the early 1970s (Fig. 2b). Catch rate (mean catch per unit effort (CPUE) – number of sharks caught per 100 net days) closely followed catch (Fig. 2b); however, this pattern masks large variations in the relative catches among regions, and substantial short- and long-term fluctuations in species composition and abundance. These differences are visible on a broad level (Fig. 3), and are worthy of more detailed attention. Overall, the Hunter region has caught the most sharks, with the northern beaches catching more than the southern ones. None of the other regions exhibited similar spatial trends; however, total shark catch for the beaches within the central portion of the SMP are comparatively lower, with an increase towards the southern part of the coast (Fig. 3). Distribution of total catch per beach highlights two beaches within Sydney North (Palm Beach and North Narrabeen), plus Maroubra in Sydney South, as exhibiting an unusually high catch relative to surrounding beaches (Fig. 3). Temporal and spatial aspects will be individually explored in the following sections.

|
Regional catch and CPUE comparisons
The catches and CPUE of the northern meshed areas (Hunter and Sydney North) were initially high, spiking during the 1970s, before rapidly decreasing (Table 1). The Hunter region showed an 85% decrease in CPUE from the earliest decade to the past decade. The Central Coast was not meshed for the first three decades and thus these trends could not be examined in this other northern region of the SMP. Nevertheless, there was a decline in both catch and CPUE during the final decade for the Central Coast region (Table 1). The two southern regions (Sydney South and Illawarra) showed much more stable catches and CPUE over the six decades, with a much smaller increase in both catch and CPUE during the 1970s. During the past two decades, CPUE has shown a small increase in these southern areas, whereas it has dropped in the past decade in the other three regions (Table 1).

|
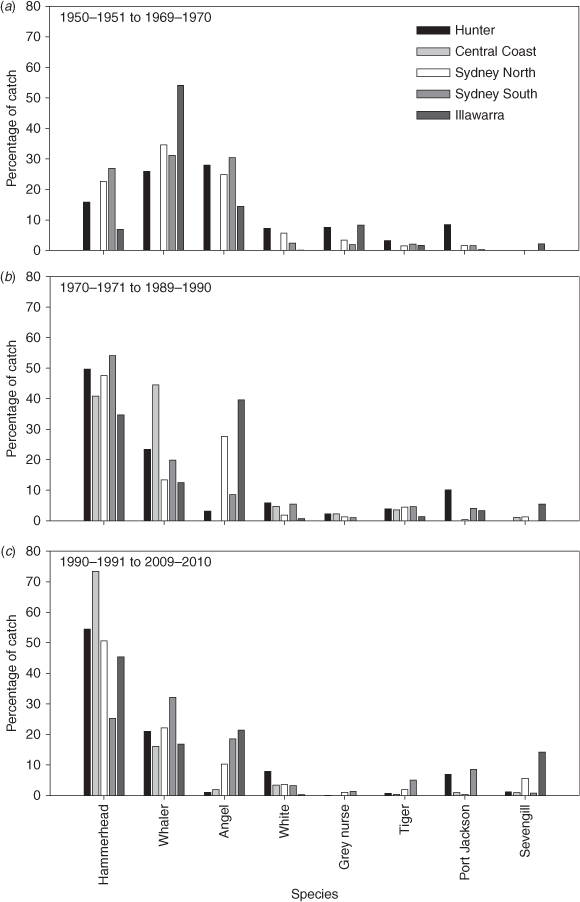
Species composition of catches between regions
The eight most abundant taxa caught over the past 60 years were hammerhead sharks (Sphyrna spp.), whaler sharks (Carcharhinus spp.), Australian angel sharks (Squatina australis), white sharks (Carcharodon carcharias), tiger sharks (Galeocerdo cuvier), sevengill sharks (Notorynchus cepedianus), Port Jackson sharks (Heterodontus portjacksoni) and grey nurse sharks (Carcharias taurus). These taxa were all caught in all five regions, with three taxa, the whalers, angel sharks and hammerhead sharks, collectively dominating the total catch each vicennium, at remarkably constant rates (84–86% each period). Nevertheless, the relative contribution of each of these, and the other species varied across both time and geographic region (Fig. 4). For example, the proportion of hammerhead sharks in the total catch more than tripled in the second 20-year period, increasing a further 10% in the third vicennium. However, on a regional basis, the third vicennium saw a return in hammerhead catches in the Sydney South region to levels more similar to that of initial catches. The marked increase in total hammerhead catches between the first and second vicennia corresponded with a decrease in the relative proportion of most other species between these periods (Fig. 4).
|
Overall the proportion of whaler sharks was generally stable over the past two vicennia, at 22% and 25% lower, respectively, than during the first vicennium. Regional differences were apparent in whaler catches for all but the past vicennium, with regions such as the Illawarra showing reduction in the proportion of whalers from 54% of catch in the first vicennium to 13–17% in the latter vicennia (Fig. 4). The overall proportion of angel sharks captured has also continually reduced across vicennia, decreasing from the first 20-year period by 19% and 45%, respectively (Fig. 4). With the exception of the sevengill shark catch, catches of the other most abundant species showed an overall pattern of reducing proportions. Sevengill sharks are the only species that has become proportionally more abundant over time, increasing by 9% from initial proportions. The bulk of this catch has always been driven by the most southern region, Illawarra (Fig. 4).
Species catch rates
The SMP is specifically aimed at catching potentially dangerous sharks. Of the three potentially dangerous species caught in the nets, two (whaler and white sharks) showed significant declines in their total annual CPUE (Fig. 5, Table 2). Declines in whaler-shark catch rates have systematically continued since 1950, reducing to approximately one-quarter of that seen at the start of the sampling period. Catch rates of white sharks also markedly decreased in the first four decades, reaching approximately one-third of that seen in the 1950s. However, catch rates have slowly increased over the past two decades, reaching the values recorded in the early 1980s. Catch rates of the third potentially dangerous species, the tiger shark, showed marked fluctuations in the first four decades, with large peaks occurring approximately every 10 years. Overall, catch rates of tiger sharks remain low, and CPUE has not significantly changed over the period investigated.
|

|
Species not targeted by the Beach Protection Program have mostly shown declining catch trends since the 1950s. Angel sharks and grey nurse sharks have declined almost monotonically, with reductions of 92% and 97%, respectively (P < 0.001; Fig. 5, Table 2), from the initial catch rates. Port Jackson sharks have always had a low, but highly variable, catch rate, with peak catch rates occurring between the early 1960s and 1970s, then reverting to the low of the first decade (1950s).
The most abundant species caught in the SMP are hammerhead sharks. CPUE of hammerhead sharks follows a temporal pattern similar to that seen in Port Jackson sharks; albeit that catch rates of this taxon peaked a decade later, in the 1970s, before returning to 1950s levels. Although CPUE for hammerheads showed no significant trend over the full 60-year period, there was a strong protracted decline over the past two decades (fitted linear regression slope = –0.064 (±0.0065), R2 = 0.84). The only taxon to show an increasing trend in catches over the period, albeit with extreme fluctuations, was the sevengill shark; however, catches of this species were extremely low (Fig. 5, Table 2).
Since 1998, all whaler sharks (Carcharhinus spp.) caught in the SMP have been identified to species level by scientific staff, using heads or teeth retained by the contractors, photographs taken by contractors or observers or from DNA analysis of flesh samples (Chan et al. 2003). Of the five most abundant whaler-shark species caught, 37% were C. obscurus, 17% C. limbatus, 14% C. brachyurus, 9% C. brevipinna and 5% C. leucas (Table 3). Unfortunately, the lack of pre-1998 species-specific catch data precluded long-term assessment of the composition of whaler sharks in the SMP.

|
Monthly variation in catches
In addition to broad-scale (vicennial) changes in catch, large inter-monthly catch variations were evident for the eight most common shark taxa (Fig. 6). The data are presented for two discrete periods that represent the period when meshing was carried out in all months (up to 1981–1982), and for the period of 8 months meshing per year from 1990–1991 onwards.

|
Four of the eight taxa showed increased catches around the summer months. Hammerhead sharks exhibited marked seasonal fluctuation in catch, with peak catches in summer months, and very low catches in the winter months in the pre-1983 period (Fig. 6). Similarly, whaler and grey nurse-shark catches exhibited substantial seasonality, with less than half of the sharks caught in the Austral winter during the year-round sampling period (Fig. 6). Tiger sharks exhibited reduced overall catches during the cooler months (September–December) in the second period; however, this was less pronounced in the year-round sampling period (Fig. 6). Angel sharks show higher proportions caught in the warmer months for both periods.
White sharks were primarily caught in the Austral spring, and the cooler winter months. Summer catches were markedly reduced, Peak white-shark catches occurred between September and December.
Two species that exhibited an even more pronounced increase in catch in Austral spring throughout both periods were Port Jackson and sevengill sharks. Port Jackson sharks were more prevalent during the early years of the SMP, whereas sevengill sharks showed a marked increase in catch during the past vicennium (Fig. 6). Over 63% of the total sevengill shark catch was landed within the past 20 years, albeit that catches equate to less than 10 sharks per year.
Size composition of catches
In addition to spatial changes in catches, we also examined temporal variations in the size composition of catches for five of the eight most common taxa. We have excluded the other three species because we wish to focus on the potentially dangerous, protected and charismatic species in the present examination. Fork lengths of sharks between 0.75 m and 4.75 m were binned into 0.5-m categories (Fig. 7). A Kolmogorov–Smirnov (KS) test (Siegel and Castellan 1988) was used to test for significant differences in distribution between successive vicennia.

|
Tiger sharks showed the biggest change in size frequencies throughout the past six decades. The number of sharks larger than 3 m in fork length has substantially reduced over each vicennium (Fig. 7). Additionally, the overall modal size of tiger sharks decreased from 3.5 m to 3.0 m during the past vicennium. The distribution of tiger-shark sizes was significantly (P < 0.05) different between successive vicennia (KS tests, D = 0.22 and 0.37, respectively). White sharks have shown a similar progressive reduction in the proportion of larger (>2.5 m) individuals caught in the nets throughout the sampling period (Fig. 7). The most recent vicennium is now dominated by 1.5–2.0-m animals. Again this shift is significant across successive vicennia (KS tests, D = 0.22 and 0.28, respectively).
Grey nurse sharks showed no shift in the modal size of catches (Fig. 7). There was a higher proportion of larger grey nurse sharks caught in the first two decades, with a decrease in the maximum size of animal meshed in the past vicennium; however, this was not statistically significant. Hammerhead sharks exhibited no shift in the modal size of catches, with remarkably little difference in the range and relative proportions of size classes among all three meshing periods (Fig. 7). There was a significant KS result between the first two vicennia for this taxon (P < 0.05, D = 0.10); however, this is an artefact of the exceptionally large sample sizes for this taxon in the second vicennium. For whalers, there has not been any consistent modal shift across the three vicennia and there was little temporal variation in the length distributions (Fig. 7).
Sex ratios and survival rates
Sex ratios and survival rates of captured animals (proportion alive at the time the net was cleared) were examined for the eight taxa of interest caught since 1972–1973, split into two periods, and for the total period, from 1972–1973 to 2009–2010 (Table 4). Data on sex and whether sharks were still alive were not recorded before 1972. Statistically significant female-biased sex ratios were found for whalers, hammerheads (in the first and total periods), and angel and grey nurse sharks. The changes in the sex ratios for hammerheads and angel shark were very substantial. Significant male-biased sex ratios were found for sevengill sharks. The taxon with the lowest net survival rate over the total sampling period was hammerhead shark (1.3% alive), whereas the highest-surviving taxon was Port Jackson shark (92.1%). There were very substantial reductions in survival rates from Period 1 to Period 2 for five of the eight taxa, viz. whalers, white, angel, grey nurse and sevengill sharks.

|
Further information on protected species
The SMP has caught relatively high numbers of two protected species, white sharks and grey nurse sharks, since its inception. Spatial and temporal catches of these species were examined in further detail.
White-shark CPUE exhibits a significant decline over the 60-year period, although there appears to be a slight increase in CPUE since the mid-1990s (Fig. 5). Regional examination of catch highlighted the apparent role of northern catches in driving this downward, with the southern regions exhibiting relatively constant catches for white sharks across the 60 years (Fig. 8a). The northern-most SMP region, the Hunter, was highlighted as the most prominent for white-shark catches (63%), even with a substantial decline in catch during the 1980s. The northern-most beach, Stockton Beach, had the highest individual beach catch for this species (18% of the Hunter catch), yet surprisingly it did not exhibit this decline in white-shark catches over the 60 years (Fig. 8a).
|
Grey nurse sharks have been caught at 36 of 51 beaches since the program’s inception. In regions except the Hunter, catch has remained low but stable across the whole period (Fig. 8b). The eight Hunter-region beaches accounted for 68% of all grey nurse sharks caught over the first three decades of meshing. Marked declines were seen in the Hunter region across this time period, reducing its levels to that recorded in other areas (Fig. 8b).
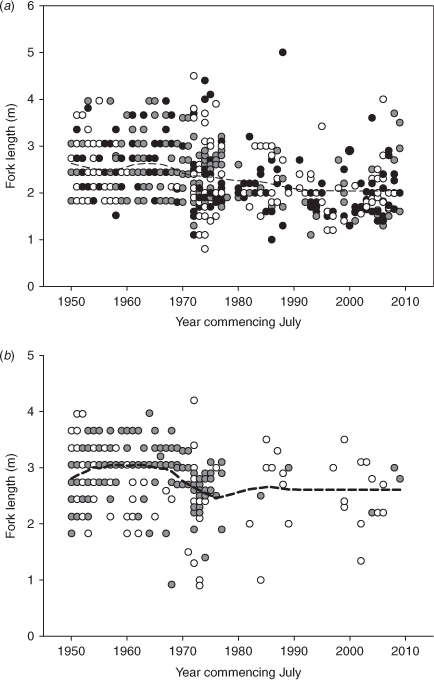
Although the sizes of both white sharks and grey nurse sharks showed a statistically significant decrease over the 60-year sample period (Fig. 9a, b; fitted regression MS = 23.03, F = 63.44, P < 0.0001; MS = 4.06, F = 17.07, P < 0.0001, respectively), this change is very small. The Loess smoother indicated relatively minor decreases, and the range of sizes seen in white-shark catches has remained relatively constant throughout the six decades (Fig. 9a). The size range of grey nurse sharks has marginally reduced since the third decade (Fig. 9b).
|
Discussion
The Shark Meshing Program has always contracted fishers to maintain and check the shark nets off the NSW coast. Since its inception off the Sydney beaches in 1937, the SMP increased the number of beaches protected by shark nets from an initial 18, up to 51 by 1992. Additionally, fishing effort changed over the years, with contractor requirements being specified through their contracts (Green et al. 2009). Reid and Krogh (1992) presented effort as the number of sets per year, whereas the current analysis investigates the effort measured as the number of days fished, which is considered a more appropriate way of presenting real effort. Although shifts in effort have complicated assessment of catch data, the overall fishing effort increased because of the addition of new beaches in the SMP until 1992. Our data indicated that the past 60 years of the SMP can be divided into three roughly 20-year periods of effort, the first being from 1950 to 1972, the second through to 1989, and the final period being since 1992. The most recent period has comprised a constant fishing effort, marginally higher than its previous period.
Relating the shark catch to the actual number of days meshed has enabled calculation of CPUEs for the SMP for individual taxa. Overall, the CPUE has mirrored the total shark catch over the course of the past 60 years. This suggests a direct relationship between the number of nets in the water and the capture of sharks. CPUE was relatively stable in the first vicennium, suggesting that catches may have been sustainable; however, after the peak in the early 1970s, catches and CPUE showed sustained declines, possibly because of a constant influx of sharks from outside the netted region contributing to the catch. Spatial assessment of the total catch across the entire coast corroborates the hypothesis that catch primarily comprises incoming sharks, because nets off northern and southern beaches consistently capture more sharks. A similar hypothesis that nets catch ‘migrants’ after their initial impact on ‘resident’ sharks has been put forward for the KwaZulu–Natal (KZN) shark-meshing program (Dudley and Cliff 1993; Dudley 1997).
The declines in CPUE and total shark catch over the past 15 years may be a result of additional pressure on shark populations outside of the SMP region, possibly owing to increased commercial fishing pressure on elasmobranchs during recent years. The commercial shark fishery in NSW has remained relatively constant at an annual average catch of 173.2 (±9.8) t since 1998 (Macbeth et al. 2009), suggesting that fishing pressure further afield may have led to the observed decrease. Considering that many of the species captured in the SMP are known to be wide-ranging, their capture in fisheries outside of NSW is to be expected. The population structure of eastern Australian coastal sharks is largely unknown; however, with the juveniles of some Carcharhinus species capable of migrations of nearly 1000 km (Merson and Pratt 2001), it is likely that large-scale, panmictic populations may exist. With commercial fisheries, such as those seen north of NSW, showing almost monotonic increases in shark catch (and CPUE) during the 1990s (Gribble et al. 2005), impacts on sharks encountered in the SMP is likely. We anticipate that developments in acoustic and satellite tracking of fish will provide substantial benefit to better understanding of shark movements and the effects of fisheries on elasmobranch populations.
Although beaches in the central region of the SMP generally report few shark catches, three beaches consistently capture more than their surrounding beaches. These beaches are Palm Beach and North Narrabeen, in the Sydney North region, and Maroubra in Sydney South. Palm Beach is set adjacent to the estuary of the largest and most productive river system within the SMP region, the Hawkesbury River, which may attract predators moving south with the prevailing East Australian Current. The next estuary to the south is Narrabeen, which has a productive reef system directly offshore that may attract sharks. Because not all beaches adjacent to estuaries exhibit higher shark catches, it is unlikely that an estuary can be inherently considered a shark-attractant. There is no obvious environmental factor that may explain the peak in catch off Maroubra. Krogh (1994) also found no environmental factors that could be correlated with beaches of higher catch. These data highlight the need for research into shark behaviour and movements around the shark nets to better understand how nets work and why sharks appear to be consistently caught at particular net installations.
Eight elasmobranch taxa represent the majority of catches in the SMP, with three taxa dominating the total catch each vicennium at remarkably constant rates of ~85% of total catch. Particularly, changes in the catch of hammerheads drove any trends in all regions except Sydney South. The hammerhead taxon is likely to comprise predominantly smooth hammerheads (Sphyrna zygaena), which are considered a poorly known and more temperate species (Last and Stevens 2009). The size range of hammerhead sharks caught indicates that they are predominantly immature animals at <2.6 m in length (Stevens 1984). Similarly, the KZN shark nets catch predominantly small smooth hammerheads (Dudley and Simpfendorfer 2006), which may indicate spatial separation of young and adult sharks in this species. It has been suggested that sustainability of shark fisheries can be enhanced through fishers targeting juvenile sharks while restricting the catch of adults in a so-called ‘gauntlet fishery’ (Prince 2005). Because smooth hammerhead sharks do not represent a major part of the observed commercial shark fishery (Macbeth et al. 2009), it is unlikely that the current levels of catches in the SMP are contributing to any potential threat to this species; however, the sharp decline over the past two decades indicates that this is a species requiring further investigation.
The second most abundant taxon in the SMP was whalers. This taxon has shown a significant decline in catch over the 60 years, particularly during the first vicennium. The Loess regression (Fig. 5) is suggestive of long-term (20-year) fluctuations in catch, with short-term (5–7-year) flattening out in the underlying decline in the 1960s, 1980s and 2000s. Unfortunately, a lack of species identification within this group precludes species-specific assessment of population trends. At least seven species of Carcharhinidae are included in this taxon (Boomer et al. 2010), many of which are mainstay species in the commercial fishery for large sharks in northern NSW (Macbeth et al. 2009). The South African shark-meshing program also catches seven Carcharhinus species, five of which are represented in the SMP (Chan et al. 2003). Two of these, the bull shark (C. leucas) and common blacktip shark (C. limbatus), showed a significant decline in CPUE over the 26-year period, as examined by Dudley and Simpfendorfer (2006). It is therefore highly likely that the overall reduction in whaler catch within the SMP may include specific species exhibiting significant population declines.
Dusky-shark catches in the SMP may particularly have an impact on the wild population, because large (>3 m) females are predominantly caught. These catches may be indicative of a reproductive stage, which is known to move closer inshore (Dudley et al. 2005). Reproduction appears to regulate movement, local abundance and distribution of several whaler sharks (Grubbs 2010) and may therefore play an important role in regulating the ‘catchability’ of sharks in the SMP. For example, substantial numbers of neonate spinner sharks, C. brevipinna, are commercially caught in the northern region of the SMP, especially around the Stockton Bight (adjoining and north of Newcastle), which may relate to the observed increased representation of this species in this region of the SMP (Industry & Investment NSW, unpubl. data).
The third most abundant taxon consistently represented in the SMP catch is the Australian angel shark. This species is caught throughout the region covered by the SMP and has exhibited an overall significant decline in catch. Between 30 and 110 t of angel shark have been annually harvested off NSW over the past two decades by the commercial fishery (Scandol et al. 2008); however, this includes also catches of the offshore eastern angel shark (Squatina albipunctata). This species is rarely found in the SMP because of its depth distribution of >130 m (Last and Stevens 2009). The ongoing significant decline and capture of predominantly pregnant Australian angel-shark females in the SMP (V. Peddemors, unpubl. data) may be symptomatic of a more fundamental problem, and highlights an urgent requirement to investigate this taxon off coastal NSW waters. Although survivorship of SMP-released sharks is unknown, over 50% are released alive, substantially more than the 36% released from the South African shark-meshing program (Dudley and Cliff 2010). Considering the above, we believe it is unlikely that the SMP is driving the apparent downward trend for the NSW population of Australian angel sharks.
Tiger sharks are one of the three species most regularly implicated in shark attacks (Cliff 1991; West 2011) and are therefore a target species for the SMP. Tiger-shark catches are traditionally low in the SMP, reflecting either a low coastal abundance or limited catchability in the gear deployed. The trend in CPUE is not statistically significant over the 60 years investigated; however, a downward trend in CPUE in the past two decades plus cessation of the cyclical peaks over the first 40 years imply changes in the population off NSW. Additionally, the significant continual decrease in the proportion of large individuals across vicennia raises concern that impacts on this population may presently be unsustainable. A similar reduction in the size of animals caught has been reported from the NSW recreational fishing sector (Park 2007). Tiger sharks are caught in the commercial shark fishery in northern NSW, representing the fifth highest species at 5.9% of the overall catch (Macbeth et al. 2009). Approximately half of these are released alive because they are not a preferred species, and it is likely that this, plus additional fishing pressures to the north, are contributing to the decline recorded in NSW. The relatively low catch in the SMP suggests that this source of mortality is unlikely to be substantially contributing to this apparent population decline. The decline is not reflected in previously published Qld shark-meshing data (Simpfendorfer 1992), whereas in KZN, this was the only species to exhibit an increasing CPUE, leading to postulation that this species may enjoy a competitive advantage within a system influenced by beach-protection programs, or that its life history is better suited to sustaining catches (Dudley and Simpfendorfer 2006). In the early years of the SMP, tiger-shark catch supported such views; however, the reduced catch over the past vicennium has highlighted the benefit of long-term data series and the role that systematic sampling such as that obtained via shark-meshing programs can have in monitoring shark-population trends in coastal waters.
The species most regularly implicated in shark attack off NSW is the white shark (West 2011). White sharks are a protected species in Australia, yet are still regularly incidentally caught in various fishing gear throughout Australia (Green et al. 2009). At a current average capture of about six white sharks per annum, the SMP catch is low; however, this is a significant reduction from the catches in the 1950s and signifies reason for continuing concern. The increasing CPUE during the past 10 years, as indicated by the Loess plot in Fig. 5, suggests that protection may be assisting population recovery, although the short time-frame for this leads us to urge caution in this interpretation. There have been consistent peaks in white-shark CPUE with a 10-year periodicity since the extraordinary peak in CPUE in the mid-1970s. The skewed northerly catch of white sharks in the SMP reflects the presence of a seasonal aggregation area for juvenile white sharks between Newcastle and Seal Rocks on the NSW coast (Bruce and Bradford 2008). This spatial relationship is confirmed by the SMP catch comprising exclusively sexually immature animals. The current catches of white sharks are predominantly from Stockton and Wattamolla beaches, with these two beaches accounting for half of the total catch of white sharks over the most recent decade. These beaches are at the boundaries of regions – Stockton being the most northerly beach in the SMP, and Wattamolla along with nearby Garie beach being located at the southern boundary of the Sydney South region, ~30 km north of the Illawarra region beaches. The water depth 500 m from the beach at Wattamolla is 18 m, compared with 10 m at most other beaches in the SMP. An additional factor in the case of Stockton beach is its proximity to the separation zone of the East Australian Current, centred on Stockton Bight. Possible reasons for these particular beaches being the source of high catches of white sharks are discussed in Werry et al. (in press), and Bruce and Bradford (in press), the latter proposing the hypothesis of an ‘in-transit’ corridor for juvenile shark movement along the 60–120-m-depth contour. This species was alive in the nets in 38% of cases for the period from 1972–1973 to 2009–2010, and in 16% of cases for the past decade, which is surprisingly high for a ram-ventilating species. This suggests that a significant proportion of netted individuals were rapidly discovered in the nets.
The second protected shark species captured in the SMP is the grey nurse shark. This species has been caught throughout the SMP region at low, but stable, regional levels; however, the total CPUE has significantly declined over the 60 years of the present study. This decline corresponds to a period in NSW history where grey nurse sharks were heavily targeted in the mistaken belief that they were responsible for shark attacks, and is unlikely to be due to the SMP’s influence. Nevertheless, the small, but significant, decline in maximum size caught is also an indicator that the population is still under pressure. In NSW the SMP is listed as a Key Threatening Process for grey nurse sharks, although the current annual mortality of between one and two sharks per year is unlikely to affect the viability of this population (Bradshaw et al. 2008). Whatever the cause for this ongoing decline, current conservation measures appear to have limited value. Unfortunately, the lack of peaks in capture at any beaches, even for beaches such as Maroubra, which is within close proximity to a grey nurse shark Critical Habitat, precludes attempts to reduce capture of this Critically Endangered species. The small population size (Cardno Ecology Laboratory 2010), genetic isolation of the eastern-coast population of grey nurse sharks (Stow et al. 2006; Ahonen et al. 2009), plus ongoing captures in commercial (Macbeth et al. 2009) and recreational (Bansemer and Bennett 2010) fishing gear all combine with ongoing catches in the NSW and Qld shark-meshing programs to contributing to the threatened nature of this population. Ongoing attempts to reduce negative human-induced effects should therefore continue to be a priority for this species.
Sevengill sharks are caught at low levels in the SMP, yet this is the only species for which there has been a significant increase in CPUE over the period examined. The inter-annual stochasticity of the catches, their propensity for capture in the Austral spring and the southern distribution of their catch all imply that the range extension of this species into NSW waters may be environmentally regulated. Distribution and abundance of sevengill sharks have been correlated with water temperature throughout their range, with similar summer increases in near-shore distribution recorded off Tasmania (Barnett et al. 2010). Surprisingly, sharks tagged off Tasmania have been found off NSW (A. Barnett, University of Tasmania, pers. comm., 2010); however, it is unknown which factors would cause such large-scale spatial variation in individual seasonal movements. Sevengill sharks are considered to be one of the most important apex predators in temperate coastal systems (Ebert 2002; Lucifora et al. 2005) and, given the diversity of their diet, may be taking advantage of a niche vacated by other species with reduced populations. Similar niche occupation has been postulated for tiger sharks in more tropical environs (Heithaus et al. 2010).
The substantial decrease in the survival rates (number of sharks alive in the nets when cleared) for five taxa (whalers, white, grey nurse, angel and hammerheads) cannot be explained on the basis of the data collected from the SMP. The relatively small change in the survival rates of tiger sharks between periods indicates that this species is probably much more robust than are the taxa showing large decreases in the past vicennium. A high survival rate in the nets for tiger sharks is also apparent in South Africa, where survival rate in nets for the period 1989–2003 was 42% (Dudley and Simpfendorfer 2006). It is likely that the reduced survival of the five other taxa is because of an increase in actual soak times of nets in the past vicennium. Effort data reported by contractors are generally the nominal effort required under the contract, apart from occasions where bad weather or adverse sea conditions prevented checking or clearing of nets.
In conclusion, the standardised 60-year dataset of shark captures in coastal NSW waters has provided a unique insight into potential changes in shark populations off this coast. Although shark-meshing programs have attracted their fair share of criticism (Dudley and Cliff 2010), studies such as the present one and those off KZN (Dudley and Simpfendorfer 2006) have provided data that would otherwise not be available for managers to develop sustainable management protocols for coastal sharks. This highlights the importance of ensuring ongoing scientific investment in these programs to ensure that quality data are collected so as to enhance our understanding of how these nets work and the mitigation of any negative impacts they may have both at a species and an ecosystem level.
Acknowledgements
The authors are grateful to John Stewart, Julian Hughes and Steven Montgomery, NSW Industry & Investment, the referees and guest editors for very thorough and useful reviews and comments which led to a greatly improved manuscript.
References
Ahonen, H., Harcourt, R. G., and Stow, A. J. (2009). Nuclear and mitochondrial DNA reveals isolation of imperilled grey nurse shark populations (Carcharias taurus). Molecular Ecology 18, 4409–4421.| Nuclear and mitochondrial DNA reveals isolation of imperilled grey nurse shark populations (Carcharias taurus).Crossref | GoogleScholarGoogle Scholar | 1:CAS:528:DC%2BD1MXhsFaitrbE&md5=be2d4d6d63fe4b147f544035c133649fCAS | 19804378PubMed |
Bansemer, C. S., and Bennett, M. B. (2010). Retained fishing gear and associated injuries in the east Australian grey nurse sharks (Carcharias taurus): implications for population recovery. Marine and Freshwater Research 61, 97–103.
| Retained fishing gear and associated injuries in the east Australian grey nurse sharks (Carcharias taurus): implications for population recovery.Crossref | GoogleScholarGoogle Scholar |
Barnett, A., Stevens, J. D., Frusher, S. D., and Semmens, J. M. (2010). Seasonal occurrence and population structure of the broadnose sevengill shark Notorynchus cepedianus in coastal habitats of south-east Tasmania. Journal of Fish Biology 77, 1688–1701.
| Seasonal occurrence and population structure of the broadnose sevengill shark Notorynchus cepedianus in coastal habitats of south-east Tasmania.Crossref | GoogleScholarGoogle Scholar | 1:STN:280:DC%2BC3cbnt1SisA%3D%3D&md5=873b3b04a7fe4956856681344a6e4fdcCAS | 21078027PubMed |
Boomer, J. J., Peddemors, V., and Stow, A. J. (2010). Genetic data show that Carcharhinus tilstoni is not confined to the tropics, highlighting the importance of a multifaceted approach to species identification. Journal of Fish Biology 77, 1165–1172.
| Genetic data show that Carcharhinus tilstoni is not confined to the tropics, highlighting the importance of a multifaceted approach to species identification.Crossref | GoogleScholarGoogle Scholar | 1:CAS:528:DC%2BC3cXhsFOntLjL&md5=325887e6915f804774b14385cec3405dCAS | 21039498PubMed |
Bradshaw, C. J. A., Peddemors, V. M., McAuley, R. B., and Harcourt, R. G. (2008). Population viability of eastern Australian grey nurse sharks under fishing mitigation and climate change. Final Report to the Commonwealth of Australia, Department of the Environment, Water, Heritage and the Arts, Sydney.
Bruce, B. D., and Bradford, R. W. (2008). Spatial dynamics and habitat preferences of juvenile white sharks [electronic resource]: identifying critical habitat and options for monitoring recruitment. Final Report to the Department of the Environment, Water, Heritage and the Arts, Hobart.
Bruce, B. D., and Bradford, R. W. (in press). Spatial dynamics and habitat preferences of juvenile white sharks Carcharodon carcharias in eastern Australia. In ‘Global Perspectives on the Biology and Life History of the Great White Shark’. (Ed. M. Domeier.) (CRC Press: Boca Raton, FL.)
Cardno Ecology Laboratory (2010). Development and implementation of a population estimation protocol to provide an estimate of east coast population numbers for grey nurse sharks (Carcharias taurus). Final Report to the Department of the Environment, Water, Heritage and the Arts, Sydney.
Chan, R. W. K., Dixon, P. I., Pepperell, J. G., and Reid, D. D. (2003). Application of DNA-based techniques for the identification of whaler sharks (Carcharhinus spp.) caught in protective beach meshing and by recreational fisheries off the coast of New South Wales. Fishery Bulletin 101, 910–914.
Cleveland, W. S. (1993). ‘Visualizing Data.’ (Hobart Press: Summit, NJ.)
Cliff, G. (1991). Shark attackes on the South African coast between 1960 and 1990. South African Journal of Science 87, 513–518.
Cliff, G., and Dudley, S. F. J. (1992). Protection against shark attack in South Africa, 1952 to 1990. In ‘Sharks: Biology and Fisheries’. (Ed. J. G. Pepperell.) Australian Journal of Marine and Freshwater Research 43, 263–272.
| Protection against shark attack in South Africa, 1952 to 1990. In ‘Sharks: Biology and Fisheries’. (Ed. J. G. Pepperell.)Crossref | GoogleScholarGoogle Scholar |
Cockcroft, V. G. (1990). Dolphin catches in the Natal shark nets, 1980 to 1988. South African Journal of Wildlife Research 20, 44–51.
Davies, D. H. (1964). ‘About Sharks and Shark Attack.’ (Shuter and Shooter: Pietermaritzburg, South Africa.)
Dudley, S. F. J. (1997). A comparison of the shark control programs of New South Wales and Queensland (Australia) and KwaZulu–Natal (South Africa). Ocean and Coastal Management 34, 1–27.
| A comparison of the shark control programs of New South Wales and Queensland (Australia) and KwaZulu–Natal (South Africa).Crossref | GoogleScholarGoogle Scholar |
Dudley, S. F. J., and Cliff, G. (1993). Some effects of shark nets on the Natal nearshore environment. Environmental Biology of Fishes 36, 243–255.
| Some effects of shark nets on the Natal nearshore environment.Crossref | GoogleScholarGoogle Scholar |
Dudley, S. F. J., and Cliff, G. (2010). Shark control: methods, efficacy, and ecological impact. In ‘Sharks and their Relatives II – Biodiversity, Adaptive Physiology, and Conservation’. (Eds J. C. Carrier, J. A. Musick and M. R. Heithaus.) pp. 567–591. (CRC Press: Boca Raton, FL.)
Dudley, S. F. J., and Gribble, N. A. (1999). Management of shark control programmes. In ‘Case Studies of the Management of Elasmobranch Fisheries’. (Ed. R. Shotton.) pp. 480–920. FAO Fisheries Technical Paper. No. 378, part 2. (Food and Agriculture Organization of the United Nations: Rome.)
Dudley, S. F. J., and Simpfendorfer, C. (2006). Population status of 14 shark species caught in the protective gillnets off KwaZulu–Natal beaches, South Africa, 1978–2003. Marine and Freshwater Research 57, 225–240.
| Population status of 14 shark species caught in the protective gillnets off KwaZulu–Natal beaches, South Africa, 1978–2003.Crossref | GoogleScholarGoogle Scholar |
Dudley, S. F. J., Cliff, G., Zungu, M. P., and Smale, M. J. (2005). Sharks caught in the protective gillnets off KwaZulu–Natal, South Africa. X. The dusky shark Carcharhinus obscurus (Lesueur 1818). African Journal of Marine Science 27, 107–127.
| Sharks caught in the protective gillnets off KwaZulu–Natal, South Africa. X. The dusky shark Carcharhinus obscurus (Lesueur 1818).Crossref | GoogleScholarGoogle Scholar |
Ebert, D. A. (2002). Ontogenetic changes in the diet of the sevengill shark (Notorynchus cepedianus). Marine and Freshwater Research 53, 517–523.
| Ontogenetic changes in the diet of the sevengill shark (Notorynchus cepedianus).Crossref | GoogleScholarGoogle Scholar |
Francis, M. P. (1998). New Zealand shark fisheries: development, size and management. Marine and Freshwater Research 49, 579–591.
| New Zealand shark fisheries: development, size and management.Crossref | GoogleScholarGoogle Scholar |
Green, M., Ganassin, C., and Reid, D. D. (2009). Report into the NSW Shark Meshing (bather protection) Program. New South Wales Department of Primary Industry. Available at http://www.dpi.nsw.gov.au/__data/assets/pdf_file/0008/276029/Report-into-the-NSW-Shark-Meshing-Program.pdf [accessed May 2011].
Gribble, N. A., McPherson, G., and Lane, B. (1998). Effect of the Queensland Shark Control Program on non-target species: whale, dugong, turtle and dolphin: a review. Marine and Freshwater Research 49, 645–651.
| Effect of the Queensland Shark Control Program on non-target species: whale, dugong, turtle and dolphin: a review.Crossref | GoogleScholarGoogle Scholar |
Gribble, N. A., Whybird, O., Williams, L., and Garrett, R. (2005). Fishery assessment update 1988–2003: Queensland east coast shark. Department of Primary Industries and Fisheries, Brisbane, Queensland. Report #QI04070.
Grubbs, R. D. (2010). Ontogenetic shifts in movements and habitat use. In ‘Sharks and Their Relatives II. Biodiversity, Adaptive Physiology and Conservation’. (Eds J. C. Carrier, J. A. Musick and M. R. Heithaus.) pp. 319–350. (CRC Press: Boca Raton, FL.)
Heinsohn, G. E. (1972). A study of dugongs (Dugong dugong) in north Queensland Australia. Biological Conservation 4, 205–213.
| A study of dugongs (Dugong dugong) in north Queensland Australia.Crossref | GoogleScholarGoogle Scholar |
Heithaus, M. R., Frid, A., Vaudo, J. J., Worm, B., and Wirsing, A. J. (2010). Unraveling the ecological Importance of elasmobranchs. In ‘Sharks and Their Relatives II. Biodiversity, Adaptive Physiology and Conservation’. (Eds J. C. Carrier, J. A. Musick and M. R. Heithaus.) pp. 611–637. (CRC Press: Boca Raton, FL.)
Krogh, M. (1994). Spatial, seasonal and biological analysis of sharks caught in the New South Wales protective beach meshing programme. Australian Journal of Marine and Freshwater Research 45, 1087–1106.
| Spatial, seasonal and biological analysis of sharks caught in the New South Wales protective beach meshing programme.Crossref | GoogleScholarGoogle Scholar |
Last, P. R., and Stevens, J. D. (2009). ‘Sharks and Rays of Australia.’ 2nd edn. (CSIRO Publishing: Melbourne.)
Lucifora, L. O., Menni, R. C., and Escalante, A. H. (2005). Reproduction, abundance and feeding habits of the broadnose sevengill shark Notorynchus cepedianus in north Patagonia, Argentina. Marine Ecology Progress Series 289, 237–244.
| Reproduction, abundance and feeding habits of the broadnose sevengill shark Notorynchus cepedianus in north Patagonia, Argentina.Crossref | GoogleScholarGoogle Scholar |
Macbeth, W. G., Geraghty, P. T., Peddemors, V. M., and Gray, C. A. (2009). Observer-based study of targeted commercial fishing for large shark species in waters off northern New South Wales. Industry & Investment NSW, Sydney, Final Report Series No. 114.
Merson, R. R., and Pratt, H. L. (2001). Distribution, movements and growth of young sandbar sharks, Carcharhinus plumbeus, in the nursery grounds of Delaware Bay. Environmental Biology of Fishes 61, 13–24.
| Distribution, movements and growth of young sandbar sharks, Carcharhinus plumbeus, in the nursery grounds of Delaware Bay.Crossref | GoogleScholarGoogle Scholar |
New South Wales Shark Menace Committee (1929). Summary of New South Wales Shark Menace Committee’s Report. NSW Government Printer, Sydney.
Park, T. (2007). NSW Gamefish Tournament Monitoring – Angling Research Tournament Monitoring Program. NSW DPI Fisheries, Sydeney, Final Report Series No. 94.
Paterson, R. A. (1979). Shark meshing takes a heavy toll of harmless marine animals. Australian Fisheries 38, 17–33.
Paterson, R. A. (1986). Shark prevention measure working well. Australian Fisheries 45, 12–18.
Paterson, R. A. (1990). Effects of long-term anti-shark measures on target- and non-target species in Queensland, Australia. Biological Conservation 52, 147–159.
| Effects of long-term anti-shark measures on target- and non-target species in Queensland, Australia.Crossref | GoogleScholarGoogle Scholar |
Prince J. D. (2005 ). Gauntlet fisheries for elasmobranchs – the secret of sustainable shark fisheries. Journal of Northwest Atlantic Fisheries Science 35 , 407–416
Reid, D. D., and Krogh, M. (1992). Assessment of catches from protective shark meshing off New South Wales beaches between 1950 and 1990. Australian Journal of Marine and Freshwater Research 43, 283–296.
| Assessment of catches from protective shark meshing off New South Wales beaches between 1950 and 1990.Crossref | GoogleScholarGoogle Scholar |
Scandol, J., Rowling, K., and Graham, K. (2008). Angel Shark. In ‘Status of Fisheries Resources in NSW 2006/07’. (Eds J. Scandol, K. Rowling and K. Graham.) pp. 1–3. (NSW Industry & Investment: Sydney.)
Siegel, S., and Castellan, N. J., Jr (1988). ‘Nonparametric Statistics for the Behavioural Sciences.’ 2nd edn. (McGraw Hill: London.)
Simpfendorfer, C. (1992). Biology of tiger sharks (Galeocerdo cuvier) caught in the Queensland shark meshing program off Townsville, Australia. Australian Journal of Marine and Freshwater Research 43, 33–43.
| Biology of tiger sharks (Galeocerdo cuvier) caught in the Queensland shark meshing program off Townsville, Australia.Crossref | GoogleScholarGoogle Scholar |
Simpfendorfer, C. (1993). The Queensland shark meshing program: analysis of results from Townsville, north Queensland. In ‘Shark Conservation. Proceedings of an International Workshop on the Conservation of Elasmobranchs’. 24 February 1991, Sydney, Australia. (Eds J. G. Pepperell, J. West and P. Woon.) pp. 71–85. (Zoological Parks Board of NSW: Sydney.)
Stevens, J. D. (1984). Biological observations on sharks caught by sport fishermen off New South Wales. Australian Journal of Marine and Freshwater Research 35, 573–590.
| Biological observations on sharks caught by sport fishermen off New South Wales.Crossref | GoogleScholarGoogle Scholar |
Stow, A., Zenger, K., Briscoe, D., Gillings, M., Peddemors, V., Otway, N., and Harcourt, R. (2006). Isolation and genetic diversity of endangered grey nurse shark (Carcharias taurus) populations. Biology Letters 2, 308–311.
| Isolation and genetic diversity of endangered grey nurse shark (Carcharias taurus) populations.Crossref | GoogleScholarGoogle Scholar | 17148390PubMed |
Werry, J. M., Bruce, B., Sumpton, W., Reid, D., and Mayer, D. G. (In Press). Beach areas preferred by juvenile white shark, Carcharodon carcharias, in eastern Australia from long-term catch-per-unit-effort and movement. In ‘Global Perspectives on the Biology and Life History of the Great White Shark’. (Ed. M. L. Domeier.) (CRC Press: Boca Raton, FL.)
West, J. G. (2011). Shark attacks in Australian waters, 1790–2009. Marine and Freshwater Research 62, 744–754.
| Shark attacks in Australian waters, 1790–2009.Crossref | GoogleScholarGoogle Scholar |