

Subjective judgement in data subsetting: implications for CPUE standardisation and stock assessment of non-target chondrichthyans
J. M. Braccini A C D , M.-P. Etienne A B and S. J. D. Martell AA Fisheries Centre, The University of British Columbia, Vancouver, BC V6T1Z4, Canada.
B AgroParisTech, UMR MIA 518, 75231 Paris, France.
C Agri-Science Queensland, Queensland Department of Employment, Economic Development and Innovation, Ecoscience Precinct, GPO Box 46, Brisbane, Qld 4001, Australia.
D Corresponding author. Email: m.braccini@fisheries.ubc.ca
Marine and Freshwater Research 62(6) 734-743 https://doi.org/10.1071/MF10172
Submitted: 26 June 2010 Accepted: 10 November 2010 Published: 24 June 2011
Journal Compilation © CSIRO Publishing 2011 Open Access CC BY-NC-ND
Abstract
Standardisation of catch-per-effort (CPUE) data is an essential component for nearly all stock assessments. The first step in CPUE standardisation is to separate the comparable from the non-comparable catch and effort records and this is normally done based on subjective rules. In the present study, we used catch-and-effort data from the elephant fish (Callorhinchus milii) to illustrate the differences in CPUE when using expert judgement to define different ad hoc selection criteria used to subset these data. The data subsets were then used in the standardisation of CPUE and the stock assessment of elephant fish. The catch-and-effort subsets produced different patterns of precision and trends, each of which led to different estimates (and related uncertainty) of model parameters and management reference points. For most CPUE series, there was a very high probability that the elephant fish stock is overexploited and that overfishing is occurring. The estimates of total allowable catch (TAC) and the uncertainty around these estimates also varied considerably depending on the CPUE series used. Our study shows how sensitive TAC estimation is when there is high uncertainty in the definition of the fishing effort targeted at the species analysed.
Additional keywords: Bayesian, chimaeras, rays, sharks, subjectivity, uncertainty.
Introduction
The increasing global catches of chondrichthyans (sharks, rays, and chimaeras), their particular life-history traits (e.g. low fecundity, late maturation, slow growth) and the several examples of overexploitation of chondrichthyan stocks worldwide (see Walker 1998 for a review) have led to a growing concern about the conservation of this group and a requirement for improved management (FAO 2000). One approach to achieving improvement is to use quantitative fisheries management, which relies on scientific advice based on the results of some form of stock assessment method (Hilborn and Walters 1992). Fisheries stock assessment models are normally fit to time series data on relative abundance by estimating model parameters using maximum likelihood or Bayesian methods. These parameterised models are then used to calculate quantities of interest to decision makers (e.g. a decision table on total allowable catch). Generally, the minimum data required in these stock assessment models include information on removals owing to harvesting and an index of relative abundance (Maunder and Punt 2004). For chondrichthyans, the most commonly available data for stock assessment are information on commercial catch and effort (e.g. Olsen 1959; Punt et al. 2000). This information is summarised in the form of catch-per-effort (CPUE) to infer trends in the abundance of a species and it is normally assumed that CPUE is proportional to abundance. The dangers of basing stock assessments on ‘raw’ CPUE have been widely recognised and CPUE is typically standardised to remove factors other than abundance that affect trends through time (Maunder and Punt 2004).
Most chondrichthyan species are taken in multispecies fisheries that typically target other more profitable groups such as teleosts and invertebrates. For standardising the CPUE of a chondrichthyan species taken in a multispecies fishery, it is desirable to use only the effort that was directed at this species (Maunder and Punt 2004). Therefore, the initial step in CPUE standardisation involves the subsetting of the catch-and-effort dataset to separate the comparable from the non-comparable records. An objective approach to subsetting catch and effort records requires an understanding of whether each particular shot occurred in a habitat where the species of interest is likely to occur; this can be inferred from specific information on fishing location or from the species composition of the fishing set (Stephens and MacCall 2004).
However, this information is rarely available for chondrichthyan species. Therefore, in most cases, the data subsetting process is based on defining ad hoc subjective decision rules. These decision rules are based on expert judgement (e.g. by scientists and participants in the fishery) for selecting the records of fishers who appear to target the species in consideration (Maunder and Punt 2004). For example, Punt et al. (2000) based the CPUE standardisation for school shark (Galeorhinus galeus), a previously targeted species, on a subset of ‘indicative’ vessels that satisfied all the following criteria: the vessel must have recorded shark catch for a minimum of five years, the vessel’s combined median annual catch of gummy (Mustelus antarcticus) and school sharks must be ≥10 metric tonnes, and the vessel’s median annual catch of school shark must be ≥5 metric tonnes. For chondrichthyan species that are not targeted (the majority of the species), decision rules for selecting informative records are not easily defined. In this study, we illustrate the effects of the uncertainty in defining rules for selecting informative records for CPUE standardisation and its consequences on the stock assessment of a non-targeted species using the elephant fish (Callorhinchus milii) taken in Australia’s Southern Shark Fishery.
The Southern Shark Fishery is the most important chondrichthyan fishery in Australia (Shark Advisory Group and Lack 2004). The fishery began in the mid-1920s as a longline fishery targeting school shark but in the early 1970s the fishery shifted to a gill-net fishery targeting mainly gummy shark. The analysis of catch and effort data in this fishery is complicated because the fishery is multispecies, targeting practices changed from school to gummy shark, and many operators are diversified, entering the fishery only when catch rates are high or when their access to other fisheries is denied (Punt et al. 2000).
The elephant fish is mostly taken in Bass Strait as a byproduct of the shark fishery off southern Australia. In addition, recreational fishers target breeding aggregations of elephant fish when mature males and females migrate from the continental shelf to specialised coastal areas for mating and laying eggs during February–May (Braccini et al. 2009). To assess the combined impact of commercial and recreational harvesting on elephant fish, an index of abundance must be constructed and a population dynamics model fitted to this index. For elephant fish, there are no reliable time-series of abundance; hence, stock assessment relies solely on standardised commercial CPUE. The problem is, however, that there is not a clear definition of ‘indicative’ vessels for elephant fish. For this reason, Punt et al. (2004) based a preliminary stock assessment of elephant fish on CPUE derived from standardised gummy shark effort (on the assumption that elephant fish and gummy sharks co-occur in similar habitats). In contrast, Boero Rodriguez and McLoughlin (2009) standardised the elephant fish CPUE following a very basic subsetting criteria with minimum data removal. Not surprisingly, the two CPUE series show different trends.
To address the uncertainty in defining ‘indicative’ vessels for elephant fish in Bass Strait, we used expert judgement to identify possible criteria for selecting ‘indicative’ vessels and generate different subsets of catch-and-effort data. We used the data subsets to construct standardised CPUE time-series, fit a population dynamics model to these data, and then compare estimates of current stock status and policy options that would result from each expert judgement used to subsample the data.
Methods
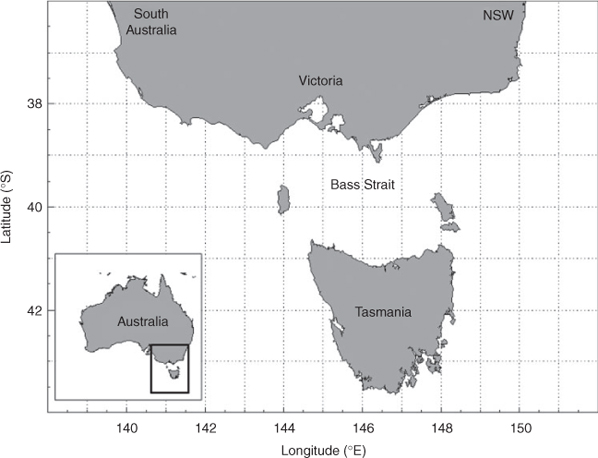
Three steps were adopted in this study. First, commercial catch-and-effort data considered suitable for inclusion in the CPUE standardisation were selected from amongst the available data using different selection criteria, resulting in six different data subsets. Second, for each data subset, CPUE-based indices of abundance were constructed for each of the statistical cells in the fishery for the Bass Strait region (Fig. 1). Catch-and-effort data available for Tasmania and South Australia were not used to construct the CPUE series. The bulk of the elephant fish catch is taken in Bass Strait; therefore, CPUE trends for Bass Strait were considered representative of the whole stock. These abundance indices were then combined to provide annual trends in abundance. Finally, the annual abundance indices were used in a simple Schaefer production model to determine the current stock status of elephant fish in Bass Strait.
|
Data subsetting
Commercial catch-and-effort data used for constructing the CPUE-based indices of abundance were sourced from the Southern Shark Fishery Monitoring Database (SSFMDB) for the period 1976–2006. Some of the records were rejected because data needed for the CPUE standardisation analysis were missing (e.g. no information on effort, statistical cell, depth, or gear type). For Bass Strait and the period 1976–2006, the SSFMDB contains records for 339 vessels; however, most of these vessels caught elephant fish infrequently. Therefore, the CPUE standardisation had to be done on a subset of ‘indicative’ vessels. Six different data subsets were created based on criteria identified by experts for determining ‘indicative’ vessels. Dataset one (D1) was built based on the following criteria: vessels with a positive annual catch of elephant fish (to remove vessels that consistently do not report elephant fish catch) and records occurring in ≤80 m depth (as the majority of the stock occurs within 80-m depth: Walker and Gason 2009; advised by T. I. Walker, pers. comm.). Dataset two (D2) was based on vessels with a positive annual catch of elephant fish and records for gummy shark targeting (with targeting of gummy sharks defined as records where gummy shark catch is at least 70% of the total shark catch, advised by T. I. Walker, pers. comm.). Dataset three (D3) was based on vessels with a positive annual catch of elephant fish and vessels that exclusively fished in Bass Strait (vessels that fished in both Bass Strait and Tasmania are considered to under report elephant fish catch, advised by T. I. Walker, pers. comm.).
Punt et al. (2004) assumed that the effort targeted at gummy shark is an appropriate measure of the effort directed towards elephant fish. Therefore, dataset four (D4) was based on the criteria used by Punt et al. (2004) to select vessels considered to be targeting gummy shark (in the fishery for at least five years, a median annual catch (all sharks) of at least 10 metric tonnes (t), a median annual catch (gummy shark) of 5 t, and gummy shark constituting more than 60% of the total shark catch). Dataset five (D5) was built based on the criterion used by Boero Rodriguez and McLoughlin (2009): vessels that caught elephant fish in more than 10 per cent of their shots (i.e. net deployments). These authors, following recommendations by the Shark Fishery Resource Assessment Group, discarded the years previous to 1980 arguing that fishers’ behaviour before 1980 was very different and that the inclusion of these years would introduce unnecessary noise in their CPUE standardisation. Therefore, we created a sixth dataset (D6), similar to D5 but excluding the period 1976–1979.
As for other CPUE standardisations of chondrichthyans taken in the studied fishery (e.g. Punt et al. 2000), the analyses were further constrained to records using 6-inch (15-cm) mesh gill-nets because over 93% of the catch was taken using 6-inch mesh. Data for longlines and other mesh sizes are not included because of paucity of data for these gear types and negligible catches.
CPUE standardisation
Following Zhang and Holmes (2009), a Bayesian generalised linear hierarchical model was developed for standardising elephant fish commercial CPUE. The hierarchical modelling approach, also known as Generalised Linear Mixed Models (GLMM), is convenient because it can predict CPUEs for un-fished fishing cells based on the estimated effects of the explanatory variables as long as these cells were fished in some of the years (Zhang and Holmes 2009). The explanatory variables included in the model were year, season, area (statistical cell), depth (divided into three levels: 0–19 m; 20–80 m; and >80 m), vessel, and the interaction between year and area. Vessel and the year–area interaction were considered random explanatory variables.
Owing to the high percentage of zero catches, a two part Delta-lognormal model was used (Vignaux 1994). This method is convenient because it calculates separately the probability of a non-zero observation, the CPUE for the non-zero observations, and then combines the two. The two probability models used are:


where Ni,j,k,l,m, pi,j,k,l,m, and TNi,j,k,l,m are the observed number of non-zero catches, the probability of obtaining a non-zero catch in a single event, and the total number of fishing events, respectively, during Year i, in Season j, at Area k, at Depth l, and from Vessel m. The terms Ui,j,k,l,m and  are the observed non-zero CPUE, and the mean of the distribution on the log scale for non-zero CPUEs, respectively, during Year i, in Season j, at Area k, at Depth l, and from Vessel m, and σ is the standard deviation of the distribution on the log scale.
The binomial probability, pi,j,k,l,m, is associated with the explanatory variables through the Logit link function:
where p0 is the intercept, pyi, psj, pak, pdl, and pvm are the effects of Year i, Season j, Area k, Depth l, and Vessel m respectively, on the probability, and pyai,k is the interaction between Year i and Area k, respectively, on the probability. We modelled the effects of Vessel and the interaction between Area and Year as normal random effects owing to the large number of levels for these factors and because, although those effects are not of direct interest, the variability caused by them has to be accounted for. Note that from a parsimonious point of view the interaction between Area and Year was treated as a random effect. Given that elephant fish are not targeted, the reason for missing records is not linked to the quantities to be estimated, making it reasonable to assume that missing records do not produce important bias in the variance estimates of the random effects. Therefore:

The mean CPUE,  , is estimated based on the effects of the explanatory variables:

where c0 is the intercept, cyi, csj, cak, cdl, and cvm are the effects of Year i, Season j, Area k, Depth l, and Vessel m respectively, and cyai,k is the interaction between Year i and Area k. As for the zero part, the effect of Vessel and the interaction between Year and Area were modelled as random effects:

For the binomial and lognormal models, the chosen identifiability constraints for the parameters were to assign a value of 0 to the effects of Year 1, Season 1, Area 1, Depth 1, Vessel 1, and to the interactive effects between Year 1 and all areas, and Area 1 and all years. Following Campbell (2004) and Maunder and Punt (2004), the final delta-lognormal index of abundance was produced by multiplying the year effect generated from the binomial and lognormal models.
Uninformative priors were assigned to all parameters and hyperparameters (Zhang and Holmes 2009). The parameters c0, cy, cs, ca, cd, p0, py, ps, pa, and pd were assigned a normal distribution with mean 0 and variance 100 000; The priors on the variance terms for the random effects σPV2, σPya2, σCv2, and σCya2 were assigned an inverse Gamma distribution (IGamma(0.01,0.01)).
The GLMM was coded in WinBUGS1.4 (Spiegelhalter et al. 2003). We used two MCMC chains (200 000 iterations) with the first 100 000 samples from the posterior treated as a burn-in period. Owing to the high auto-correlation in the MCMC chains, a thinning of 100 was used to keep the following 1000 iterations.
Biomass dynamic model
A Bayesian surplus production model was used to determine the current status of the stock and its sensitivity to the different criteria used to build the standardised CPUE series. The state-space model was based on the parameterisation by Meyer and Millar (1999), where biomass is divided by K (carrying capacity) to improve convergence. Priors were needed for the model parameters and the catchability coefficients. Initial biomass (year = 1976) was assumed to be equal to K. The population intrinsic rate of increase (r) was assigned an informative prior (truncated between 0.01 and 0.99) following a normal distribution with mean 0.234 and standard deviation of 0.1. The mean and standard deviation for r were obtained from a demographic analysis designed by McAllister et al. (2001) to construct Bayesian priors for r. This analysis involved the development of probability density functions for population parameters (e.g. fecundity, age-at-maturity) and the selection of random samples (n = 10 000 iterations) from these distributions for the calculation of r (see Braccini et al. 2006, for an example of a detailed description of this methodology).
The priors for the remaining parameters were vague or non-informative. The prior for K was lognormal with mean 1000 (truncated between 500 and 10 000) and a standard deviation of 1.2 (in logspace). The prior for q had a log-uniform distribution in the interval [0.000001, 0.1]. Process error was assumed to have a standard deviation uniformly distributed [0.01, 0.2], and observation error was assumed to have a fixed standard deviation equal to 0.35. It would also be possible to jointly estimate the total error and partition the total error into process and observation error components using variance partitioning where an informative prior would be required for the fraction of the total error that is associated with say observation errors (e.g. see variance transformations in table 4 in Schnute and Kronlund 2002). In this application, we opted to fix the standard deviation for the observation errors; this is equivalent to using a very informative prior and relaxing this prior would likely result in increased uncertainty.
Generally, a two-step procedure is used when fitting a population dynamics model. First, an abundance index is computed: if X denotes covariates (e.g. Year, Area) and θ denotes a vector of parameters from the delta GLMM, then the abundance index for Year y is a function of θ and X, Iy = f(X, θ). The posterior distribution for Iy, π(Iy|Catch, X) is then derived from the posterior distribution of the parameters θ, f(X, θ) p(θ|Catch, X). A point estimate for Iy, denoted  , is then chosen and the variability associated to Iy is omitted. The second step consists of defining the posterior distribution of the population dynamics model parameters, φ, given the abundance index
  , π(φ|
 ,…,
,…,  ). This two-step procedure omits the variability associated with the abundance index and its impact on the variability of the φ parameters of the Schaefer model. Maunder (2001) showed how the integration of CPUE standardisation into stock assessment models provides more accurate parameter estimates than the more commonly used two-step procedure. In the present study, we propose an alternative approach for dealing with zero-inflated datasets in a Bayesian framework. We accounted for the variability associated with the abundance index and its impact on the variability of the Schaefer model parameters by integrating over all possible values for the series of abundance indices. This leads to the following formula for the posterior distribution of φ:
From a practical point of view, this formula implies that a sample from the posterior distribution  can be obtained in a two-step procedure, by first drawing a sample of the posterior distribution
  and deriving the abundance indices series (I), then for each abundance indices series, drawing one value according to
  . The Schaefer model was implemented in JAGS (Plummer 2008) and for each CPUE series (i.e. one output from the GLMM Bayesian sample), we used a burn-in period of 100 000 iterations and kept 100 values with a thinning of 100 to avoid auto-correlation in the posterior samples. Ideally, the correct procedure should be to keep only one value but this would be an impractical and very time-consuming process.
The Schaefer model was fitted to the total elephant fish catches for 1976–2006, and the CPUE series derived from the different data subsetting criteria, one at a time. Total catches comprise the commercial landings and discards from the shark fishery and the trawl fishery, obtained from Braccini et al. (2009), and the recreational harvest and discards. Commercial discards were assumed to be 10% of the landings (Boero Rodriguez and McLoughlin 2009). Because a proportion of discarded animals survives the capture and discarding process, commercial discards were weighted by a semiquantitative estimate of post-capture survival (J. Braccini, unpubl. data). For the recreational catch, we only used the estimates for Western Port, as the recreational catch in other bays and inlets in south-eastern Australia are considered negligible (Braccini et al. 2009). For Western Port, the only information on recreational catch of elephant fish is a point estimate for 2008 (Braccini et al. 2009). Therefore, we reconstructed the recreational catch for this bay assuming a linear increase in recreational effort starting in 1995; the year considered the starting point of the recreational fishery for elephant fish (Braccini et al. 2009).
In addition, we included an estimate of recreational discards weighted by a first rough approximation of the post capture mortality from recreational harvesting (Braccini et al. 2009). For each model, standard management reference points were computed: the maximum sustainable yield (MSY); the depletion level; the probability of the biomass in 2006 being below the stock biomass to achieve the MSY (BMSY), and the probability of the exploitation rate in 2006 being above the exploitation rate to achieve MSY (FMSY). We also estimated the Total Allowable Catch (TAC) as the product of FMSY and the 2006 biomass. Finally, to explore how uncertainty in TAC estimation is underestimated when the CPUE is assumed to be perfectly known, we compared TAC estimates obtained from the fully Bayesian approach with estimates obtained from fitting the Schaefer model to only the CPUE posterior means from the GLMM.
Results
CPUE standardisation
The data subsets used in the standardisation of CPUE varied considerably in the number of vessels, total records and positive catch records, with a percentage of positive catch records just over 20% (Table 1). Evidence of convergence of the MCMC chains was warranted by standard convergence diagnostics (e.g. Gelman–Rubin diagnostic, autocorrelation coefficient) (not shown). The different selection criteria used for subsetting the catch-and-effort dataset produced different patterns of standardised CPUE trends (Fig. 2). All CPUE series showed a declining trend but the level of decline varied depending on the selection criteria used for subsetting the catch-and-effort data, ranging from only 48% decline for D6 to almost 85% decline for D3. All CPUE series showed much broader probability intervals during the earlier years of the series, particularly for D3 and D4, than during recent years, when the estimated CPUE stabilised at lower levels. In addition, precision in the annual abundance estimation varied considerably for the different selection criteria.
|

|
Biomass dynamic model
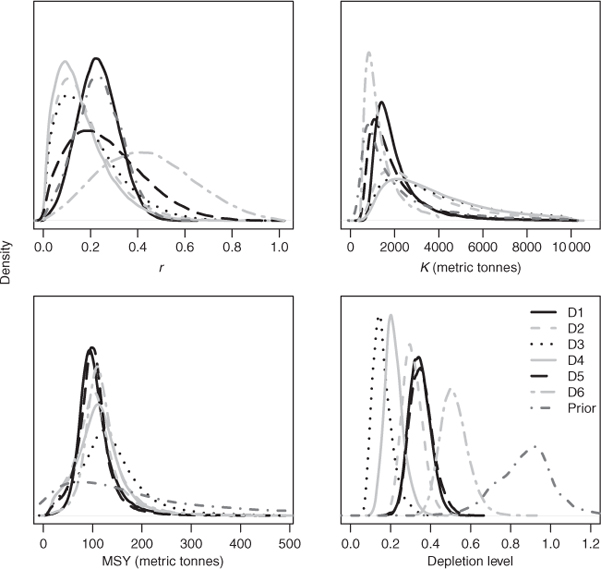
The different CPUE series produced a wide range of population dynamics parameters and management reference points (Table 2). The mean estimates of r and K ranged between 0.16 and 0.44, and 1347 and 3812 metric tonnes, respectively. Estimates of MSY were more consistent for the different CPUE series, ranging from 102 to 138 metric tonnes. There was a wide range of estimates for the stock depletion level where, depending on the CPUE series considered, the 2006 stock biomass could be as high as 52% (based on D6) to as low as 16% (based on D3) of the initial stock biomass. Finally, except for D6, there was a very high probability that in 2006 the stock biomass was lower than BMSY, and the exploitation rate was higher than FMSY.

|
The different CPUE series also produced a wide range of uncertainty in the estimation of the population parameters (Table 2, Fig. 3). For the estimation of r and K, there was considerable uncertainty when using any of the datasets (coefficient of variation (CV) >40%). The different CPUE series produced relatively more consistent estimates of management reference points with higher precision.
|
Different trends in stock biomass were obtained when the population model was fitted to the different CPUE series (Fig. 4). The estimated initial biomass and the magnitude of decline in biomass varied drastically depending on the CPUE series used. For example, the initial mean stock biomass estimated using the D4 CPUE series was almost 4000 metric tonnes and stabilised at 800 metric tonnes in recent years, whereas for D6, the initial mean stock biomass was estimated at just under 1400 metric tonnes and showed a much smaller decline over time. In addition to differences in mean stock biomass estimates, the different CPUE series produced very different patterns of uncertainty around the estimated stock biomass. For example, the D3 CPUE series produced very broad probability intervals and hence very high uncertainty, particularly for the earlier years, whereas the D6 CPUE series produced smaller probability intervals.

|
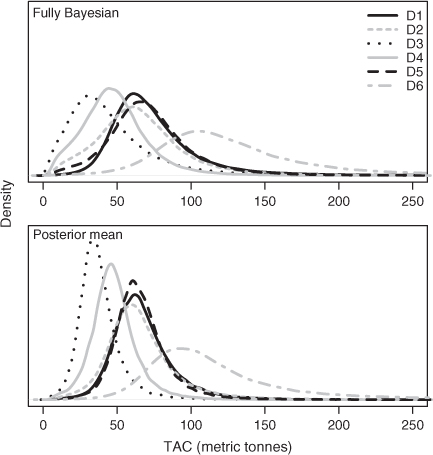
The estimates of TAC and the uncertainty around these estimates also varied considerably depending on the CPUE series used (Table 2, Fig. 5). The mean estimated TAC ranged from 46 metric tonnes per year, based on D3, to as much as 131 metric tonnes per year based on D6, which showed the largest uncertainty of all data subsets. Finally, a comparison of the fully Bayesian approach with an approach where the population dynamics model was fitted to only the CPUE posterior means showed that the fully Bayesian approach produced more uncertain TAC estimates (Fig. 5).
|
Discussion
Data subsetting
In the present study, subjectivity was explicitly incorporated through the use of expert judgement in the definition of the different ad hoc selection criteria used to subset elephant fish catch and effort. This was done with the purpose of keeping only those records considered to be ‘informative’ about the trends in the CPUE of the species. Because subjectivity relates to the mind of the thinking subject and not to the nature of the object being considered, it follows that different views of what constitutes elephant fish targeted effort may influence the outcomes of the stock assessment process. This simple fact was demonstrated in our study. Additional expert judgement and hence subjectivity had to be incorporated in the reconstruction of total commercial and recreational catches. Therefore, the stock assessment outcomes are also sensitive to the decision rules used in the reconstruction.
CPUE standardisation
The use of different data selection criteria produced different data subsets which, in turn, resulted in different trends of elephant fish standardised CPUE. Despite all CPUE series showing an overall declining trend and much larger uncertainty during the earlier years, the series showed different patterns of decline and precision (with higher precision for the data subsets with more records), and different maximum values of CPUE. If D1 is considered the baseline condition for the fishery (based on fewest record exclusions), the CPUE trends for the other data subsets provide information on how the different factors considered in the different scenarios influenced the abundance index. For example, D2 showed a higher initial abundance than D1, but it stabilised at similar levels in more recent years. Datasets 3 and 4 produced much drastic declines in CPUE than D1, whereas D5 and D6 produced less drastic declines. In addition, D3 showed the most variable CPUE estimates, suggesting that vessels from Tasmania were possibly under-reporting catch or that Tasmanian catches were higher or more variable. For school shark taken in the same fishery, Punt et al. (2000) found little impact on standardised CPUE trends when doing sensitivity tests on the thresholds given to the selection criteria used to define school shark targeted effort. These authors probably used a more restricted range of criteria (the same criteria with different threshold values, e.g. school shark median annual catch ≥5 or ≥2.5 metric tonnes), owing to the higher certainty on how to define school shark targeted effort. However, as elephant fish is not a targeted species, the uncertainty in the definition of targeted effort is higher, so a broader range of criteria was evaluated. This resulted in larger differences in the CPUE trends than for the school shark case.
The elephant fish decline in CPUE could be attributed to different factors that may be acting in combination. First, the decline in CPUE could be a result of a decline in the abundance of elephant fish. Second, the decline in CPUE could be owing to a change in fishing practices where, after an initial learning period, fishers targeting school or gummy sharks avoid elephant fish aggregations (owing to their comparatively lower value) and only take elephant fish as bycatch. Hence, a declining elephant fish catch combined with a relatively stable effort would result in a declining CPUE over time. Third, the decline in CPUE could be explained by an increase in discarding and underreporting of elephant fish catches, also a result of their comparatively lower prices. The second and third hypotheses directly relate to the violation of the assumption that CPUE is proportional to abundance even after standardising the data to remove the impact of known factors (e.g. Hilborn and Walters 1992; Punt et al. 2000; Harley et al. 2001; Aires-da-Silva et al. 2008). The second hypothesis also relates to the fact that catchability may change over time with changing fishing practices (see Maunder et al. 2006 for a review). If fishers actively avoid catching elephant fish, catchability will decrease, resulting in a hyper-depleted index of abundance (Hilborn and Walters 1992). Hence, the reliability of the elephant fish CPUE series as an index of abundance and our estimates of management reference points can be challenged owing to the assumption of CPUE being proportional to abundance and because information about the behaviour of fishers is not available and therefore not included in the standardisation.
Biomass dynamic model
Based on the assumption that the constructed CPUE series are proportional to the abundance of elephant fish in Bass Strait, the elephant fish stock is overexploited and overfishing (i.e. exploitation rate > FMSY) is occurring. There was high consistency among most CPUE series on the very high probability that in 2006 the elephant fish stock biomass was below BMSY and that the exploitation rate was above FMSY. The CPUE series produced using D6, in contrast, produced a more optimistic stock status and exploitation rate, but these estimates had the highest uncertainty owing to the comparatively lower contrast in the abundance trend compared with the other CPUE series.
Regardless of the trends in standardised CPUE reflecting the true trend in elephant fish abundance, our study shows how subjective judgement affects stock assessment outcomes when different criteria are used to subset the same catch-and-effort data. The different CPUE series produced different estimates of population dynamics parameters, predicted stock biomasses, and management reference points. This is hardly surprising; for the same fishery, this has also been reported for school shark (Punt and Walker 1998). What is more relevant from our analysis is that we made explicit the uncertainty behind the construction of a standardised index of abundance for a non-targeted chondrichthyan and demonstrated how this uncertainty produces very different management recommendations. For example, if the selection criteria used to produce D3 were the only criteria considered in the assessment, the mean estimated TAC would be 46 metric tonnes per year. In contrast, if only the criteria used to produce D6 were used in the assessment, the mean estimated TAC would be 131 metric tonnes per year; almost three times higher than when using D3. Setting TACs is one of the most widely used management methods for regulating the harvesting of chondrichthyans in Australia and elsewhere. Our study shows how sensitive the estimation of a TAC is when there is high uncertainty in the definition of the fishing effort targeted at the species being analysed. In addition, the comparison between the fully Bayesian approach with the CPUE posterior mean approach shows the importance of fully acknowledging the uncertainty in the estimation of an abundance index. As shown in Fig. 5, the uncertainty in the estimation of the TAC was larger when accounting for all sources of variability instead of considering the abundance time series as perfectly known (i.e. the CPUE posterior means). This larger variability arises from the larger tails of the fully Bayesian approach posteriors.
Subjectivity is innate to any human activity. However, to reduce the need for ad hoc decision rules in stock assessment, especially in situations when those rules are very difficult to define, more objective approaches, such as the use of specific information on fishing location or the species composition of each individual shot (Stephens and MacCall 2004), should be adopted for subsetting catch-and-effort data. The shark vessels in southern Australia carry GPSs and record the location of each of their shots in logbooks. Hence, information on the exact location of commercial shots is already being collected but, as a result of confidentiality issues, this information is made available at much broader geographical scales (60 × 60 nmi fishing cells). Combining the more precise information on shot location with the increasingly available information on seabed topography and habitat types would allow a much better definition of elephant fish targeted effort.
Conclusions
Most chondrichthyan species taken in commercial fisheries are not targeted and this increases the uncertainty in the definition of their targeted effort and stresses the importance of precautionary management for their long-term sustainability. We have shown that different views of what constituted targeted effort influenced the outcomes of elephant fish stock assessment. For other non-targeted chondrichthyans, similar outcomes can be expected. Therefore, the uncertainty in defining targeted effort should be addressed when giving management advice. For example, the different posteriors obtained from fitting the population model to each of the CPUE series could be averaged using a Bayesian model averaging approach (Leamer 1978), where predictive probability distributions from different sources are combined. Another option could be to use the different CPUE series one at a time and evaluate the performance of a range of alternatively harvest strategies. In any case, under a precautionary management scheme, the level of precaution should be proportional to the uncertainty level, leading to improved incentives for better data collection (Lenfest Ocean Program 2009).
Acknowledgements
J.M.B. thanks T. Carruthers, V. Rodriguez and A. Silva for help and comments on data analyses, and T. I. Walker for help with the development of some of the data selection criteria used. J.M.B. was funded through an Adelaide University George Murray Post-doctoral Scholarship. Finally, we are grateful to the Guest Editor, André Punt and two additional referees for useful comments and suggestions.
References
Aires-da-Silva, A. M., Hoey, J. J., and Gallucci, V. F. (2008). A historical index of abundance for the blue shark (Prionace glauca) in the western North Atlantic. Fisheries Research 92, 41–52.| A historical index of abundance for the blue shark (Prionace glauca) in the western North Atlantic.Crossref | GoogleScholarGoogle Scholar |
Boero Rodriguez, V., and McLoughlin, K. (2009). Elephant fish CPUE standardisation and Tier 4 assessment, 2009. Bureau of Rural Sciences, Canberra.
Braccini, J. M., Gillanders, B. M., and Walker, T. I. (2006). Hierarchical approach to the assessment of fishing effects on non-target chondrichthyans: case study of Squalus megalops in southeastern Australia. Canadian Journal of Fisheries and Aquatic Sciences 63, 2456–2466.
| Hierarchical approach to the assessment of fishing effects on non-target chondrichthyans: case study of Squalus megalops in southeastern Australia.Crossref | GoogleScholarGoogle Scholar |
Braccini, J. M., Walker, T. I., and Conron, S. D. (2009). Evaluation of effects of targeting breeding elephant fish by recreational fishers in Western Port. Final report to Fisheries Revenue Allocation Committee. Marine and Freshwater Fisheries Research Institute, Department of Primary Industries, Queenscliff.
Campbell, R. A. (2004). CPUE standardisation and the construction of indices of stock abundance in a spatially varying fishery using general linear models. Fisheries Research 70, 209–227.
| CPUE standardisation and the construction of indices of stock abundance in a spatially varying fishery using general linear models.Crossref | GoogleScholarGoogle Scholar |
FAO (2000). Fisheries management. 1 Conservation and management of sharks. Food and Agriculture Organization of the United Nations, Report 4 supplement 1, Rome.
Harley, S. J., Myers, R. A., and Dunn, A. (2001). Is catch-per-unit-effort proportional to abundance? Canadian Journal of Fisheries and Aquatic Sciences 58, 1760–1772.
| Is catch-per-unit-effort proportional to abundance?Crossref | GoogleScholarGoogle Scholar |
Hilborn, R., and Walters, C. J. (1992). ‘Quantitative Fisheries Stock Assessment: Choice, Dynamics and Uncertainty.’ (Chapman & Hall: New York.)
Leamer, E. E. (1978). ‘Specification Searches.’ (Wiley: New York.)
Lenfest Ocean Program (2009). An integrated approach to determining the risk of over-exploitation for data-poor pelagic Atlantic sharks. Lenfest Ocean Program, Washington. Available from http://www.lenfestocean.org/ICCAT_sharks_catch_limits09_08.pdf [Verified 16 March 2011].
Maunder, M. N. (2001). A general framework for integrating the standardization of catch per unit of effort into stock assessment models. Canadian Journal of Fisheries and Aquatic Sciences 58, 795–803.
| A general framework for integrating the standardization of catch per unit of effort into stock assessment models.Crossref | GoogleScholarGoogle Scholar |
Maunder, M. N., and Punt, A. E. (2004). Standardizing catch and effort data: a review of recent approaches. Fisheries Research 70, 141–159.
| Standardizing catch and effort data: a review of recent approaches.Crossref | GoogleScholarGoogle Scholar |
Maunder, M. N., Sibert, J. R., Fonteneau, A., Hampton, J., Kleiber, P., et al. (2006). Interpreting catch per unit effort data to assess the status of individual stocks and communities. ICES Journal of Marine Science 63, 1373–1385.
| Interpreting catch per unit effort data to assess the status of individual stocks and communities.Crossref | GoogleScholarGoogle Scholar |
McAllister, M. K., Pikitch, E. K., and Babcock, E. A. (2001). Using demographic methods to construct Bayesian priors for the intrinsic rate of increase in the Schaefer model and implications for stock rebuilding. Canadian Journal of Fisheries and Aquatic Sciences 58, 1871–1890.
| Using demographic methods to construct Bayesian priors for the intrinsic rate of increase in the Schaefer model and implications for stock rebuilding.Crossref | GoogleScholarGoogle Scholar |
Meyer, R., and Millar, R. B. (1999). BUGS in Bayesian stock assessments. Canadian Journal of Fisheries and Aquatic Sciences 56, 1078–1087.
| BUGS in Bayesian stock assessments.Crossref | GoogleScholarGoogle Scholar |
Olsen, A. M. (1959). The status of the school shark fishery in south-eastern Australian waters. Australian Journal of Marine and Freshwater Research 10, 150–176.
| The status of the school shark fishery in south-eastern Australian waters.Crossref | GoogleScholarGoogle Scholar |
Plummer, M. (2008). JAGS Version 1.0.2 manual. Lyon, France.
Punt, A. E., and Walker, T. I. (1998). Stock assessment and risk analysis for the school shark (Galeorhinus galeus) off southern Australia. Marine and Freshwater Research 49, 719–731.
| Stock assessment and risk analysis for the school shark (Galeorhinus galeus) off southern Australia.Crossref | GoogleScholarGoogle Scholar |
Punt, A. E., Walker, T. I., Taylor, B. L., and Pribac, F. (2000). Standardization of catch and effort data in a spatially-structured shark fishery. Fisheries Research 45, 129–145.
| Standardization of catch and effort data in a spatially-structured shark fishery.Crossref | GoogleScholarGoogle Scholar |
Punt, A. E., Walker, T. I., and Gason, A. S. (2004). Initial assessments of sawshark (Pristiophorus cirratus and P. nudipinnis) and elephant fish (Callorhinchus milii). In ‘Stock Assessment for South East and Southern Shark Fishery Species’. (Eds G. N. Tuck and A. D. M. Smith.) pp. 335–369. (CSIRO Marine Research: Hobart.)
Schnute, J. T., and Kronlund, A. R. (2002). Estimating salmon stock–recruitment relationships from catch and escapement data. Canadian Journal of Fisheries and Aquatic Sciences 59, 433–449.
| Estimating salmon stock–recruitment relationships from catch and escapement data.Crossref | GoogleScholarGoogle Scholar |
Shark Advisory Group, and Lack, M. (2004). National plan of action for the conservation and management of sharks (Shark Plan). Department of Agriculture, Fisheries and Forestry, Canberra.
Spiegelhalter, D., Thomas, A., Best, N., and Lunn, D. (2003). ‘WinBUGS Version 1.4 User Manual.’ (MRC Biostatistics Unit: Cambridge.)
Stephens, A., and MacCall, A. (2004). A multispecies approach to subsetting logbook data for purposes of estimating CPUE. Fisheries Research 70, 299–310.
| A multispecies approach to subsetting logbook data for purposes of estimating CPUE.Crossref | GoogleScholarGoogle Scholar |
Vignaux, M. (1994). Catch per unit effort (CPUE) analysis of west coast South Island Cook Strait spawning hoki fisheries, 1987–93. New Zealand Fisheries Association Research Document No. 94/11, Wellington, New Zealand.
Walker, T. I. (1998). Can shark resources be harvested sustainably? A question revisited with a review of shark fisheries. Marine and Freshwater Research 49, 553–572.
| Can shark resources be harvested sustainably? A question revisited with a review of shark fisheries.Crossref | GoogleScholarGoogle Scholar |
Walker, T. I., and Gason, A. S. (2009). SESSF monitoring data management, reporting and documentation 2006/07. Fisheries Research Brand, Department of Primary Industries, Final report to Australian Fisheries Management Authority Project No. R2006/812, Queenscliff.
Zhang, Z., and Holmes, J. (2009). Generalized linear Bayesian models for standardization of CPUE with incorporation of spatial–temporal variations. Western and Central Pacific Fisheries Commission, Vanuatu.