

Geographic distribution pattern of low and high nucleic acid content bacteria on a river-catchment scale
Jie Liu A B , Dan Ma A , Lili Ma A C , Yuhao Song A , Guanghai Gao A and Yingying Wang A DA Key Laboratory of Pollution Processes and Environmental Criteria (Ministry of Education), Tianjin Key Laboratory of Environmental Remediation and Pollution Control, College of Environmental Science and Engineering, Nankai University, Tianjin 300071, China.
B Graduate School at Shenzhen, Tsinghua University, Shenzhen 518055, China.
C College of Chemistry and Chemical Engineering, Southwest Petroleum University, Chengdu 610500, China.
D Corresponding author. Email: wangyy@nankai.edu.cn
Marine and Freshwater Research 68(9) 1618-1625 https://doi.org/10.1071/MF16068
Submitted: 9 March 2016 Accepted: 15 November 2016 Published: 3 February 2017
Journal Compilation © CSIRO Publishing 2017 Open Access CC BY-NC-ND
Abstract
Bacteria with low nucleic acid content (LNA) and high nucleic acid content (HNA) are widely distributed in aquatic environments. Most of the current understanding of these two subgroups is derived from studies in marine environments. In comparison, information on the spatial distribution of these two subgroups in freshwater environments is very limited. The present study analysed the biogeographical pattern of those two groups on a large-river scale (i.e. the Songhua River catchment, >1000 km). The results showed that the concentrations of LNA and HNA bacteria were distributed over a wide range from 5.45 × 10⁴ to 4.43 × 10⁶ cells mL–1, and from 1.35 × 10⁵ to 4.37 × 10⁶ cells mL–1 respectively. The two groups have almost equal proportions in the Songhua River, with the average contribution of LNA bacteria reaching 47.0%. In comparison, the abundance of LNA bacteria in the mainstream was significantly higher than in the tributaries. The cytometric expressions (green fluorescence and side scatter) within LNA and HNA were strongly covaried, which implies that these two subgroups are intrinsically linked. Multivariate redundancy analysis indicated that both the abundance and cytometric characteristics of co-occurring LNA and HNA bacteria were regulated differently in the Songhua River. This suggests that LNA and HNA bacteria play different ecological roles in river ecosystems.
Additional keywords: biogeography, cytometric characteristics, flow cytometry (FCM), multivariate redundancy analysis.
Introduction
Flow cytometry (FCM), which is based on fluorescent nucleic acid-staining technologies and is independent of microbial cultivability, has been rapidly applied in the field of aquatic microbiology (Wang et al. 2010; Koch et al. 2014). At least two major groups of bacteria, namely those with low and those with high nucleic acid content, can be distinctively characterised by FCM after staining with DNA-binding dyes (Bouvier et al. 2007; Wang et al. 2009). They were originally classified as ‘Group I cells’ and ‘Group II cells’ (Li et al. 1995), then as ‘low nucleic acid-content (LNA) bacteria’ and ‘high nucleic acid-content (HNA) bacteria’ (Lebaron et al. 2001). This classification was based on the different fluorescence intensity and side scatter signal of the cells as detected by FCM, where fluorescence intensity was regarded as an indicator of intracellular nucleic acid content (genome size and the number of genome copies) and side scatter as an index of cellular morphological characteristics (size, internal granulosity and cytoskeletal proteins; Bouvier et al. 2007). Although this classification is method-specific for FCM, it has been widely applied in different research fields (Bouvier et al. 2007; Van Wambeke et al. 2011; Huete-Stauffer and Morán 2012).
The question of whether LNA bacteria are active or inactive microbes has been controversial for a long time. HNA bacteria were commonly considered to be the active part of the microbial metabolic groups because of their high nucleic acid content and large bio-volumes, whereas LNA bacteria were regarded as inactive (Lebaron et al. 2001). When first observed in FCM, LNA bacteria were considered to be inactivated or dead cells and HNA bacteria were proposed to be an indicator of active bacteria (Lebaron et al. 2001). However, further studies have shown that LNA bacteria not only possess activities similar to HNA bacteria (Wang et al. 2009), but also play an important role in various ecosystems (Gozdereliler et al. 2013). Multiple novel physiological strategies, for example, simplified metabolism, high affinity and binding protein-dependent uptake system and special cellular membrane constitution, enable LNA bacteria to respond quickly to various stresses, such as low substrate concentrations (Salcher et al. 2011), oxidising agents (Ramseier et al. 2011) and viral infection (Bouvier and Maurice 2011). LNA bacteria can even adopt a dormancy strategy to overcome unfavourable environmental conditions (Rösel and Grossart 2012). All of these observations indicate that the adaptability and competition of LNA bacteria should be higher than that of HNA bacteria, such that they become the predominant community in aquatic environments.
Previous studies of LNA and HNA bacteria have mainly focused on their distribution and dynamics in marine environments (Andrade et al. 2007; Huete-Stauffer and Morán 2012; Grob et al. 2013; García et al. 2014). It was reported that coastal seas had a lower proportion of LNA bacteria, such as on a transect from Delaware to the Sargasso Sea (35%), or the Grand Banks (22–42%) (Li et al. 1995; Li and Dickie 2001). In contrast, there was a higher proportion of LNA bacteria found in the coastal Canet lagoon (57%; Servais et al. 2003), eastern Mediterranean Sea (65%), North Atlantic (64%; Li et al. 1995) and the Gulf of Mexico (62%; Jochem et al. 2004). In comparison, only a few reports are available on LNA and HNA bacteria in freshwater environments (Ni et al. 2015; Read et al. 2015). For example, Joux and colleagues investigated the percentages of LNA and HNA bacteria and the effect of salinity and chlorophyll-a on those two groups along the Rhone River (France) (Joux et al. 2005). Wang and colleagues isolated three typical pure cultures of LNA that were closely affiliated to Polynucleobacter from freshwater environments in Switzerland (Wang et al. 2009). To the best of our knowledge, field data on the spatial distribution patterns of LNA and HNA fractions are very scarce in freshwater environments (Ni et al. 2015; Read et al. 2015), and there is no information concerning the changes in cytometric characteristics of LNA and HNA bacteria on a large river-catchment scale. In the current study, we profiled the relationship between the cytometric characteristics of LNA and HNA bacteria, illustrated the biogeographical patterns (i.e. main river v. tributaries and geographic distance) of their abundance on a river-catchment scale (over 1000 km), and evaluated the variation of the properties of these two subgroups by the multivariate ordination method.
Materials and methods
Sampling site
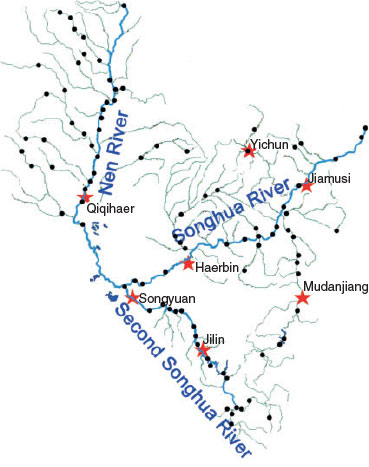
The Songhua River is located at a joint section of the temperate zone and the cold-temperature zone in north-eastern Asia (41°42 to ~51°38′N, 119°52 to ~132°31′E). It is the third-largest river in China, and drains 557 000 km2 of land. The Songhua River derives from the Great Khingan and Baekdu Mountains and merges into the Amur River (the national boundary between China and Russia). Water samples from the river were taken over the period from June to August in 2010. Sampling sites were set every 40 km along the river and were orientated using a global positioning system (GPS; Fig. 1). In total, 98 water samples were collected. Samples were collected in clean and sterilised glass bottles and stored at 4°C during transportation and processed immediately within 24 h after sampling.
|
Flow-cytometric measurements
Flow-cytometric measurements were performed as described previously (Ma et al. 2013). Each water sample (1 mL) was stained with 10 μL mL–1 SYBR Green I (1 : 100 dilution in dimethyl sulfoxide as the working solution; Invitrogen, Eugene, OR, USA), and incubated in the dark for 15 min at room temperature before measurement. Flow cytometry was performed using a CyFlow Space instrument (Partec, Hamburg, Germany) equipped with a 50-mW argon ion laser, emitting at a fixed wavelength of 488 nm. Green fluorescence (FL1) was collected at 520 ± 20 nm. Cell population was gated on the two-parameter dot-plot of FL1 and side scatter (SSC). LNA and HNA bacteria were counted separately. The geometrical means of FL1 and SSC of the LNA and HNA subgroups were calculated. All samples were measured in triplicate. To avoid excessive cell aggregation, samples were diluted in cell-free water so that the concentration measured by FCM was always lower than 2 × 10⁵ cells mL–1. The detection limit was below 500 cells s–1, with an average standard deviation of 5%.
Heterotrophic plate counts (HPCs)
The cultivation medium was composed of peptone (10 g L–1), beef extract (3 g L–1), NaCl (5 g L–1) and agar (20 g L–1), with a pH between 7.4 and 7.6. The medium was sterilised at 121°C for 20 min. A water sample of 100 μL was transferred to a plate with 15 mL of sterilised medium. The samples were incubated at 37°C for 48 h before the colonies were counted. All measurements were performed in triplicate, and three blanks were set as the control.
Water physicochemical properties
Water physicochemical properties (i.e. temperature, pH, conductivity, dissolved oxygen) were measured on site during the sampling process. Chlorophyll-a was determined using the traditional spectrophotometer method with extracting pigment by 90% acetone (Lorenzen 1967).
Statistical analysis
ANOVA analysis was used to assess the significance of differences in measured and calculated parameters. The ANOVA analysis was performed in R software (ver. 3.1.3, R Foundation for Statistical Computing, Vienna, Austria) using the package ‘Vegan’. A multivariate redundancy analysis (RDA) was performed using Canoco software (Canoco for Windows ver. 4.5, Microcomputer Power, Ithaca, NY, USA) to illustrate the changes in the abundance and cytometric characteristics of LNA and HNA bacteria in response to geographic distance and environmental factors (Liu et al. 2015). The bacterial cytometric parameters and abundance data were centred and standardised before RDA, and the Monte Carlo test was used to examine the significance of the RDA analysis. At the same time, a generalised linear model (GLM) and generalised additive model (GAM) were applied in a stepwise manner to predict the abundance and flow cytometric characteristic (FL1 and SSC) of LNA and HNA bacteria in response to environmental ordination axes in RDA. The axes were constrained by environmental variables, and the visualisation formula were constructed in terms of linear, quadratic or cubic degrees of GLM. F-statistics were employed to test the significance in GLM.
Results and discussion
The cytometric characteristics of LNA and HNA bacteria
The separation of aquatic microbes into LNA and HNA groups has been widely reported in marine environments. However, information on freshwater environments is very limited. In the current study, the distribution of LNA and HNA bacteria in a freshwater river catchment was evaluated on a large spatial scale (>1000 km). Flow cytometric analysis showed that the microbial communities were separated into at least two groups (LNA and HNA bacteria), which were observed in all water samples collected from the Songhua River. Neither group was associated with a fixed geometrical mean value of FL1 intensity or SSC in different samples (Fig. 2). Their cytometric characteristics changed greatly, both within a given ecosystem and along various environmental gradients, which revealed that the bimodal distribution was a general feature in bacterioplankton communities. The results showed that there was a positive and highly significant correlation between the cytometric characteristics (FL1 and SSC) of the LNA and HNA subgroups (FL1: Spearman’s r2 = 0.795, P < 0.001; SSC: Spearman’s r2 = 0.551, P < 0.001; Fig. 3a), whereas the FL1 and SSC were weakly correlated within each groups (LNA: Spearman’s r2 = 0.334, P < 0.01; HNA: Spearman’s r2 = 0.313, P < 0.01; Fig. 3b). In addition, because LNA and HNA were clearly distinguishable from cytometric parameters (FL1 and SSC), the derived variables FL1HNA : FL1LNA and SSCHNA : SSCLNA were used to represent the degree of the relative distances between LNA and HNA in FCM (Bouvier et al. 2007). The results showed that the relative distance of FL1 between these two subgroups was significantly higher than that of SSC (Fig. 4, ANOVA, F = 51.0, P < 0.0001). These results demonstrated that the cytometric parameters within LNA and HNA bacteria were not independent from each other and tended to covary within a given specific ecosystem, which supports the hypothesis that LNA and HNA are possibly dynamic and intrinsically linked in aquatic microbial communities (Bouvier et al. 2007).

|

|
|
Geographic patterns in abundance of LNA and HNA subgroups
The concentrations of LNA and HNA bacteria ranged from 5.45 × 10⁴ to 4.43 × 10⁶ cells mL–1, and 1.35 × 10⁵ to 4.37 × 10⁶ cells mL–1 respectively (Fig. 5a). The two groups are present in an almost equal proportion in the Songhua River catchment (average contribution of LNA cells reached 47%; Fig. 5b). The fact that LNA bacteria persist with high abundance within the river ecosystem suggests that LNA bacteria have a high viability in the microbial loop. It has been shown that heterotrophic nanoflagellates and other planktonic predators seem to prefer grazing on and selectively cropping the larger-sized and more active fraction of bacterioplankton (Corzo et al. 2005; Nishimura et al. 2005). Tadonleke and co-workers reported that Cyclidium glaucoma selectively grazed on HNA communities rather than on LNA (Tadonléké et al. 2005). Nishimura and colleagues also found that the grazing mortality of HNA bacteria was 2.8-fold higher than that of LNA bacteria in Lake Biwa (Nishimura et al. 2005). However, another study showed that LNA sometimes experienced higher grazing-loss rates than did HNA (Jochem et al. 2004). Differences in size-dependent grazing pressure and viral attack may enable LNA bacteria to dominate the community and play an important evolutionary and ecological role similar to that of the HNA in the microbial webs of the ecosystem (Morán et al. 2015).

|
Both LNA and HNA bacteria exhibited a clear geographical distribution pattern in the Songhua River. First, the concentration of LNA bacteria in the mainstream was significantly higher than that in the tributaries (Fig. 5a, ANOVA, F = 16.4, P < 0.001). In contrast, there was no significant difference between the concentrations of HNA bacteria in the mainstream and in the tributaries (Fig. 5, ANOVA, F = 2.2, P = 0.14). Second, the concentrations of both LNA and HNA bacteria decreased with an increasing altitude (LNA Spearman’s r = –0.311, P = 0.001; HNA Spearman’s r = –0.197, P = 0.069) and latitude (LNA Spearman’s r = –0.317, P = 0.001; HNA Spearman’s r = –0.291, P = 0.003), whereas the concentration of HNA bacteria was positively correlated with longitude (Fig. S1, available as Supplementary material for this paper).
Furthermore, the results also suggested that the distribution pattern of bacterial abundance tends to be temperature related (LNA: Spearman’s r = 0.372, P = 0.001; HNA: Spearman’s r = 0.271, P = 0.006). It was reported that warm-adapted bacteria could have lower minimal P cell quotas than do cold-adapted bacteria (Hall et al. 2008), which would confer an advantage to cells with low nucleic acid content (because nucleic acids are an important intracellular source of P) in warm-temperature and resource-limited environments (Van Wambeke et al. 2011). The change of temperature, coupled with regional-scale latitudinal gradients or sometimes local weather contingencies, will affect microbial activity, metabolism and growth rate, and hence the abundance of LNA and HNA. This result is consistent with that of a previous study in which Huete-Stauffer and Morán found that the net growth rates of LNA bacteria were strongly correlated with temperature in the southern Bay of Biscay coastal waters (Huete-Stauffer and Morán 2012). Additionally, the concentration of LNA bacteria also displayed an altitudinal dependence in the present study. The elevation of altitude would cause a temperature decrease, changes in hydrologic flow and stability, and the river biotope, which would lead to variation of organic substances and inorganic nutrients, thereby influencing the biotic activities in the river. It should be noted that the altitude range (less than 1000 m) in the present study was limited. Therefore, further studies covering larger ranges are needed for a better understanding of the altitudinal effect on the distribution of LNA and HNA bacteria.
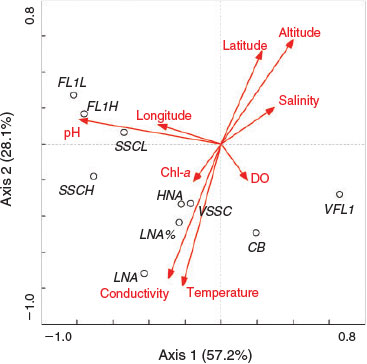
Factors influencing the variation in LNA and HNA
Redundancy analysis (RDA) was used to explain the variance of LNA and HNA bacteria. A Monte Carlo test showed that the cytometric characteristics and the abundance of two subgroups were significantly correlated with the extrinsic factors (F = 13.3, P = 0.002). Axis 1 and Axis 2 explained 57.2 and 28.1% of the variation of bacterial properties respectively, and the RDA showed that pH was the main factor driving the variation of LNA and HNA (Fig. 6). Because it accounts for the major variance of the subgroup properties, Axis 1 was selected to represent the explanatory variables, and used to compare the differentiation between LNA and HNA and changes in cytometric characteristics to drive factors in GLM. The results showed that the response of the abundance of LNA and HNA bacteria to changes in environmental variables differ greatly in the Songhua River (Fig. 7a). Both the variability of SSC and FL1 in HNA were more sensitive to the explanatory axis than those in LNA (Fig. 7b). The study presented here showed that, although cytometric characteristics (FL1 and SSC) of LNA and HNA bacteria tend to covary within an ecosystem, the abundance of LNA and HNA bacteria changes greatly and differently along environmental gradients, as well as the green fluorescence (FL1) and side scatter (SSC), which implies that LNA and HNA may be regulated differently.
|

|
The total microbial abundance is commonly regarded as a variable to track the productivity index of the ecosystem, such as chlorophyll-a stocks or bacterial production. In the present study, the concentration of LNA bacteria was positively correlated with the chlorophyll-a concentration, which is similar to the results of previous reports (Bouvier et al. 2007; Van Wambeke et al. 2011). Our results further showed that the correlation of chlorophyll-a with LNA bacteria was more significant than that with HNA (LNA: Spearman’s r = 0.222, P = 0.03; HNA: Spearman’s r = 0.076, P = 0.47), which suggests that LNA bacteria would be more responsive than HNA bacteria to high phytoplankton stocks in freshwater environments. In contrast, a different correlation between LNA bacteria and chlorophyll-a was observed in marine environments. For instance, Huete-Stauffer and Morán found a strong negative correlation between the net growth rates of LNA bacteria and chlorophyll-a in temperate coastal waters (Huete-Stauffer and Morán 2012). Corzo and co-workers reported that both FL1 and SSC of HNA were positively correlated with chlorophyll-a, but no similar correlation was observed for the LNA fraction in Antarctic waters in the Austral summer (Corzo et al. 2005). These might be the results of different compositions and ecological roles of LNA and HNA in aquatic environments. In addition to the physicochemical properties studied here, dissolved organic matter may also play an important role in regulating the distribution of LNA and HNA bacteria. The strong correlation between community dynamics, LNA : HNA ratio and dissolved organic matter quality and quantity has been observed in marine ecosystems (Belzile et al. 2008; Kaartokallio et al. 2016). Hence, further study on the correlation between dissolved organic matter and distribution of LNA and HNA bacteria in freshwater ecosystems is needed.
The present study focused on the geographic distribution of LNA and HNA bacteria. One major aspect that was not covered here is the temporal shifts in LNA and HNA bacteria. It has been demonstrated that seasonal changes have important influence over microbial community dynamics in marine environments (Belzile et al. 2008; Gilbert et al. 2012). Our previous study also showed that the temporal changes had stronger effects on the patterns of LNA and HNA than that of nutrient conditions in an exorheic river (Liu et al. 2016). The sampling period (i.e. June–August) in the present study was chosen because of the relative stability of the whole river catchment during this time. However, rivers are highly dynamic systems and information of the bacterial changes over time would offer important insights into the distribution of LNA and HNA bacteria in river catchments. Finally, the river catchment studied in the present study is still spatially limited; data from various rivers and streams would lead to a better understanding of the geographic distribution and dynamics of LNA and HNA bacteria in freshwater environments.
Conclusions
In summary, our study investigated the geographical distribution of LNA and HNA bacteria over a large river-catchment scale. The existence of LNA and HNA counterparts varied widely over the whole river catchment, and the LNA bacterial abundance was significantly higher in the mainstream than in the tributaries. The strong covariation of cytometric expressions between LNA and HNA bacteria indicated that these two subgroups are intrinsically linked components in aquatic bacterial communities. The multivariate analysis further revealed that the abundance and cytometric characteristics of these two co-occurring subgroups are regulated differently, which implies that LNA and HNA bacteria play different ecological roles in river ecosystems.
1 These authors made an equal contribution.
Acknowledgements
This work was supported by the National Key Basic Research Program of China (2015CB459000), Innovation Research Team Program, Ministry of Education China (IRT 13024), and National Science Foundation of China (31322012). We thank Prof. Mark Bartlam for his critical reading of the manuscript.
References
Andrade, L., Gonzalez, A. M., Rezende, C. E., Suzuki, M., Valentin, J. L., and Paranhos, R. (2007). Distribution of HNA and LNA bacterial groups in the southwest Atlantic Ocean. Brazilian Journal of Microbiology 38, 330–336.| Distribution of HNA and LNA bacterial groups in the southwest Atlantic Ocean.Crossref | GoogleScholarGoogle Scholar |
Belzile, C., Brugel, S., Nozais, C., Gratton, Y., and Demers, S. (2008). Variations of the abundance and nucleic acid content of heterotrophic bacteria in Beauford Shelf waters during winter and spring. Journal of Marine Systems 74, 946–956.
| Variations of the abundance and nucleic acid content of heterotrophic bacteria in Beauford Shelf waters during winter and spring.Crossref | GoogleScholarGoogle Scholar |
Bouvier, T., and Maurice, C. F. (2011). A single-cell analysis of virioplankton adsorption, infection, and intracellular abundance in different bacterioplankton physiologic categories. Microbial Ecology 62, 669–678.
| A single-cell analysis of virioplankton adsorption, infection, and intracellular abundance in different bacterioplankton physiologic categories.Crossref | GoogleScholarGoogle Scholar |
Bouvier, T., del Giorgio, P. A., and Gasol, J. M. (2007). A comparative study of the cytometric characteristics of high and low nucleic-acid bacterioplankton cells from different aquatic ecosystems. Environmental Microbiology 9, 2050–2066.
| A comparative study of the cytometric characteristics of high and low nucleic-acid bacterioplankton cells from different aquatic ecosystems.Crossref | GoogleScholarGoogle Scholar | 1:CAS:528:DC%2BD2sXhtVeiu73J&md5=be1db7d9da5d329ad5b4813559127e66CAS |
Corzo, A., Rodriguez-Galvez, S., Lubian, L., Sobrino, C., Sangra, P., and Martinez, A. (2005). Antarctic marine bacterioplankton subpopulations discriminated by their apparent content of nucleic acids differ in their response to ecological factors. Polar Biology 29, 27–39.
| Antarctic marine bacterioplankton subpopulations discriminated by their apparent content of nucleic acids differ in their response to ecological factors.Crossref | GoogleScholarGoogle Scholar |
García, F. C., Lopez-Urrutia, A., and Morán, X. A. G. (2014). Automated clustering of heterotrophic bacterioplankton in flow cytometry data. Aquatic Microbial Ecology 72, 175–185.
| Automated clustering of heterotrophic bacterioplankton in flow cytometry data.Crossref | GoogleScholarGoogle Scholar |
Gilbert, J. A., Steele, J. A., Caporaso, J. G., Steinbrück, L., Reeder, J., Temperton, B., Huse, S., McHardy, A. C., Knight, R., Joint, I., Somerfield, P., Fuhrman, J. A., and Field, D. (2012). Defining seasonal marine microbial community dynamics. The ISME Journal 6, 298–308.
| Defining seasonal marine microbial community dynamics.Crossref | GoogleScholarGoogle Scholar | 1:CAS:528:DC%2BC38XhtVCgur8%3D&md5=ee0733ec32ce148283ac28d38df95f6aCAS |
Gozdereliler, E., Boon, N., Aamand, J., De Roy, K., Granitsiotis, M. S., Albrechtsen, H.-J., and Sorensen, S. R. (2013). Comparing metabolic functionalities, community structures, and dynamics of herbicide-degrading communities cultivated with different substrate concentrations. Applied and Environmental Microbiology 79, 367–375.
| Comparing metabolic functionalities, community structures, and dynamics of herbicide-degrading communities cultivated with different substrate concentrations.Crossref | GoogleScholarGoogle Scholar | 1:CAS:528:DC%2BC3sXkvVKjtrs%3D&md5=9bfb9e1469c241baa6783e10bb974b32CAS |
Grob, C., Ostrowski, M., Holland, R. J., Heldal, M., Norland, S., Erichsen, E. S., Blindauer, C., Martin, A. P., Zubkov, M. V., and Scanlan, D. J. (2013). Elemental composition of natural populations of key microbial groups in Atlantic waters. Environmental Microbiology 15, 3054–3064.
| 1:CAS:528:DC%2BC3sXhs12ls7jM&md5=c6697c99b1b775f10f906c211101c6f0CAS |
Hall, E. K., Neuhauser, C., and Cotner, J. B. (2008). Toward a mechanistic understanding of how natural bacterial communities respond to changes in temperature in aquatic ecosystems. The ISME Journal 2, 471–481.
| Toward a mechanistic understanding of how natural bacterial communities respond to changes in temperature in aquatic ecosystems.Crossref | GoogleScholarGoogle Scholar | 1:CAS:528:DC%2BD1cXntFCrsbs%3D&md5=797f0d58d2b9527591dbce825b7775cfCAS |
Huete-Stauffer, T. M., and Morán, X. A. G. (2012). Dynamics of heterotrophic bacteria in temperate coastal waters: similar net growth but different controls in low and high nucleic acid cells. Aquatic Microbial Ecology 67, 211–223.
| Dynamics of heterotrophic bacteria in temperate coastal waters: similar net growth but different controls in low and high nucleic acid cells.Crossref | GoogleScholarGoogle Scholar |
Jochem, F. J., Lavrentyev, P. J., and First, M. R. (2004). Growth and grazing rates of bacteria groups with different apparent DNA content in the Gulf of Mexico. Marine Biology 145, 1213–1225.
| Growth and grazing rates of bacteria groups with different apparent DNA content in the Gulf of Mexico.Crossref | GoogleScholarGoogle Scholar |
Joux, F., Servais, P., Naudin, J. J., Lebaron, P., Oriol, L., and Courties, C. (2005). Distribution of picophytoplankton and bacterioplankton along a river plume gradient in the Mediterranean Sea. Life and Environment 55, 197–208.
Kaartokallio, H., Asmala, E., Autio, R., and Thomas, D. N. (2016). Bacterial production, abundance and cell properties in boreal estuaries: relation to dissolved organic matter quantity and quality. Aquatic Sciences 78, 525–540.
| Bacterial production, abundance and cell properties in boreal estuaries: relation to dissolved organic matter quantity and quality.Crossref | GoogleScholarGoogle Scholar | 1:CAS:528:DC%2BC2MXhvFertLfF&md5=096cf85d95f90aac3351e70a93e95276CAS |
Koch, C., Harms, H., and Muller, S. (2014). Dynamics in the microbial cytome: single cell analytics in natural systems. Current Opinion in Biotechnology 27, 134–141.
| Dynamics in the microbial cytome: single cell analytics in natural systems.Crossref | GoogleScholarGoogle Scholar | 1:CAS:528:DC%2BC2cXovVKjurw%3D&md5=5063c62b2cb4a9e9d4b11adf75a0035fCAS |
Lebaron, P., Servais, P., Agogué, H., Courties, C., and Joux, F. (2001). Does the high nucleic acid content of individual bacterial cells allow us to discriminate between active cells and inactive cells in aquatic systems? Applied and Environmental Microbiology 67, 1775–1782.
| Does the high nucleic acid content of individual bacterial cells allow us to discriminate between active cells and inactive cells in aquatic systems?Crossref | GoogleScholarGoogle Scholar | 1:CAS:528:DC%2BD3MXis1egtLo%3D&md5=fabc5aea77460416fdc44fdb7fd790e2CAS |
Li, W. K. W., and Dickie, P. M. (2001). Monitoring phytoplankton, bacterioplankton, and virioplankton in a coastal inlet (Bedford Basin) by flow cytometry. Cytometry 44, 236–246.
| Monitoring phytoplankton, bacterioplankton, and virioplankton in a coastal inlet (Bedford Basin) by flow cytometry.Crossref | GoogleScholarGoogle Scholar | 1:CAS:528:DC%2BD3MXlsVyrtL0%3D&md5=f674d08b845e523cc983011bd80e7adcCAS |
Li, W., Jellett, J., and Dickie, P. (1995). DNA distributions in planktonic bacteria stained with TOTO or TO-PRO. Limnology and Oceanography 40, 1485–1495.
| DNA distributions in planktonic bacteria stained with TOTO or TO-PRO.Crossref | GoogleScholarGoogle Scholar | 1:CAS:528:DyaK28XpvVOluw%3D%3D&md5=eb8d53e3d1e0917519480bc2b083b1d3CAS |
Liu, J., Wang, J., Gao, G., Bartlam, M. G., and Wang, Y. (2015). Distribution and diversity of fungi in freshwater sediments on a river catchment scale. Frontiers in Microbiology 6, 329.
| Distribution and diversity of fungi in freshwater sediments on a river catchment scale.Crossref | GoogleScholarGoogle Scholar | 1:CAS:528:DC%2BC2MXhvFKltbrK&md5=85420ff45f24b1f346f3750251b9ef30CAS |
Liu, J., Hao, Z., Ma, L., Ji, Y., Bartlam, M. G., and Wang, Y. (2016). Spatio-temporal variations of high and low nucleic acid content bacteria in an exorheic river. PLoS One 11, e0153678.
| Spatio-temporal variations of high and low nucleic acid content bacteria in an exorheic river.Crossref | GoogleScholarGoogle Scholar |
Lorenzen, C. J. (1967). Determination of chlorophyll and pheopigments: spectrophotometric equations. Limnology and Oceanography 12, 343–346.
| Determination of chlorophyll and pheopigments: spectrophotometric equations.Crossref | GoogleScholarGoogle Scholar | 1:CAS:528:DyaF1cXovFOqsQ%3D%3D&md5=2c0cf6bf6dbc43bfadbfaf5beb67aa16CAS |
Ma, L. L., Mao, G. N., Liu, J., Yu, H., Gao, G. H., and Wang, Y. Y. (2013). Rapid quantification of bacteria and viruses in influent, settled water, activated sludge and effluent from a wastewater treatment plant using flow cytometry. Water Science and Technology 68, 1763–1769.
| Rapid quantification of bacteria and viruses in influent, settled water, activated sludge and effluent from a wastewater treatment plant using flow cytometry.Crossref | GoogleScholarGoogle Scholar | 1:CAS:528:DC%2BC2cXisVWku70%3D&md5=19e312ad4643c3a3168f8d6d4bfa02a2CAS |
Morán, X. A. G., Alonso-Sáez, L., Nogueira, E., Ducklow, H. W., González, N., López-Urrutia, A., Díaz-Pérez, L., Calvo-Díaz, A., Arandia-Gorostidi, N., and Huete-Stauffer, T. M. (2015). More, smaller bacteria in response to ocean’s warming? Proceedings of the Royal Society of London – B. Biological Sciences 282, 369–374.
| More, smaller bacteria in response to ocean’s warming?Crossref | GoogleScholarGoogle Scholar |
Ni, Z. X., Huang, X. P., and Zhang, X. (2015). Picoplankton and virioplankton abundance and community structure in Pearl River Estuary and Daya Bay, South China. Journal of Environmental Sciences 32, 146–154.
| Picoplankton and virioplankton abundance and community structure in Pearl River Estuary and Daya Bay, South China.Crossref | GoogleScholarGoogle Scholar |
Nishimura, Y., Kim, C., and Nagata, T. (2005). Vertical and seasonal variations of bacterioplankton subgroups with different nucleic acid contents: possible regulation by phosphorus. Applied and Environmental Microbiology 71, 5828–5836.
| Vertical and seasonal variations of bacterioplankton subgroups with different nucleic acid contents: possible regulation by phosphorus.Crossref | GoogleScholarGoogle Scholar | 1:CAS:528:DC%2BD2MXhtFajtbrM&md5=db59b218cfd452b957579c06e8b496f7CAS |
Ramseier, M. K., von Gunten, U., Freihofer, P., and Hammes, F. (2011). Kinetics of membrane damage to high (HNA) and low (LNA) nucleic acid bacterial clusters in drinking water by ozone, chlorine, chlorine dioxide, monochloramine, ferrate(VI), and permanganate. Water Research 45, 1490–1500.
| Kinetics of membrane damage to high (HNA) and low (LNA) nucleic acid bacterial clusters in drinking water by ozone, chlorine, chlorine dioxide, monochloramine, ferrate(VI), and permanganate.Crossref | GoogleScholarGoogle Scholar | 1:CAS:528:DC%2BC3MXjtVGh&md5=2f0ab66e7d3167a81f368e5a36e01ca5CAS |
Read, D. S., Gweon, H. S., Bowes, M. J., Newbold, L. K., Field, D., Bailey, M. J., and Griffiths, R. I. (2015). Catchment-scale biogeography of riverine bacterioplankton. The ISME Journal 9, 516–526.
| Catchment-scale biogeography of riverine bacterioplankton.Crossref | GoogleScholarGoogle Scholar | 1:CAS:528:DC%2BC2MXhsVahs7g%3D&md5=5466dbd31164909ab531b4b4fe4eeb21CAS |
Rösel, S., and Grossart, H.-P. (2012). Contrasting dynamics in activity and community composition of free-living and particle-associated bacteria in spring. Aquatic Microbial Ecology 66, 169–181.
| Contrasting dynamics in activity and community composition of free-living and particle-associated bacteria in spring.Crossref | GoogleScholarGoogle Scholar |
Salcher, M. M., Pernthaler, J., and Posch, T. (2011). Seasonal bloom dynamics and ecophysiology of the freshwater sister clade of SAR11 bacteria ‘that rule the waves’ (LD12). The ISME Journal 5, 1242–1252.
| Seasonal bloom dynamics and ecophysiology of the freshwater sister clade of SAR11 bacteria ‘that rule the waves’ (LD12).Crossref | GoogleScholarGoogle Scholar | 1:CAS:528:DC%2BC3MXptVyntbg%3D&md5=9c15258033ca0e211356b9db6eff92f8CAS |
Servais, P., Casamayor, E. O., Courties, C., Catala, P., Parthuisot, N., and Lebaron, P. (2003). Activity and diversity of bacterial cells with high and low nucleic acid content. Aquatic Microbial Ecology 33, 41–51.
| Activity and diversity of bacterial cells with high and low nucleic acid content.Crossref | GoogleScholarGoogle Scholar |
Tadonléké, R. D., Planas, D., and Lucotte, A. (2005). Microbial food webs in boreal humic lakes and reservoirs: ciliates as a major factor related to the dynamics of the most active bacteria. Microbial Ecology 49, 325–341.
| Microbial food webs in boreal humic lakes and reservoirs: ciliates as a major factor related to the dynamics of the most active bacteria.Crossref | GoogleScholarGoogle Scholar |
Van Wambeke, F., Catala, P., Pujo-Pay, M., and Lebaron, P. (2011). Vertical and longitudinal gradients in HNA–LNA cell abundances and cytometric characteristics in the Mediterranean Sea. Biogeosciences 8, 1853–1863.
| Vertical and longitudinal gradients in HNA–LNA cell abundances and cytometric characteristics in the Mediterranean Sea.Crossref | GoogleScholarGoogle Scholar | 1:CAS:528:DC%2BC3MXhtlansL%2FK&md5=16d4ca8f8118a3f96d387719e80eead0CAS |
Wang, Y. Y., Hammes, F., Boon, N., Chami, M., and Egli, T. (2009). Isolation and characterization of low nucleic acid (LNA)-content bacteria. The ISME Journal 3, 889–902.
| Isolation and characterization of low nucleic acid (LNA)-content bacteria.Crossref | GoogleScholarGoogle Scholar | 1:CAS:528:DC%2BD1MXovFOgur8%3D&md5=384b767339d61ab392dcfdb1787d4854CAS |
Wang, Y. Y., Hammes, F., De Roy, K., Verstraete, W., and Boon, N. (2010). Past, present and future applications of flow cytometry in aquatic microbiology. Trends in Biotechnology 28, 416–424.
| Past, present and future applications of flow cytometry in aquatic microbiology.Crossref | GoogleScholarGoogle Scholar | 1:CAS:528:DC%2BC3cXptVagsrc%3D&md5=9326872e877d9da7a5b125cd2e528da9CAS |