

Temporal and spatial variability of breeding in Australian birds and the potential implications of climate change
Heather M. Gibbs A C D , Lynda E. Chambers B and Andrew F. Bennett AA School of Life and Environmental Sciences, Deakin University, 221 Burwood Highway, Burwood, VIC 3125, Australia.
B Centre for Australian Weather and Climate Research, Bureau of Meteorology, GPO Box 1289, Melbourne, VIC 3001, Australia.
C Present address: PO Box 2110, Lygon Street North, East Brunswick, VIC 3057, Australia.
D Corresponding author. Email: hgi@deakin.edu.au
Emu 111(4) 283-291 https://doi.org/10.1071/MU10083
Submitted: 2 August 2010 Accepted: 5 April 2011 Published: 16 September 2011
Abstract
Climate change has profound implications for biodiversity worldwide. To understand its effects on Australia’s avifauna, we need to evaluate the effects of annual climatic variability and geographical climate gradients. Here, we use national datasets to examine variation in breeding of 16 species of common and widespread Australian landbirds, in relation to four variables: altitude, latitude, year and the Southern Oscillation Index. Analysis of >30 years of nesting records confirmed that breeding was generally later in colder altitudes and latitudes (geographic variation), but was not consistently related to year or the Southern Oscillation Index (temporal variation). However, power to detect expected temporal effects was low. The timing of breeding became significantly earlier with year only in south-eastern Australia. In contrast, an index of breeding activity (the proportion of atlas records for a species for which breeding was reported) increased with increasing winter values of the Southern Oscillation Index (generally wetter conditions) for all 16 species across Australia. This suggests that annual fluctuations in rainfall can have dramatic and immediate effects on breeding, even for largely sedentary, seasonally breeding species. If, as expected, climate change creates drier conditions over much of Australia, we predict a marked negative effect on bird breeding.
Additional keywords: avian ecology, breeding participation, ENSO, temperature.
Introduction
Globally, temperatures have warmed over recent decades, affecting both human and natural systems, including the ranges and phenology of species (Parmesan and Yohe 2003). However, most information is from the northern hemisphere, with few studies from the south (Rosenzweig et al. 2008). The two hemispheres represent different ecological and climatic systems, which both need to be better understood for a truly global understanding of the effects of climate change. In Australia, and the southern hemisphere generally, long-term biological datasets are rather rare (Hughes 2003). However, for birds, which are good indicators of environmental change (Furness and Greenwood 1993), both long-term (>30 year) and continent-wide datasets are available for Australia (Chambers et al. 2005; Dunn and Weston 2008). This provides a valuable opportunity to study the effects of climate change in an austral climatic region. Bird breeding is especially responsive to climate as it reflects productivity at lower trophic levels (Nix 1976; Dunn 2004).
Climate projections for Australia indicate continued widespread warming along with varying, and often uncertain, changes to rainfall patterns. Most of Australia can expect reduced soil moisture in the future. Fires, heatwaves, floods and drought are expected to increase in frequency, whereas frosts and snow will become less common (IPCC 2007; Pearce et al. 2007). However, to document the biological effects of climate change across an entire continent, it is important to first account for the potential effects of annual climatic variability and geographical gradients in temperature (Dunn and Winkler 1999).
Climatic variation affects the timing of breeding in birds. In Australia, as elsewhere, birds breed later at higher altitudes (Frith 1984) and at higher (i.e. closer to the poles) latitudes (Baker 1939). This is commensurate with temperature decreases of ~0.7°C for each 100 m of elevation (Galloway 1988) and ~0.8°C per degree of latitude southwards observed in New South Wales (NSW) (Bureau of Meteorology, unpubl. data). Warming temperatures over time, owing to anthropogenic climate change (IPCC 2007), have led to earlier breeding in many bird species in the northern hemisphere (Parmesan and Yohe 2003). However, despite Australia warming by 0.7°C over the last century (Pittock 2003), similar to the global average (IPCC 2007), it is unclear whether earlier breeding is widespread in Australian birds (Norment and Green 2004; Chambers et al. 2005, 2008; Rosenzweig et al. 2008). The Southern Oscillation Index (SOI) may also be associated with the timing of breeding in birds, either through temperature or rainfall effects. Earlier breeding in the Australian Magpie (Cracticus tibicen) in NSW was correlated with increasing SOI (Gibbs 2007), consistent with SOI-related increases in minimum temperatures in winter. However, the potential effects of the SOI on the timing of breeding at a broader scale remain unclear, as SOI–temperature correlations are diurnally, seasonally and spatially variable (Jones and Trewin 2000).
Although the timing of breeding is an important and well-studied phenomenon (Dunn 2004), other aspects of breeding may also be influenced by climate. In particular, breeding participation, individual reproductive effort, breeding success and breeding density are likely to be affected. There is evidence that breeding participation varies markedly between years in a variety of species and habitats (Pitelka et al. 1955; McKelvey et al. 1993; Browne et al. 2005; Wright et al. 2009), yet possible effects of climate change on breeding participation have received little attention (Carey 2009). Bird atlassing data can provide an index of the relative amount of breeding activity, as they include records of both breeding and non-breeding birds. One such index was strongly related to both SOI and latitude in the Australian Magpie in NSW (Gibbs 2007).
Despite much variation in life-history and behaviour, all birds have similar basic requirements for survival (e.g. food, water, shelter and warmth) and thus we can expect some general relationships between breeding and climatic patterns. For this analysis, we chose 16 common and widespread species of Australian landbirds and related their breeding data to four climatic variables that allowed simple, meaningful and consistent analyses at a continental scale. These climatic variables primarily represent spatial gradients in temperature (i.e. altitude and latitude), the recent warming trend (year), and rainfall variability (the SOI). Unlike seasonal or annual averages of temperature and rainfall, these variables are logically independent, they separate long-term (geographical) variations from short-term (temporal) variations in climate, and are fairly simple to obtain and interpret.
We predicted for these common terrestrial species that:
-
the timing of breeding will become later with increasing altitude and with latitude southwards, and become earlier over time as a result of the warming trend;
-
generally there will be more breeding activity when the SOI is higher (i.e. in wetter years);
-
the strength of these relationships will differ between species and regions, with stronger trends towards earlier breeding in cold regions and stronger relationships with SOI in drier regions.
We test these predictions by using a multivariate analysis of breeding data for the 16 species of landbirds at a continental scale, followed by more detailed regional analyses.
Methods
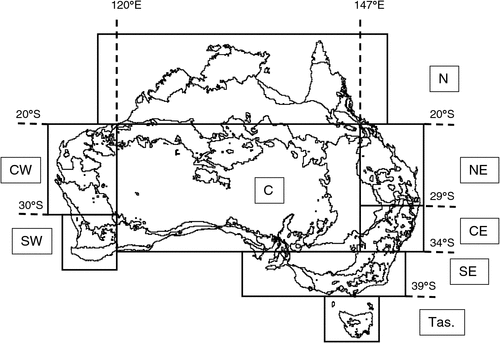
For this systematic analysis of 16 species of common Australian birds (Table 1), we refined analytical techniques developed during previous studies of the relationship between climate and breeding for the Australian Magpie (Gibbs 2007) and Masked Lapwing (Vanellus miles) (Chambers et al. 2008). The 16 species were selected primarily on the basis of the availability of data, while excluding species (such as waterbirds) that require specialised analysis (Chambers and Loyn 2006). Seven geographical regions in Australia, defined by biogeographical properties and availability of data (Fig. 1), were used to assess regional variation. Evidence of breeding is defined here as a nest containing eggs, young or a brooding bird, or a nest to which birds repeatedly deliver food, or a newly-fledged dependent young near a nest.

|
|
For each species, we obtained continent-wide data on breeding from databases developed and maintained by Birds Australia (Melbourne): Atlas 1 – the first Atlas of Australian Birds, conducted 1977–81 (Blakers et al. 1984); Atlas 2 – the second and continuing Atlas of Australian Birds, 1998–2007 (Barrett et al. 2003; Dunn and Weston 2008); and the Nest Record Scheme (NRS), which began in 1963. For a subset of eight species, data were obtained for NSW from the NSW Atlassers Inc. (NSW Atlas). These four datasets covered the breeding years (May–April) of 1977–1983 (6 years; Atlas 1; including some data collected outside of the formal Atlas period by the Arthur Rylah Institute in Victoria); 1998–2007 (9 years; Atlas 2), 1963–99 (35 years; Nest Record Scheme) and 1977–99 (22 years; NSW Atlas).
Avian atlases record the distribution of bird species and whether breeding was observed. The NRS records more detail of each breeding event but, unlike atlassing data, has no independent measure of survey effort. Hence, the NRS and atlassing data provide complementary information on breeding. The three atlases have some differences in the survey data: Atlas 2 has more short surveys (2 ha, 20 min), whereas in the Atlas 1 and NSW Atlas, surveys of 10′ grid-blocks over many days, or even weeks, are more typical. The strengths and limitations of each dataset were considered carefully before analysis (e.g. in setting the minimum number of records required).
All of the bird data considered in this paper were collected by volunteers (Weston et al. 2006), and are subject to various biases, including seasonal variation in survey effort, geographical clumping of records, variation in observer behaviour between individuals and over time, and a bias towards surveying good birding spots. Such biases may differ between datasets. However, there is no reason to suspect that any such biases systematically affected results in relation to the variables of interest.
Response variables
Timing of breeding
The NRS data provide the most precise and interpretable estimate of the timing of breeding: an estimate of hatching date based on the mid-point between the last record of eggs and the first record of nestlings or, where this was not available, the last record of eggs (Griffioen 2001). This method retains most of the data, yet improves temporal specificity over, for example, mean reporting date. Days were numbered consecutively from 1 (1 January) to 365 (31 December), with both 29 February and 1 March numbered 60; 365 was then added to all days <120. The latter was done to account for breeding extending across calendar years and represents a ‘breeding year’ starting on 30 April, a date when little breeding activity occurred in all 16 species. In general, breeding seasons were discrete (late breeding from one year did not overlap with early breeding in another), but breeding dates varied greatly. Few data could be identified as known first clutches, so data from all breeding attempts were included. Even so, breeding dates showed only occasional bimodality (e.g. in some species in some years in south-western Australia).
An index of breeding activity
The relative amount of breeding activity (Br-index) was defined for a species as:
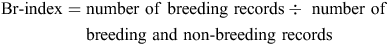
It was based on atlas records only, as it could not be calculated for the NRS data, which did not contain non-breeding records. Br-index is a useful measure because it largely separates changes in breeding activity from seasonal changes in population size or survey effort. Its suitability was confirmed in various ways, for example, plotting Br-index by month across the year reflected expected seasonal patterns in breeding activity (Gibbs 2007).
When calculating Br-index, all data for the breeding year (May to April) were included, as this produced a similar result to using monthly or seasonal data, but could be applied consistently across species regardless of the length or timing of their breeding season. Splitting the data into regions, despite the large size of the regions, resulted in small sample sizes for some species and regions. Consequently, for regional analyses, we included only those species × region combinations for which data from every year, or all but one year, had >500 non-breeding records or >10 breeding records.
Variables representing climatic patterns
Altitude
Altitude was estimated for each survey location by using the nearest grid-point in the GEODATA 9 Second Digital Elevation Model (DEM) Version 2 (Geoscience Australia, Canberra). Where the grid-point fell over sea, but near land, an altitude of sea level was assumed. The accuracy of altitude estimates varies with steepness of terrain and accuracy of geocoding of survey locations, but the DEM grid-scale (9″) implies that estimated altitudes are provided by the DEM for a point within a 150-m horizontal radius of any given location.
Latitude
Latitude is stored in each dataset in decimal format. NRS data are specified to the nearest minute of latitude and longitude, but for Atlas 1 many surveys spanned 10′ grids and some covered even larger areas. For Atlas 2, most surveys were of small areas (e.g. 2 ha) and accurately geocoded, but some surveys covered larger areas (rarely, up to 5-km radius). There was no reason to suspect systematic biases in observations owing to survey type, with respect to the explanatory variables, so all survey types were included.
Year
Trend over time was represented by the breeding year, beginning 30 April. For example, the year from May 1990 to April 1991 was represented as ‘1990’.
Southern Oscillation Index (SOI)
Monthly SOI values were obtained from the Australian Bureau of Meteorology (http://www.bom.gov.au/climate/current/soihtm1.shtml, accessed 7 September 2011). A ‘winter’ SOI value (SOI-W) for each year was derived by averaging the SOI values for June, July and August. These months represent conditions before, and during, the initiation of breeding.
Statistical analyses
We performed linear regression modelling of the timing of breeding and logistic modelling of Br-index, using the generalised linear models procedure in PASW Statistics Version 18 (formerly SPSS, SPSS Inc., Chicago, IL). Each response variable was modelled in relation to four continuous explanatory variables (altitude, latitude, year and SOI) in a single main-effects model. Each of the 16 bird species was modelled individually. We also modelled all 16 species together, using a mixed model in which species was included as a categorical random factor.
For logistic modelling of Br-index in relation to the explanatory variables, the data were treated as a binary variable: that is, each observation was represented as either a breeding record (=1) or a non-breeding record (=0).
In addition, we performed regional analyses to examine further two particular relationships: the relationship between timing of breeding and year, and that between Br-index and SOI. For the former, to identify temporal trends in the timing of breeding by region, we first accounted for the effects of altitude and latitude by taking the residuals from a continent-wide regression of the timing of breeding against altitude and latitude. We then regressed the residuals against year for each region. To examine the relationship between Br-index and SOI by region, we combined data from Atlas 1 and Atlas 2, including ‘Atlas’ as a random factor to account for differences in survey methodology. We performed a logistic regression for each region.
Many statistical tests were performed and so some significant results may have occurred owing to chance alone (Rice 1989; Moran 2003). There are good reasons not to make any formal corrections for this (Moran 2003), but the P values should be interpreted in this context. The underlying data were not sampled randomly and therefore the results document a ‘population’ of similar possible surveys, rather than, for example, populations of all breeding birds in Australia. These limitations were unavoidable.
Results
Timing of breeding
Across the 16 species, the timing of breeding tended to be later at higher altitudes and at more southerly latitudes, but was not consistently related to either SOI or year (Table 2). Altitude was significant for 10 species, which bred later by 1.5–5.8 days per 100 m increase in altitude. Latitude was significant for 12 species, of which 11 bred later further south (range 4.7 days later to 1.3 days earlier per degree southwards). Trends over time (year) were significant for three species only (two later, one earlier) and SOI-W was significant for two species: one positive, one negative (Table 2). Across all 16 species, breeding became earlier by 0.05 days per year but this was not statistically significant (P = 0.3).

|
Timing of breeding – temporal trends within regions
Of 60 combinations of species × region investigated, only 16 showed significant trends in the timing of breeding with year (Table 3). Nine were of earlier breeding and seven of later breeding (Table 3). For the South-eastern (SE) region, where over half of all nest records originated, there were five significant relationships, all for earlier breeding (0.4–1.2 days per year), with a significant trend across all 16 species of 0.2 days per year earlier (Table 3). The Central Eastern region (CE) also had substantial data, but showed no significant trend overall (two earlier and one later out of 13 species). In the South-western (SW) region, all four significant results were for later breeding (Table 3). This latter result may not be representative because most NRS data for the SW region are from one study near Manjimup (34°19′S, 116°09′E) (Chambers 2008) which differs in climatic characteristics from other parts of the SW region (Majer and Koch 1982).

|
Relative amount of breeding activity (Br-index)
Of the three atlas datasets, Atlas 2 had the most comprehensive ‘geographical’ data on Br-index (9 years of continent-wide data) whereas the NSW Atlas had the best ‘temporal’ data (22 years continuous data). We performed logistic regression modelling of breeding activity against altitude, latitude, year and SOI-W independently for each dataset: Atlas 2 (Table 4), NSW Atlas, and Atlas 1 (Accessory publication Tables A1 and A2 respectively, see http://www.publish.csiro.au/?act=view_file&file_id=MU10083_AC.pdf).

|
For Atlas 2 data, breeding activity for most species was greater at higher altitudes, at more southerly latitudes and in years of positive SOI-W (Table 4). For the NSW Atlas, it was generally greater at higher altitudes, at more northerly latitudes, in earlier years and in years of positive SOI-W (Table A1). For Atlas 1 data, the ‘effect’ of latitude varied markedly between species (Table A2). Taken together these results suggest that the ‘effect’ of latitude was not consistent over time and space. Individually, data from Atlas 1 and 2 were of too short duration to separate effectively year and SOI, or to thoroughly examine trends over time (Atlas 1 and 2 contained only 6 and 9 years of data respectively). Despite these issues, in all datasets breeding activity was significantly positively associated with SOI-W (Tables 4, A1, A2). Calculating just the effect of SOI-W (from the multivariate model of Atlas 2 data, holding all other variables at their mean value) breeding activity values were 3.3 times greater at the highest SOI-W value recorded during the study period compared with that at the lowest SOI-W value.
Relative amount of breeding activity – effect of SOI-W by region
To check for regional variation in the relationship between breeding activity and SOI-W, we analysed SOI-W alone. This is because the effects of latitude, altitude and year on Br-index were not consistent (either across species or between datasets), in contrast with SOI-W. To maximise the number of years of continent-wide data, Atlas 1 and 2 data were combined and ‘Atlas’ was included as a random factor in logistic regression to account for differences in survey methods.
This mixed model indicated that the relationship between Br-index and SOI-W was remarkably consistent in direction across all regions: it was positive in all 62 species × region combinations for which there were ≥5000 records, and significantly so for 40 of them (Table 5). However, effect sizes varied between regions (range 1.7–4.0; Table 5). A cross-check using yearly proportions (i.e. a linear, rather than a logistic, mixed model) gave similar results.

|
Discussion
We used national datasets to examine variation in breeding of 16 species of common and widespread Australian landbirds in relation to altitude, latitude, year and SOI. As predicted, the timing of breeding became later with increasing altitude and latitude southward, but there was not a significant relationship with year or SOI-W. The only trend towards earlier breeding over time (year) occurred in the relatively cooler SE region. Consistent with predictions, there was greater breeding activity when the SOI-W was higher (i.e. in wetter years).
Timing of breeding
At a continental scale, the trend for later breeding at higher altitudes and further south (i.e. towards the pole) is consistent with previous studies (Baker 1939; Marchant 1974; Ojanen et al. 1979; Marchant and Fullagar 1983; Meijer et al. 1999; Both and Marvelde 2007). These results in relation to geographical gradients in temperature suggest that future warming will influence the timing of breeding in Australian birds. However, the timing of breeding was not consistently related to year or SOI-W (Table 2). The high variability that characterises the Australian climatic system (Steffen et al. 2009) makes it difficult to detect small trends. Nonetheless, because clear responses to climate warming have been reported internationally (Crick et al. 1997; Crick and Sparks 1999; Dunn and Winkler 1999), it could be that Australian birds have responded less strongly. This may be because winter temperatures over much of Australia are not particularly cold (relative to the northern hemisphere), because conditions are drier, or because recent climate warming in Australia is weaker than in the places where strong biotic responses have been reported (IPCC 2007).
Timing of breeding – temporal trends within regions
Temporal trends in the timing of breeding at a regional level were uncommon and limitations of the data were strongly evident. In the SE region, which had by far the most data (8542 records), breeding became significantly earlier (0.23 days per year) across the 16 species, concurrent with a significant increase in winter minimum temperatures (0.24°C per decade). The CE region also had much data (2675 records) but no overall trend towards earlier breeding was evident. The trend towards later breeding in the SW region was unexpected. However, in this and the remaining regions a large proportion of the available data were by single observers over limited time-spans (see Table A3). Thus, data from these regions might be better analysed from a more local perspective, but this was beyond the scope of this study.
Timing of breeding and the adequacy of data
If one assumes a temperature decrease of ~0.7°C per 100 m of elevation (Galloway 1988) and ~0.8°C per degree of latitude southwards, as recorded for NSW (Bureau of Meteorology, unpubl. data), then breeding became 3.0 and 2.1 days earlier per degree of temperature change across the altitudinal and latitudinal gradients respectively. If these values are applied to temperature changes over time in each region (see Table A3), an effect size of only 0.2–1.1 days earlier per decade might be expected. This effect is too small to detect using current data. However, significant trends in the timing of breeding in the SE region ranged from 3.6 to 11.6 days earlier per decade, suggesting that responses to temporal climate warming may be stronger than responses to geographical temperature gradients would suggest. Thus, it is important to have sufficient data to examine temporal trends directly. A baseline target for the NRS might be 20 records per year per species per region. This would give ~90% power to detect a 5-day per decade change in the timing of breeding over 30 years, given reasonably seasonal breeding (e.g. Willie Wagtail (Rhipidura leucophrys) in the SE region), or 10% power given less predictable breeding (e.g. Crested Pigeon (Ocyphaps lophotes) in the Central region).
Atlas data can also be used to document changes in the timing of breeding, but to avoid confounding changes in breeding success with changes in the timing of breeding, the stage of breeding observed (eggs, nestlings or fledglings) must be recorded. This would be a simple and cost-effective way to generate better (and more) data on the timing of breeding in Australian birds. This need not compromise other uses of bird atlassing data (Dunn and Weston 2008).
Breeding activity
In line with our predictions, higher values of SOI-W (wetter years: Table A4) were associated with increases in breeding activity (Br-index). This occurred for all species, in all three Atlas datasets, and in all regions, despite the wide variety of rainfall patterns these regions represent. This implies that changes in climate (especially rainfall) have immediate and substantial effects on bird breeding. Br-index was related also to altitude and latitude but not as consistently.
The responsiveness of Br-index to inter-annual climate variability suggests breeding in Australian birds is ‘opportunistic’ even in reasonably sedentary, seasonally breeding species. This may be owing to the strong influence of the El Niño–Southern Oscillation on Australian climate: the negative phases are associated with droughts, even in temperate regions, and associated biological ‘boom and bust’ responses (Heinsohn 2009). Indeed, ‘opportunistic seasonal breeding’ (Channing 1988) may be widespread in Australian birds.
Implications
Breeding responses in 16 common, widespread species of Australian landbirds reflected both long- and short-term climatic patterns. Timing of breeding was strongly related to geographical gradients in temperature (altitude and latitude). In contrast, the relative amount of breeding activity was most consistently related to the SOI, presumably because of associated changes in rainfall and thus primary productivity. This suggests that anthropogenic climate change, which influences both temperature and rainfall patterns (IPCC 2007), may have substantial, rapid and ongoing effects on breeding in Australian birds. In particular, the drier conditions predicted for much of Australia are likely to have a largely negative effect on the breeding activity of many species.
Acknowledgments
Many thanks to the Stuart Leslie Bird Research Fund and Norman Wettenhall Foundation for financial support; to Professor Robert Staudte for advice on statistical methods and Professor Marcel Klaassen for comments; and to the Bureau of Meteorology, Birds Australia and the New South Wales Bird Atlassers Inc. for their valuable data. We warmly acknowledge the many volunteers who contributed to these important datasets, which made the study possible. We thank the reviewers for constructive comments.
References
Baker, J. B. (1939). The breeding seasons of birds, with special reference to the need for further data from Australia. Emu 39, 33–38.| The breeding seasons of birds, with special reference to the need for further data from Australia.Crossref | GoogleScholarGoogle Scholar |
Barrett, G., Silcocks, A., Barry, S., Cunningham, R., and Poulter, R. (2003). ‘The New Atlas of Australian Birds.’ (Birds Australia: Melbourne.)
Blakers, M., Davies, S. J. J. F., and Reilly, P. N. (1984). ‘The Atlas of Australian Birds.’ (Melbourne University Press: Melbourne.)
Both, C., and Marvelde, L. T. (2007). Climate change and timing of avian breeding and migration throughout Europe. Climate Research 35, 93–105.
| Climate change and timing of avian breeding and migration throughout Europe.Crossref | GoogleScholarGoogle Scholar |
Browne, S. J., Aebischer, N. J., and Crick, H. P. (2005). Breeding ecology of Turtle Doves Streptopelia turtur in Britain during the period 1941–2000: an analysis of BTO nest record cards. Bird Study 52, 1–9.
| Breeding ecology of Turtle Doves Streptopelia turtur in Britain during the period 1941–2000: an analysis of BTO nest record cards.Crossref | GoogleScholarGoogle Scholar |
Carey, C. (2009). The impacts of climate change on the annual cycles of birds. Philosophical Transactions of the Royal Society. Series B. Biological Sciences 364, 3321–3330.
| The impacts of climate change on the annual cycles of birds.Crossref | GoogleScholarGoogle Scholar |
Chambers, L. E. (2008). Trends in timing of migration of south-western Australian birds and their relationship to climate. Emu 108, 1–14.
| Trends in timing of migration of south-western Australian birds and their relationship to climate.Crossref | GoogleScholarGoogle Scholar |
Chambers, L. E., and Loyn, R. H. (2006). The influence of climate variability on numbers of three waterbird species in Western Port, Victoria, 1973–2002. International Journal of Biometeorology 50, 292–304.
| The influence of climate variability on numbers of three waterbird species in Western Port, Victoria, 1973–2002.Crossref | GoogleScholarGoogle Scholar |
Chambers, L. E., Hughes, L., and Weston, M. A. (2005). Climate change and its impact on Australia’s avifauna. Emu 105, 1–20.
| Climate change and its impact on Australia’s avifauna.Crossref | GoogleScholarGoogle Scholar |
Chambers, L. E., Gibbs, H., Weston, M. A., and Ehmke, G. C. (2008). Spatial and temporal variation in the breeding of Masked Lapwings (Vanellus miles) in Australia. Emu 108, 115–124.
| Spatial and temporal variation in the breeding of Masked Lapwings (Vanellus miles) in Australia.Crossref | GoogleScholarGoogle Scholar |
Channing, A. (1988). Opportunistic seasonal breeding by frogs in Namaqualand. Journal of the Herpetological Association of Africa 35, 19–24.
Christidis, L., and Boles, W. E. (2008). ‘Systematics and Taxonomy of Australian Birds.’ (CSIRO Publishing: Melbourne.)
Crick, H. Q. P., and Sparks, T. H. (1999). Climate change related to egg-laying trends. Nature 399, 423–424.
| Climate change related to egg-laying trends.Crossref | GoogleScholarGoogle Scholar | 1:CAS:528:DyaK1MXjvVyqsrs%3D&md5=35436f38d44f8c7106b84803f154c758CAS |
Crick, H. Q. P., Dudley, C., Glue, D. E., and Thomson, D. L. (1997). UK birds are laying eggs earlier. Nature 388, 526.
| UK birds are laying eggs earlier.Crossref | GoogleScholarGoogle Scholar | 1:CAS:528:DyaK2sXlt1arsbs%3D&md5=a827b15d2cf8ed4ee3c8d00823c2dda4CAS |
Dunn, P. (2004). Breeding dates and reproductive performance. Advances in Ecological Research 35, 69–87.
| Breeding dates and reproductive performance.Crossref | GoogleScholarGoogle Scholar |
Dunn, A. M., and Weston, M. A. (2008). A review of terrestrial bird atlases of the world and their application. Emu 108, 42–67.
| A review of terrestrial bird atlases of the world and their application.Crossref | GoogleScholarGoogle Scholar |
Dunn, P. O., and Winkler, D. W. (1999). Climate change has affected the breeding date of Tree Swallows throughout North America. Proceedings of the Royal Society of London. Series B. Biological Sciences 266, 2487–2490.
| Climate change has affected the breeding date of Tree Swallows throughout North America.Crossref | GoogleScholarGoogle Scholar |
Frith, H. J. (1984). ‘Birds in the Australian High Country.’ (Angus and Robertson: Sydney.)
Furness, R. W., and Greenwood, J. J. D. (1993). ‘Birds as Monitors of Environmental Change.’ (Chapman and Hall: London.)
Galloway, R. W. (1988). The potential impact of climate change on Australian ski-fields. In ‘Greenhouse: Planning for Climate Change’. (Ed. G.I. Pearman) pp. 428–437. (CSIRO Publishing: Melbourne.)
Gibbs, H. (2007). Climatic variation and breeding in the Australian Magpie (Gymnorhina tibicen): a case study using existing data. Emu 107, 284–293.
| Climatic variation and breeding in the Australian Magpie (Gymnorhina tibicen): a case study using existing data.Crossref | GoogleScholarGoogle Scholar |
Griffioen, P. (2001). Temporal changes in the distribution of bird species in eastern Australia. Ph.D. Thesis, La Trobe University, Bundoora, Victoria.
Heinsohn, R. (2009). White-winged Choughs: the social consequences of boom and bust. In ‘Boom and Bust: Bird Stories for a Dry Country’. (Eds L. Robin, R. Heinsohn and L. Joseph.) pp. 223–239. (CSIRO Publishing: Melbourne.)
Higgins, P. J. (Ed.) (1999). ‘Handbook of Australian, New Zealand and Antarctic Birds. Volume 4: Parrots to Dollarbird.’ (Oxford University Press: Melbourne.)
Higgins, P. J., and Davies, S. J. J. F. (Eds) (1996). ‘Handbook of Australian, New Zealand and Antarctic Birds. Vol. 3: Snipe to Pigeons.’ (Oxford University Press: Melbourne.)
Higgins, P. J., and Peter, J. M. (Eds) (2002). ‘Handbook of Australian, New Zealand and Antarctic Birds. Vol. 6: Pardalotes to Shrike-thrushes.’ (Oxford University Press: Melbourne.)
Higgins, P. J., Peter, J. M., and Steele, W. K. (Eds) (2001). ‘Handbook of Australian, New Zealand and Antarctic Birds. Vol. 5: Tyrant-flycatchers to Chats.’ (Oxford University Press: Melbourne.)
Higgins, P. J., Peter, J. M., and Cowling, S. J. (Eds) (2006). ‘Handbook of Australian, New Zealand and Antarctic Birds. Vol. 7: Boatbill to Starlings.’ (Oxford University Press: Melbourne.)
Hughes, L. (2003). Climate change and Australia: trends, projections and impacts. Austral Ecology 28, 423–443.
| Climate change and Australia: trends, projections and impacts.Crossref | GoogleScholarGoogle Scholar |
IPCC (2007). ‘Climate Change 2007: The Physical Science Basis. Contribution of Working Group I to the Fourth Assessment Report of the Intergovernmental Panel on Climate Change.’ (Eds S. Solomon, D. Qin, M. Manning, Z. Chen, M. Marquis, K. B. Averyt, M. Tignor and H. L. Miller.) (Cambridge University Press: Cambridge, UK, and New York.)
Jones, D. A., and Trewin, B. C. (2000). On the relationships between the El Niño–Southern Oscillation and Australian land surface temperature. International Journal of Climatology 20, 697–719.
| On the relationships between the El Niño–Southern Oscillation and Australian land surface temperature.Crossref | GoogleScholarGoogle Scholar |
Majer, J., and Koch, L. (1982). Seasonal activity of hexapods in woodland and forest leaf litter in the south-west of Western Australia. Journal of the Royal Society of Western Australia 65, 37–45.
Marchant, S. (1974). Analysis of nest-records of the Willie Wagtail. Emu 74, 149–160.
| Analysis of nest-records of the Willie Wagtail.Crossref | GoogleScholarGoogle Scholar |
Marchant, S., and Fullagar, P. J. (1983). Nest records of the Welcome Swallow. Emu 83, 66–74.
| Nest records of the Welcome Swallow.Crossref | GoogleScholarGoogle Scholar |
McKelvey, K., Noon, B. R., and Lamberson, R. H. (1993). Conservation planning for species occupying fragmented landscapes: the case of the Northern Spotted Owl. In ‘Biotic Interactions and Global Change’. (Eds P. M. Kareiva, J. G. Kingsolver and R. B. Huey.) pp. 424–450. (Sinauer Assoc. Inc.: Sunderland, MA.)
Meijer, T., Nienaber, U., Langer, U., and Trillmich, F. (1999). Temperature and timing of egg-laying of European Starlings. Condor 101, 124–132.
| Temperature and timing of egg-laying of European Starlings.Crossref | GoogleScholarGoogle Scholar |
Moran, M. D. (2003). Arguments for rejecting the sequential Bonferroni in ecological studies. Oikos 100, 403–405.
| Arguments for rejecting the sequential Bonferroni in ecological studies.Crossref | GoogleScholarGoogle Scholar |
Nix, H. A. (1976). Environmental control of breeding, post-breeding dispersal and migration of birds in the Australian region. In ‘Proceedings of the XVI International Ornithological Conference’, 12-17 August 1974, Canberra. (Eds H. J. Frith and J. H. Calaby) pp. 272–305. (Australian Academy of Sciences: Canberra.)
Norment, C. J., and Green, K. (2004). Breeding ecology of Richard’s Pipit (Anthus novaeseelandiae) in the Snowy Mountains, Australia. Emu 104, 327–336.
| Breeding ecology of Richard’s Pipit (Anthus novaeseelandiae) in the Snowy Mountains, Australia.Crossref | GoogleScholarGoogle Scholar |
Ojanen, M., Orell, M., and Hirvelä, J. (1979). The breeding biology of the Starling Sturnus vulgaris in northern Finland. Ecography 2, 81–87.
| The breeding biology of the Starling Sturnus vulgaris in northern Finland.Crossref | GoogleScholarGoogle Scholar |
Parmesan, C., and Yohe, G. (2003). A globally coherent fingerprint of climate change impacts across natural systems. Nature 421, 37–42.
| A globally coherent fingerprint of climate change impacts across natural systems.Crossref | GoogleScholarGoogle Scholar | 1:CAS:528:DC%2BD3sXoslM%3D&md5=fa5749c9d12c198be61211bf9aea6151CAS |
Pearce, K., Holper, P., Hopkins, M., Bouma, W., Whetton, P., Hennessy, K., and Power, S. (Eds) (2007). ‘Climate Change in Australia.’ (CSIRO Publishing: Melbourne.)
Pitelka, F. A., Tomich, P. Q., and Treichel, G. W. (1955). Ecological relations of jaegers and owls as lemming predators near Barrow, Alaska. Ecological Monographs 25, 85–117.
| Ecological relations of jaegers and owls as lemming predators near Barrow, Alaska.Crossref | GoogleScholarGoogle Scholar |
Pittock, B. (2003). ‘Climate Change: An Australian Guide to the Science and Potential Impacts.’ (Australian Greenhouse Office: Canberra.)
Rice, W. R. (1989). Analyzing tables of statistical tests. Evolution 43, 223–225.
| Analyzing tables of statistical tests.Crossref | GoogleScholarGoogle Scholar |
Rosenzweig, C., Karoly, D., Vicarelli, M., Neofotis, P., Wu, Q., Casassa, G., Menzel, A., Root, T. L., Estrella, N., Seguin, B., Tryjanowski, P., Liu, C., Rawlins, S., and Imeson, A. (2008). Attributing physical and biological impacts to anthropogenic climate change. Nature 453, 353–357.
| Attributing physical and biological impacts to anthropogenic climate change.Crossref | GoogleScholarGoogle Scholar | 1:CAS:528:DC%2BD1cXlvV2qtLc%3D&md5=a6d93ee99876575465fa76a80bb1c2a4CAS |
Steffen, W., Burbidge, A. A., Hughes, L., Kitching, R., Lindenmayer, D., Musgrave, W., Smith, M. S., and Werner, P. A. (2009). ‘Australia’s Biodiversity and Climate Change.’ (CSIRO Publishing: Melbourne.)
Weston, M., Silcocks, A., Tzaros, C., and Ingwersen, D. (2006). A survey of contributors to an Australian bird atlassing project: demography, skills and motivation. Australian Journal on Volunteering 11, 51–58.
Wright, L. J., Hoblyn, R. A., Green, R. E., Bowden, C. G. R., Mallord, J. W., Sutherland, W. J., and Dolman, P. M. (2009). Importance of climatic and environmental change in the demography of a multi-brooded passerine, the Woodlark Lullula arborea. Journal of Animal Ecology 78, 1191–1202.
| Importance of climatic and environmental change in the demography of a multi-brooded passerine, the Woodlark Lullula arborea.Crossref | GoogleScholarGoogle Scholar |