Consistency of denominator data in electronic health records in Australian primary healthcare services: enhancing data quality
Ross Bailie A B , Jodie Bailie A , Amal Chakraborty A and Kevin Swift AA Centre for Primary Health Care Systems, Menzies School of Health Research, Charles Darwin University, PO Box 10639, Adelaide Street, Brisbane, Qld 4000, Australia.
B Corresponding author. Email: ross.bailie@menzies.edu.au
Australian Journal of Primary Health 21(4) 450-459 https://doi.org/10.1071/PY14071
Submitted: 25 April 2014 Accepted: 15 September 2014 Published: 28 October 2014
Journal Compilation © La Trobe University 2015
Abstract
The quality of data derived from primary healthcare electronic systems has been subjected to little critical systematic analysis, especially in relation to the purported benefits and substantial investment in electronic information systems in primary care. Many indicators of quality of care are based on numbers of certain types of patients as denominators. Consistency of denominator data is vital for comparison of indicators over time and between services. This paper examines the consistency of denominator data extracted from electronic health records (EHRs) for monitoring of access and quality of primary health care. Data collection and analysis were conducted as part of a prospective mixed-methods formative evaluation of the Commonwealth Government’s Indigenous Chronic Disease Package. Twenty-six general practices and 14 Aboriginal Health Services (AHSs) located in all Australian States and Territories and in urban, regional and remote locations were purposively selected within geographically defined locations. Percentage change in reported number of regular patients in general practices ranged between –50% and 453% (average 37%). The corresponding figure for AHSs was 1% to 217% (average 31%). In approximately half of general practices and AHSs, the change was ≥20%. There were similarly large changes in reported numbers of patients with a diagnosis of diabetes or coronary heart disease (CHD), and Indigenous patients. Inconsistencies in reported numbers were due primarily to limited capability of staff in many general practices and AHSs to accurately enter, manage, and extract data from EHRs. The inconsistencies in data required for the calculation of many key indicators of access and quality of care places serious constraints on the meaningful use of data extracted from EHRs. There is a need for greater attention to quality of denominator data in order to realise the potential benefits of EHRs for patient care, service planning, improvement, and policy. We propose a quality improvement approach for enhancing data quality.
Additional keywords: clinical information systems, electronic data extraction, primary health care, quality indicators, quality of data.
| What is known about the topic? |
|
| What does this paper add? |
|
Introduction
Increasing expectations regarding efficiency, effectiveness and quality of care are highlighting the need for better information on the care provided to individual patients and to populations. The expanding use of electronic health records (EHRs) has the potential to overcome some of the challenges of gathering data in the primary healthcare setting, and there is international interest in potential benefits of EHRs for patient care and for secondary analysis: outcome measurement, quality improvement, public health surveillance and research (Majeed et al. 2008).
Systematic reviews show a large gap between postulated and demonstrated benefits of EHRs. Many claims are made regarding a wide range of potential benefits, but there is little evidence to substantiate these claims (Black et al. 2011; Crosson et al. 2012; Lau et al. 2012).
An important constraint of EHRs for delivering on their potential is the quality of the data in the EHRs. Recent international research in countries with a relatively long history of use of EHRs has demonstrated the poor reliability of data extracted from EHRs (Parsons et al. 2012; Barkhuysen et al. 2014). While there is a lack of standardised methods for assessing quality of data in EHRs (Thiru et al. 2003), measurement theory refers to reliability and validity of data, with reliability being a ‘precursor’ of validity.
Reliability refers to the production of the same results on repeated collection, processing, storing and display of information (World Health Organization 2003). Reliability is a measure of stability of data, is assessed through comparison of rates and prevalence, and requires consistent denominator data (Thiru et al. 2003). So, assessment of consistency of denominator data is fundamental to assessment of data quality.
Many indicators of quality of care are based on numbers of certain types of patients as denominators. Reliable denominator data are required for the calculation of many indicators for monitoring and improving access and quality of care at any level (health service or practice populations, or populations at regional, State/Territory level). This paper examines the consistency of denominator data required for calculation of indicators of access and quality of care, as extracted from EHRs in general practices and Aboriginal Health Services (AHSs), the reasons for inconsistencies in the denominator data, and proposes a set of indicators for use within a quality improvement approach to enhance the quality of data in EHRs.
Methods
The Sentinel Sites Evaluation (SSE) of the Indigenous Chronic Disease Package (ICDP) provided a unique opportunity to assess the extent to which services are able to provide clinical indicator data that is of sufficient quality for programme monitoring or evaluation purposes (Bailie et al. 2013a). Between the middle of 2010 and early 2013, the SSE provided 6-monthly reports on the progress with implementation of the ICDP in geographically defined ‘Sentinel Sites’. The evaluation framework for the ICDP specified the use of clinical indicator data to assess impact of the ICDP on quality of care and clinical outcomes, with specific reference to diabetes and coronary heart disease (CHD) (Urbis 2010). Over the course of the SSE, requests for clinical indicator data were made to 53 general practices and AHSs in 16 sites over five successive 6-monthly evaluation cycles. The AHSs included Community-Controlled and Government-managed health services. Services were offered a nominal fee for provision of clinical indicator data. The general practices that were approached were those that were identified by regional support organisations (such as Medicare Locals (ML)/Divisions of General Practice (DGP)) as having the capacity to provide clinical indicator data and an interest in Indigenous health. The general practices and AHSs used a variety of software systems and data extraction tools (the most common automated extraction used was the Pen Computing Clinical Audit Tool ( PENCAT)) (Bailie et al. 2013b). Where necessary, the SSE team and regional support organisations provided support to health services to extract clinical indicator data from their EHRs, their quality improvement systems or from data reports prepared by the health services for other purposes. This paper presents further analysis of data that were reported in the appendix of the SSE Final Report (Bailie et al. 2013b). The evaluation methods are described in detail in the SSE Final Report (Bailie et al. 2013a).
Data from more recent cycles were more complete, in terms of numbers of services that provided data and the number of indicators on which they provided data, and most services provided data for no more than two or three cycles, often with a gap between cycles. As a measure of consistency of the data provided, we therefore report on the percentage difference in the numbers provided by each service over a 6 or 12 month period. To calculate the percentage difference, the difference between the number reported in the most recent cycle for which data were provided and the number reported in the preceding one or two cycles (depending on which cycle data were provided, and using the larger difference if data were provided for both preceding cycles) were used. For example, in the first listed GP in Appendix 1, the number of regular patients in the most recent cycle was 9407 and the percentage difference between this and the previous 6 or 12 months is 453%. The calculation was: (9407–1701)/1701 (where 1701 was the number of regular patients reported in the previous 6 or 12 months). The resulting figure is expressed as a percentage to provide a standard measure and to enable comparison between services. For the same service, the percentage difference for Indigenous patients with a diagnosis of diabetes was 400%; the calculation used for this was (5–1)/1, (where 1 was the number of Indigenous patients with a diagnosis of diabetes reported in the previous 6 or 12 months). This approach maximised the use of available data, given that very few services provided data for three or more successive cycles.
We focus on three categories of denominator data that are required for the calculation of key indicators that were specified in the evaluation framework:
-
‘Regular’ patients, based on the definition of ‘regular’ (or ‘active’), as used by each service.
-
Regular patients (or all patients if data for regular patients was not available) with a diagnosis of: (a) diabetes and (b) CHD.
-
Patients identified as Indigenous.
Qualitative data on the ability of services to provide clinical indicator data were gathered through discussion with health service staff in the course of obtaining clinical indicator data for the evaluation, and through in-depth interviews with 24 key informants in services and regional support organisations following the final evaluation cycle. The in-depth interviews aimed to explore barriers and enablers to providing reliable data through encouraging health service and relevant support staff to reflect on reasons for differences in numbers reported in different evaluation cycles. Particular effort was directed at understanding the reasons for the more substantial changes in reported data; this included follow-up interviews and specific enquiry regarding differences in the data reported for different evaluation cycles. Data from interview notes and audio recordings were thematically analysed to identify underlying reasons for the limited ability to provide consistent data over successive evaluation cycles. Data were initially organised according to similar concepts or ideas, and these were then grouped into common themes in relation to influences on quality of data; (1) in general; (2) on regular patients; (3) on patients with specific conditions; and (4) on Indigenous status of patients.
Ethical approval for the SSE was granted through the Department of Health and Ageing Ethics Committee, project number 10/2012.
Results
In response to the requests to provide clinical indicator data, of the 53 services approached, 40 services (26 general practices; 14 AHSs) provided clinical indicator data for at least one evaluation cycle. Almost all of these services provided data on the number of regular patients, number of patients identified as Indigenous and number of patients with a diagnosis of diabetes or CHD (Appendices 1 and 2), with only one general practice and one AHS not providing data on a few specific items.
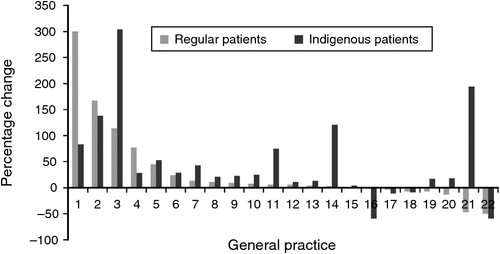
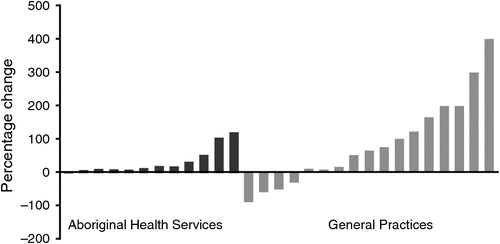
Of the 26 general practices that provided data, 22 provided data that allowed assessment of difference over a 6 or 12 month period in the number of regular patients or the number of patients identified as Indigenous. The percentage change in regular patients ranged between –50% and 453% (average 37%). For nine of the 22 general practices, the change was ≥20%. The percentage change in the number of patients identified as Indigenous ranged between –59% and 304% (average 50%). For 15 of the 22 general practices, the change was ≥20% (Fig. 1).
|
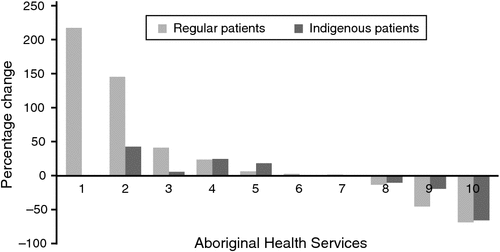
For the 14 AHSs, 10 provided data that allowed for assessment of the difference in regular patients, and nine provided data that allowed for assessment of the difference in patients identified as Indigenous. The percentage difference in regular patients ranged between 1% and 217% (average 31%; for six of the 10 AHSs, the difference was ≥20%). The difference in the number of patients identified as Indigenous ranged between –66% and 42% (average –6%; for five of the nine AHSs, the change was ≥20%; Fig. 2).
|
Approximately two-thirds of the 26 general practices provided data that allowed assessment of change in the reported numbers of patients with a diagnosis of diabetes (17 practices) and/or CHD (18 practices). For the 14 AHSs, the corresponding numbers were 12 and seven. For general practices, the percentage difference in patients with a diagnosis of diabetes ranged between –88% and 400% (average 87%; for 14 of the 17 general practices, the change was ≥20%), and the difference in patients with CHD ranged between –100% and 100% (average 14%; for 10 of the 18 general practices, the change was ≥20%; Fig. 3). For AHSs, the percentage difference in patients with diabetes ranged between 2% and 121% (average 32%; for five of the 12 AHSs, the change was ≥20%), and the difference in patients with CHD ranged between 1% and 168% (average 46%; for three of the seven AHSs, the change was ≥20%; Fig. 3).
|
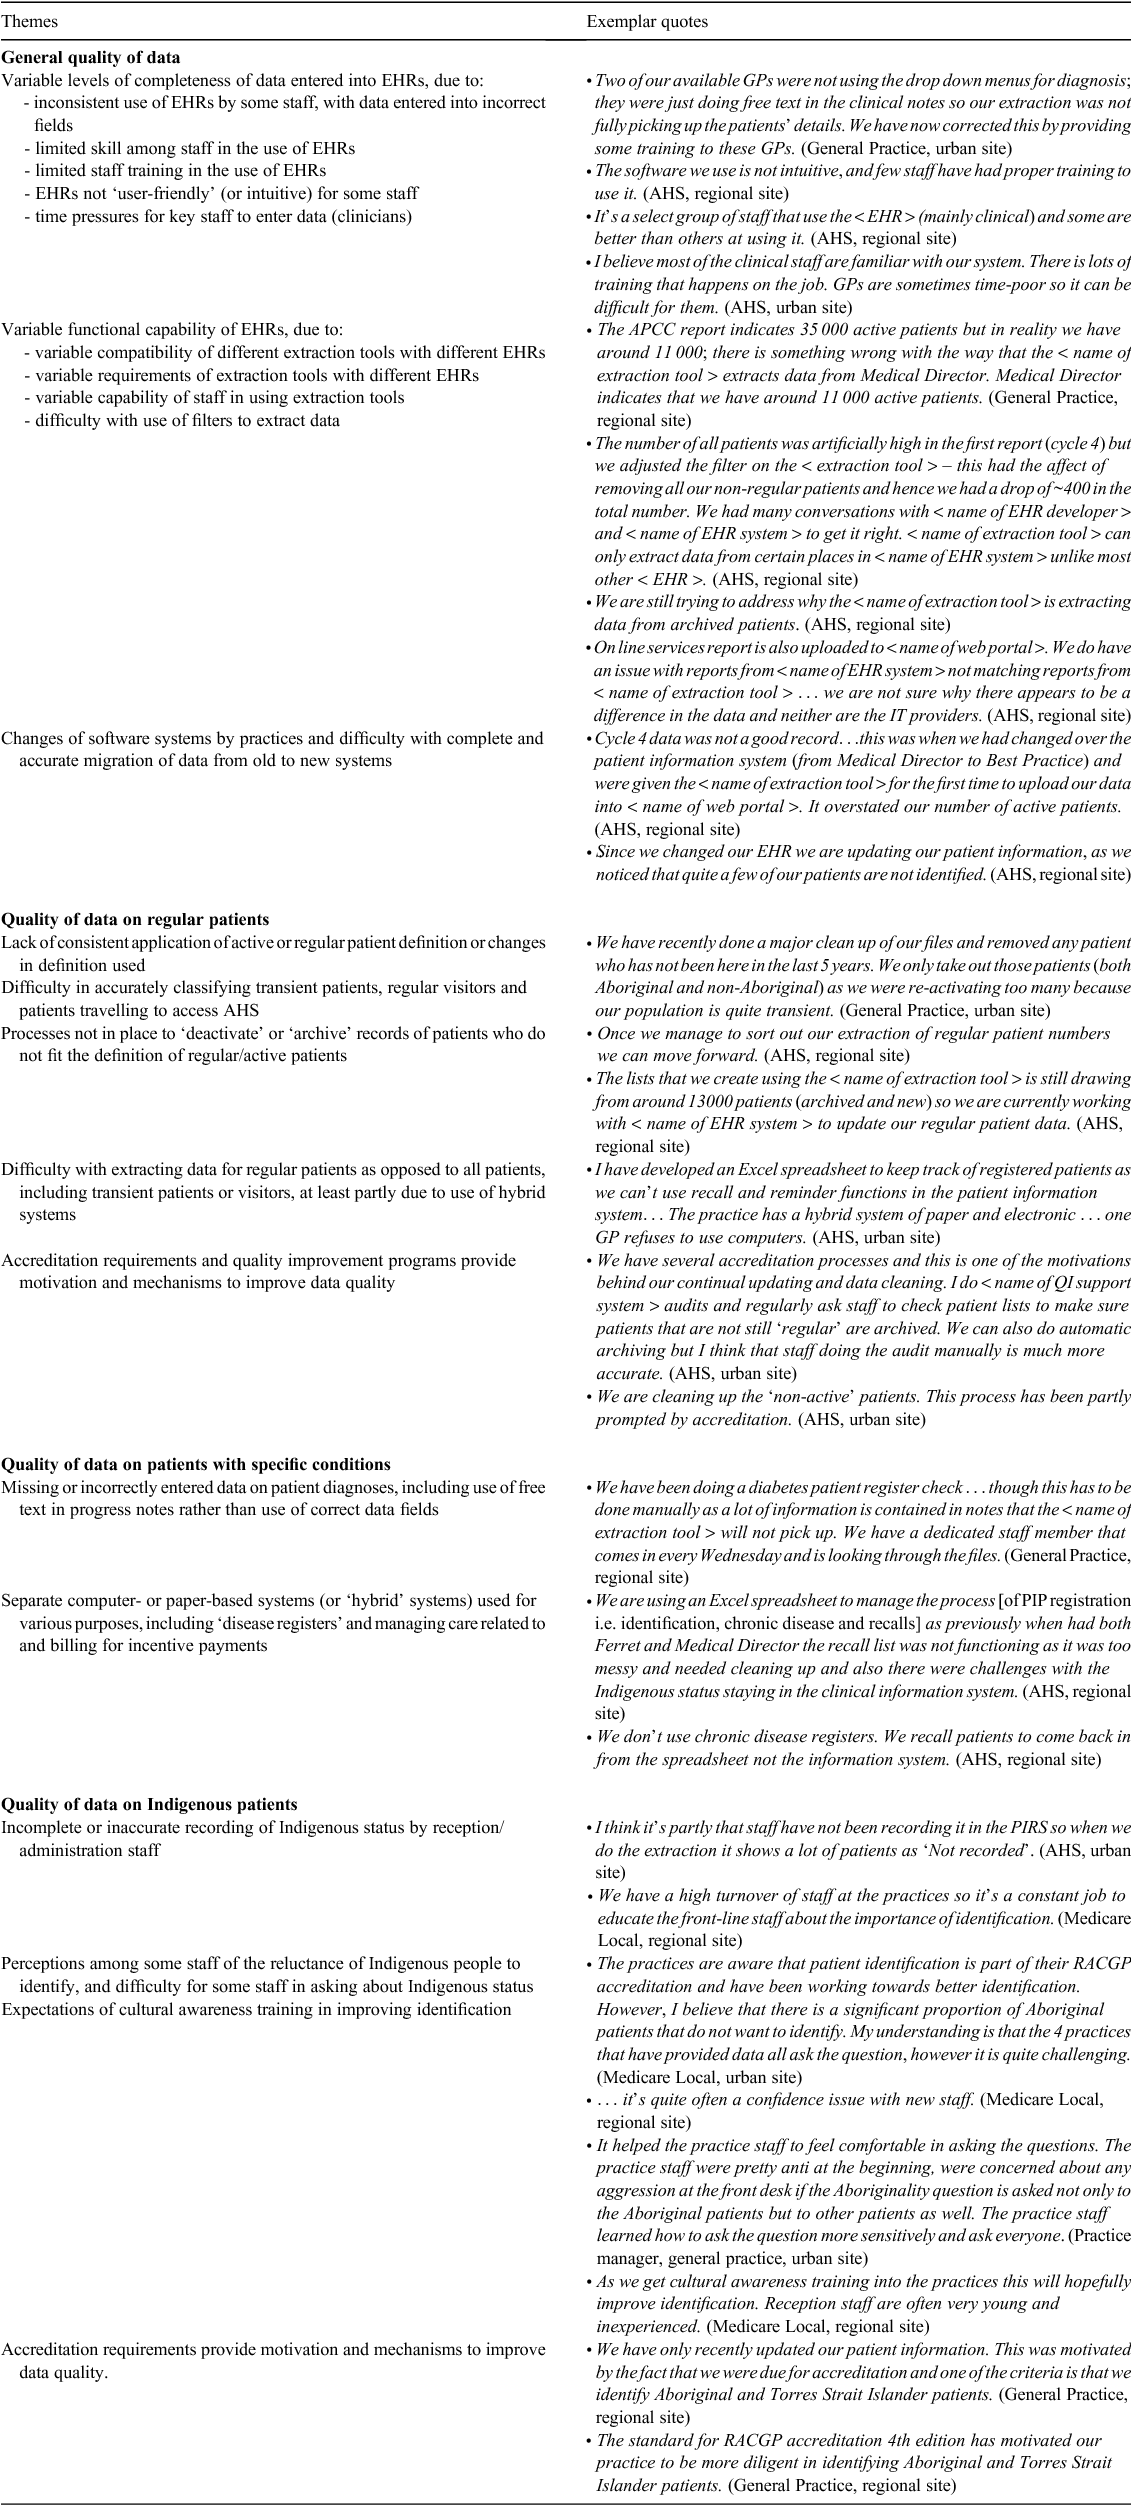
Interviews with health service and DGP/ML staff indicated that the changes in these important categories of denominator data could be attributed to a variety of interacting influences. It was surprisingly difficult in some instances to get clear or specific explanations for changes in reported data, including for some services that showed the most substantial changes. Several influences affected the general quality of data in EHRs, including variable levels of completeness of data, variable functional capability of different EHRs and health services switching between software systems. For each of these, there was a range of contributing factors (Table 1). There were also influences that were specific to certain categories of denominator data. Quality of data on the numbers of regular patients was affected by the lack of use of consistent definitions of ‘regular’ patient; difficulty in determining regular status for some patients; difficulties with data extraction; and inconsistent processes for updating of records regarding ‘regular’ patients. Quality of data on the numbers of patients with specific conditions was affected by missing or incorrectly entered information on patient diagnoses, the use of separate (often stand-alone) information systems for some purposes and difficulty with extracting data on specific groups of patients (including those with a particular diagnosis or those identified as Indigenous). Quality of data on ‘Indigenous status’ was affected by incomplete, unsystematic or inaccurate recording of Indigenous status; difficulties with data extraction; and concerns among staff that some Indigenous people were reluctant to identify. Accreditation requirements and quality improvement processes were identified as contributing to efforts to improve the quality of data, particularly in relation to identifying regular patients and Indigenous status. There were also expectations that cultural awareness training would contribute to quality of data on Indigenous status. Illustrative quotes for each of these influences on quality of data are provided in Table 1.
The evaluation team’s experience of obtaining clinical indicator data, and of supporting services to provide the data, showed varying and often low capability of health service staff to use available systems effectively. It was clear that this varying and low capability was a major underlying reason for the variable quality of data. In addition to inconsistency in data entry and variable capability to extract data for different purposes, few services had systematic processes for cleaning or maintaining data quality, with most reporting their processes were ‘ad hoc’. Many general practices were reliant on DGP/ML staff to assist with extraction of data for reporting purposes, but there was varying capability between DGPs/MLs in providing such support. The focus in some services appeared to be more on extracting data for reporting purposes, with limited understanding of the importance or value of ensuring the quality of the data, or use of data for learning and improvement of health service systems and quality of care.
Discussion
The denominator data that are available for the calculation of many clinical indicators shows substantial inconsistency for many individual primary healthcare services, and is therefore unreliable for the calculation of indicators at regional, state or national levels. Our experience with supporting health service staff to provide data, the inconsistencies in the data provided between cycles and the limited ability of staff to provide coherent explanations for these inconsistencies, indicates that the inconsistencies in reported numbers are due primarily to limited capability of staff in many general practices and AHSs to accurately enter, manage, and extract data from EHRs. These factors mean the numerator data required for clinical indicators are also likely to be unreliable, which compounds the problem of poor denominator data.
As for studies of data quality in primary care internationally (Thiru et al. 2003), limitations of the present study include: (1) that the quality of the data reported in this study is likely to be better than for general practices and AHSs more generally in Australia. The general practices that provided clinical indicator data were identified by the local DGP or ML as those that were more likely to be able to provide good quality data and that had an interest in Indigenous health, and the AHSs in many of the sites were recognised to be relatively well organised and managed; (2) because of the small number of services that provided data regularly for three or more cycles, it was not possible to do more detailed meaningful analysis of change between cycles; and (3) the difficulty in some locations of identifying key informants in health services and support organisations who had knowledge and experience of the operation of EHRs over the time frame of the project. This study limitation is inherent in the study finding regarding limited staff capability in the effective use of EHRs, which is consistent with other research that identifies staff skills and confidence as being an important limitation on effective use of EHRs (Majeed et al. 2008; Kelly et al. 2009; Riley et al. 2010; Black et al. 2011; Coiera 2013).
In contrast to a World Health Organization guide on improving data quality for developing countries (World Health Organization 2003), Australian reports and resources relevant to the use of EHRs in primary health care do not clearly address the fundamental importance of reliable denominator data in health information. Few research studies in Australian primary health care have assessed the quality of the data generated by automatic data extraction tools; for those that have done this, it is generally a secondary objective and they do not assess the stability of denominators (Liljeqvist et al. 2011; Schattner et al. 2011; Peiris et al. 2013).
The relative lack of investment in training in the use of EHRs compared with the high cost and complexity of implementation of EHRs, has been highlighted in Australia and internationally (Spitzer 2009; Lynott et al. 2012; Coiera 2013). The limited evidence on the effectiveness of training in improving data quality in EHRs indicates that short-term, low-intensity training has limited impact (Maddocks et al. 2011). As for other areas of behaviour change and skills development, substantial improvements in data quality are likely to require more intensive training associated with other strategies that are specifically designed to overcome the barriers to improvement as relevant to local contexts (Kaplan et al. 2012).
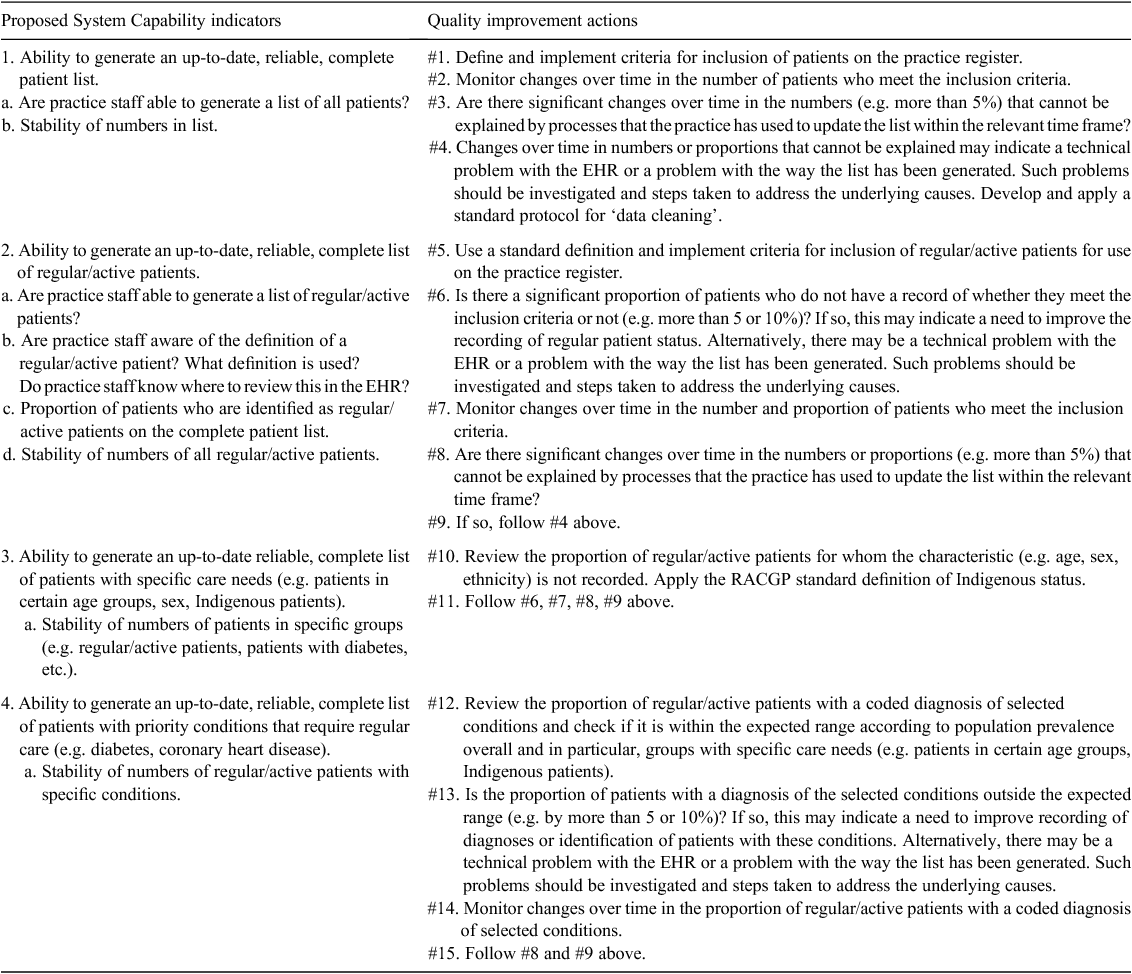
We propose a set of indicators for use within a quality improvement framework for the purpose of ongoing assessment and improvement of health service EHRs, and the capability of health service staff to use these systems effectively for patient-centred care and for enhancing the quality of care for their service populations (Table 2). The quality improvement framework and indicators could be used to encourage, monitor and reward accurate reporting of indicators by services and could enhance development of EHRs at a regional and national level.
In order to increase the understanding of data quality issues and drive efforts to improve data quality more generally, reports on the use of EHRs and of data derived from EHRs should explicitly examine data quality and should be appropriately circumspect with regard to interpretation of data. The vital requirement of good quality data for realising the potential benefits of EHRs, the hazards of poor quality data and the importance of monitoring reliability of data in making the transition to EHRs have been highlighted in recent publications (Majeed et al. 2008; Greiver et al. 2012; Denham et al. 2013). More should be done to encourage accurate recording and reporting of health data as a way of enhancing patient care, service planning and policy development. Even the top performers in quality and safety internationally do not rely fully on automated extraction of data from EHRs for performance improvement (Crawford et al. 2013). Testing and improving the validity and reliability of performance indicators has been identified as an important area for research (Klazinga et al. 2011), and more specific attention to data quality should contribute to a more realistic understanding of the challenges and to more effective and efficient strategies for implementation of EHRs (Black et al. 2011).
The demonstrated inconsistencies in denominator data as a fundamental aspect of data quality places serious constraints on the meaningful use of data extracted from EHRs. There is a need for greater attention to data quality in order to realise the potential benefits EHRs for patient care, service planning and improvement and policy.
Conflicts of interest
RB is the Scientific Director of One21seventy, a not-for-profit initiative to support continuous quality improvement in primary health care, and which uses audits of samples of clinical records as a way of overcoming poor reliability of denominator data.
Acknowledgements
The SSE was conceived and funded by the Commonwealth Department of Health and Ageing. Successful conduct of the SSE was made possible through the active support and commitment of key stakeholder organisations, community members, individuals who participated in the evaluation and the contributions made by the SSE project team and the Department staff. The contributions of James Bailie for the development of data analysis tools are gratefully acknowledged.
References
Bailie R, Griffin J, Kelaher M, McNeair T, Percival N, Laycock A, Shierhout G (2013a) Menzies School of Health Research for the Australian Government Department of Health and Ageing. Sentinel sites evaluation: final report: Menzies School of Health Research, February 2013. Commonwealth of Australia, Canberra.Bailie R, Griffin J, Kelaher M, McNeair T, Percival N, Laycock A, Shierhout G (2013b) Sentinel sites evaluation: final report – appendices: Menzies School of Health Research, February 2013. Commonwealth of Australia, Canberra.
Barkhuysen P, de Grauw W, Akkermans R, Donkers J, Schers H, Biermans M (2014) Is the quality of data in an electronic medical record sufficient for assessing the quality of primary care? Journal of the American Medical Informatics Association 21, 692–698.
| Is the quality of data in an electronic medical record sufficient for assessing the quality of primary care?Crossref | GoogleScholarGoogle Scholar | 24145818PubMed |
Black A, Car J, Pagliari C, Anandan C, Cresswell K, Bokun T, McKinstry B, Procter R, Majeed A, Sheikh A (2011) The impact of eHealth on the quality and safety of health care: a systematic overview. PLoS Medicine 8, e1000387
| The impact of eHealth on the quality and safety of health care: a systematic overview.Crossref | GoogleScholarGoogle Scholar | 21267058PubMed |
Coiera E (2013) Why e-health is so hard. The Medical Journal of Australia 198, 178–179.
| Why e-health is so hard.Crossref | GoogleScholarGoogle Scholar | 23451947PubMed |
Crawford B, Skeath M, Whippy A (2013) Multifocal clinical performance improvement across 21 hospitals. Journal for Healthcare Quality
| Multifocal clinical performance improvement across 21 hospitals.Crossref | GoogleScholarGoogle Scholar | 24001267PubMed |
Crosson JC, Ohman-Strickland PA, Cohen DJ, Clark EC, Crabtree BF (2012) Typical electronic health record use in primary care practices and the quality of diabetes care. Annals of Family Medicine 10, 221–227.
| Typical electronic health record use in primary care practices and the quality of diabetes care.Crossref | GoogleScholarGoogle Scholar | 22585886PubMed |
Denham CR, Classen DC, Swenson SJ, Henderson MJ, Zeltner T, Bates DW (2013) Safe use of electronic health records and health information technology systems: trust but verify. Journal of Patient Safety 9, 177–189.
| Safe use of electronic health records and health information technology systems: trust but verify.Crossref | GoogleScholarGoogle Scholar | 24257062PubMed |
Greiver M, Barnsley J, Glazier R, Harvey BJ, Moineddin R (2012) Measuring data reliability for preventive services in electronic medical records. BMC Health Services Research 12, 116
| Measuring data reliability for preventive services in electronic medical records.Crossref | GoogleScholarGoogle Scholar | 22583552PubMed |
Kaplan HC, Provost LP, Froehle CM, Margolis PA (2012) The Model for Understanding Success in Quality (MUSIQ): building a theory of context in healthcare quality improvement. BMJ Quality & Safety. 21, 13–20.
| The Model for Understanding Success in Quality (MUSIQ): building a theory of context in healthcare quality improvement.Crossref | GoogleScholarGoogle Scholar |
Kelly J, Schattner P, Sims J (2009) Are general practice networks ‘ready’ for clinical data management? Australian Family Physician 38, 1007–1010.
Klazinga N, Fischer C, Asbroek A (2011) Health services research related to performance indicators and benchmarking in Europe. Journal of Health Services Research & Policy 16, 38–47.
| Health services research related to performance indicators and benchmarking in Europe.Crossref | GoogleScholarGoogle Scholar |
Lau F, Price M, Boyd J, Partridge C, Bell H, Raworth R (2012) Impact of electronic medical record on physician practice in office settings: a systematic review. BMC Medical Informatics and Decision Making 12, 10
| Impact of electronic medical record on physician practice in office settings: a systematic review.Crossref | GoogleScholarGoogle Scholar | 22364529PubMed |
Liljeqvist GTH, Staff M, Puech M, Blom H, Torvaldsen S (2011) Automated data extraction from general practice records in an Australian setting: trends in influenza-like illness in sentinel general practices and emergency departments. BMC Public Health 11, 435
| Automated data extraction from general practice records in an Australian setting: trends in influenza-like illness in sentinel general practices and emergency departments.Crossref | GoogleScholarGoogle Scholar |
Lynott MH, Kooienga SA, Stewart VT (2012) Communication and the electronic health record training: a comparison of three healthcare systems. Informatics in Primary Care 20, 7–12.
| Communication and the electronic health record training: a comparison of three healthcare systems.Crossref | GoogleScholarGoogle Scholar | 23336831PubMed |
Maddocks H, Stewart M, Thind A, Terry AL, Chevendra V, Marshall JN, Denomme LB, Cejic S (2011) Feedback and training tool to improve provision of preventive care by physicians using EMRs: a randomised control trial. Informatics in Primary Care 19, 147–153.
Majeed A, Car J, Sheikh A (2008) Accuracy and completeness of electronic patient records in primary care. Family Practice 25, 213–214.
| Accuracy and completeness of electronic patient records in primary care.Crossref | GoogleScholarGoogle Scholar | 18694896PubMed |
Parsons A, McCullough C, Wang J, Shih S (2012) Validity of electronic health record-derived quality measurement for performance monitoring. Journal of the American Medical Informatics Association 19, 604–609.
| Validity of electronic health record-derived quality measurement for performance monitoring.Crossref | GoogleScholarGoogle Scholar | 22249967PubMed |
Peiris D, Agaliotis M, Patel B, Patel A (2013) Validation of a general practice audit and data extraction tool. Australian Family Physician 42, 816–819.
Riley WJ, Parsons HM, Duffy GL, Moran JW, Henry B (2010) Realizing transformational change through quality improvement in public health. Journal of Public Health Management and Practice 16, 72–78.
| Realizing transformational change through quality improvement in public health.Crossref | GoogleScholarGoogle Scholar | 20009648PubMed |
Schattner P, Saunders M, Stanger L, Speak M, Russo K (2011) Data extraction and feedback – does this lead to change in patient care? Australian Family Physician 40, 623–628.
Spitzer R (2009) Clinical information and sociotechnology. Nurse Leader 7, 6–8.
| Clinical information and sociotechnology.Crossref | GoogleScholarGoogle Scholar |
Thiru K, Hassey A, Sullivan F (2003) Systematic review of scope and quality of electronic patient record data in primary care. BMJ 326, 1070
| Systematic review of scope and quality of electronic patient record data in primary care.Crossref | GoogleScholarGoogle Scholar | 12750210PubMed |
Urbis (2010) Indigenous chronic disease package monitoring and evaluation framework [updated 17 December 2010]. Available at http://www.health.gov.au/internet/ctg/publishing.nsf/Content/ICDP-monitoring-and-evaluation-framework [Verified 9 March 2014]
World Health Organization (2003) Improving data quality: a guide for developing countries. World Health Organization, Manila.


