

Insulin exposure during in vitro bovine oocyte maturation changes blastocyst gene expression and developmental potential
Denise Laskowski A D , Ylva Sjunnesson A , Patrice Humblot A , Marc-André Sirard B , Göran Andersson C , Hans Gustafsson A and Renée Båge AA Department of Clinical Sciences, Swedish University of Agricultural Sciences, P.O. Box 7054, SE-750 07 Uppsala, Sweden.
B Departement des Sciences Animales, Centre de Recherche en Biologie de la Reproduction, Pavillon Des Services, local 2732, Université Laval, Québec G1V 0A6, Canada.
C Department of Animal Breeding and Genetics, Swedish University of Agricultural Sciences, P.O. Box 7054, SE-750 07 Uppsala, Sweden.
D Corresponding author. Email: denise.laskowski@slu.se
Reproduction, Fertility and Development 29(5) 876-889 https://doi.org/10.1071/RD15315
Submitted: 1 August 2015 Accepted: 16 December 2015 Published: 29 February 2016
Journal Compilation © CSIRO Publishing 2017 Open Access CC BY-NC-ND
Abstract
Metabolic imbalance impairs fertility, because changes in concentrations of metabolites and hormones in the blood and follicular fluid create an unfavourable environment for early embryonic development. Insulin is a key metabolic hormone known for its effects on fertility: insulin concentrations are increased during energy balance disturbances in diabetes or metabolic syndrome. Still, insulin is frequently used at supraphysiological concentrations for embryo in vitro culture with unknown consequences for the developmental potential of the offspring. In the present study we investigated the effects of insulin exposure during in vitro bovine oocyte maturation on developmental rates, embryo quality and gene expression. Supplementation of the maturation media with insulin at 10 or 0.1 µg mL–1 decreased blastocyst rates compared with an insulin-free control (19.8 ± 1.3% and 20.4 ± 1.3% vs 23.8 ± 1.3%, respectively; P < 0.05) and led to increased cell numbers (nearly 10% more cells on Day 8 compared with control; P < 0.05). Transcriptome analysis revealed significant upregulation of genes involved in lipid metabolism, nuclear factor (erythroid-derived 2)-like 2 (NRF2) stress response and cell differentiation, validated by quantitative polymerase chain reaction. To conclude, the results of the present study demonstrate that insulin exposure during in vitro oocyte maturation has a lasting effect on the embryo until the blastocyst stage, with a potential negative effect in the form of specific gene expression perturbations.
Additional keywords: dairy cow, embryo, metabolism, metabolic programming, metabolic syndrome, morphology, subfertility, transcriptome.
Introduction
Situations with short- or long-term hyperinsulinaemia exist in both cattle and humans, as well as in other species such as rodents, dogs and horses (Eckel et al. 2005).
The insulin-stimulated uptake of glucose has, for a long time, been considered to be unique to muscle cells, adipocytes and blastocysts, but it was shown recently that the signalling pathways could be further defined (Acevedo et al. 2007) and that insulin signalling components are expressed in cumulus cells and oocytes (Purcell et al. 2012). In the bovine, transcripts for insulin-like growth factor (IGF) 1 and IGF2 receptors, as well as insulin receptors, are detectable at all embryo stages from the 1-cell zygote to the blastocyst (Schultz et al. 1992), which demonstrates the importance of insulin signalling during early embryonic development. Still, the role of insulin during early development and the consequences of different doses and exposure times during oocyte maturation remain to be elucidated.
Intricately orchestrated oocyte maturation, the first fundamental steps in the development of a healthy offspring, is required for successful fertilisation (Richards 2005). The final phase of oocyte maturation, initiated by the preovulatory LH peak (Hyttel et al. 1997), can be simulated by an in vitro maturation period of 22–24 h for the in vitro production of embryos (Ward et al. 2002). The cumulus–oocyte complex (COC) has important functions, such as metabolising glucose and providing the oocyte with its most favourable energy substrate, pyruvate (Sutton-McDowall et al. 2010). In vivo, COCs are exposed to the follicular fluid, the composition of which is closely correlated with the situation in the maternal serum (Valckx et al. 2012), although concentrations of metabolites are usually equal to or lower than those found in the serum (Spicer and Echternkamp 1995; Landau et al. 2000). The availability of metabolites and hormones is reflected in the direct environment of the oocyte (Landau et al. 2000; Leroy et al. 2012), strongly linking nutrition, metabolism and oocyte quality (O’Callaghan et al. 1999; Fleming et al. 2012). Consequently, in vivo changes in serum concentrations of insulin and metabolites during periods of metabolic imbalance, such as negative energy balance (NEB; Leroy et al. 2012), obesity (Wu et al. 2012) and diabetes (Colton et al. 2002), or induced by diet (Gong et al. 2002) will also affect the direct environment of the oocyte and may lead to impaired oocyte quality (Adamiak et al. 2005) and lower conception rates (Garnsworthy et al. 2009).
Although increases in IGF and insulin in serum are positively correlated with the onset of cyclicity after calving (Butler and Smith 1989; Britt 1992) because coupling of the growth hormone (GH)–IGF axis has to occur to induce these events (Lucy 2006), it has been shown that in heifers with high growth rate and body condition score (BCS), elevated insulin levels negatively affect embryonic development to the blastocyst stage (Freret et al. 2006). The same negative effects are known for humans, whereby elevated insulin concentrations have been found in the follicular fluid of obese women with impaired fertility (Robker et al. 2009). Obese women or patients suffering from diabetes have lower fertility compared with healthy individuals (Pasquali et al. 2007; Brewer and Balen 2010) and significantly lower chances of becoming pregnant naturally or by assisted reproductive technology (ART; Pinborg et al. 2011).
Diverse in vitro studies have investigated effects of insulin on early embryonic development in different species, such as the mouse (Rao et al. 1990), rabbit (Herrler et al. 1998), rat (Zhang et al. 1990), pig (Lewis et al. 1992) and bovine (Zhang et al. 1991; Matsui et al. 1995; Bowles and Lishman 1998). Inconsistent results have been reported after the addition of different concentrations of insulin during either follicular culture (Fouladi-Nashta and Campbell 2006), oocyte maturation (Zhang et al. 1991; Bowles and Lishman 1998), fertilisation (Bowles and Lishman 1998) or embryo culture (Matsui et al. 1995, 1997; Mihalik et al. 2000). The contradictory results reveal the complexity of the insulin–IGF system and characterise the difficulties in establishing an in vitro model for metabolic imbalance caused by elevated insulin concentrations. Given the detrimental effects of hyperinsulinaemia on fertility and the minimal range of in vivo changes in insulin concentrations between hyper- and hypoinsulinaemia in cattle (Garnsworthy et al. 2009), the use of supraphysiological concentrations of insulin in the microgram range in in vitro systems should be questioned and critically scrutinised. In bovine, in vivo concentrations of insulin in the serum and follicular fluid range between approximately 0.1 and 0.5 ng mL–1 depending on diet and energy state (Landau et al. 2000; Gong et al. 2002; Freret et al. 2006; Shimizu et al. 2008; Garnsworthy et al. 2009) and even follicular phase (Landau et al. 2000). The difficulty in choosing adequate insulin concentrations in an in vitro model is related to differences between in vitro and in vivo maturation (Leibfried-Rutledge et al. 1987; Rizos et al. 2002) and the fact that insulin has been reported to be unstable in in vitro culture systems, with activity starting at concentrations above 1 µg mL–1 (Hayashi et al. 1978), which explains why concentrations of insulin used in vitro tend to be higher (usually in the microgram per millilitre range) compared with in vivo concentrations (Zhang et al. 1991; Matsui et al. 1995, 1997; Bowles and Lishman 1998). Conversely, it has been reported that bovine insulin in physiological concentrations (0.1 and 1 ng mL–1) during granulosa cell culture leads to increased FSH-induced oestradiol production, with a decreasing effect if insulin is used at higher doses (10, 100 or 1000 ng mL–1; Spicer and Echternkamp 1995).
The aim of the present study was to investigate the effects of insulin during the final period of oocyte maturation, because hyperinsulinaemia in vivo is known to reduce oocyte quality in both cows and humans. By using two different insulin treatments, we aimed to investigate the dose effect of insulin and possible detrimental effects linked to a certain threshold in vitro.
Materials and methods
Experimental design
Abattoir-derived COCs were cultured until Day 8 after exposing them to bovine insulin (I5500; Sigma, St Louis, MO, USA) at either 10 or 0.1 µg mL–1 during maturation (see below). A control group without any added insulin was run in parallel with all batches. Groups were kept separate during all subsequent in vitro procedures. After in vitro maturation, oocytes were fertilised with frozen semen obtained from a single bull of the Swedish Red dairy breed with proven field fertility and tested in our laboratory for good results under IVF conditions. After fertilisation, presumed zygotes were cultured until Day 8 under consistent conditions throughout the experiment. Oocytes and different embryo stages were evaluated after the first cleavage division (44 h after insemination) and on Days 7 and 8 of development. The evaluation consisted of visual assessment of the different developmental stages. After final culture, blastocysts were graded and the stage determined before using them for either morphological studies (including staining and fluorescence microscopy) or for RNA extraction for transcriptome analysis. Cleavage rates, blastocyst rates and blastocyst quality assessment data were recorded during the entire study. The experiment included a total of 3082 oocytes, resulting in 627 Day 8 blastocysts (BC8), 120 of which were used for gene expression studies and 339 were stained for morphological assessment.
In vitro production of embryos
Reagents and media
Unless stated otherwise, all media and constituents were obtained from Sigma-Aldrich (Stockholm, Sweden) and were freshly produced in the laboratory (daily or weekly, depending on proved protocols).
Media were produced in our laboratory as described earlier by Abraham et al. (2012) according to Gordon (2003).
Retrieval of ovaries and oocyte origin
Ovaries were collected at a local abattoir (collection time per batch 40–60 min) approximately 25 min after the cows had been killed and were pooled in a thermos with 0.9% sodium chloride solution at 35°C (range 31–35°C). Within 4 h of collection, ovaries were transported to the IVF laboratory at the Department of Clinical Sciences (Swedish University of Agricultural Sciences, Uppsala, Sweden). After arrival, the temperature was checked to confirm that it was within the range 31–35°C and the ovaries were briefly washed twice with sterile 0.9% sodium chloride solution at a temperature of 35°C. All follicles with diameters of approximately 3–8 mm, as determined by visual inspection, were then aspirated by using a 5-mL syringe and an 18-gauge hypodermic sterile needle. Aspirates were collected into search medium, consisting of HEPES-buffered TCM 199 (M7528) supplemented with 0.2% w/v bovine serum albumin (BSA), fraction V (A3311), and 50 µg mL–1 gentamicin (gentamicin sulfate; G1264). The COCs were kept in search medium for washing, collection and selection. Only COCs of excellent or good quality (Grade 1 or 2; Gordon 2003) were chosen for maturation. Following selection, COCs were washed twice in 2 mL search medium and then allocated to one of three experimental groups. The COCs were finally washed twice more in 2 mL final maturation medium (see below).
In vitro maturation
The basic in vitro maturation medium consisted of bicarbonate-buffered TCM 199 (M2154) supplemented with 0.68 mM l-glutamine (G8540), 0.5 µg mL–1 FSH and 0.1 µg mL–1 LH (Stimufol; PARTNAR Animal Health, Port Huron, Canada), 50 µg mL–1 gentamicin and 0.4% w/v BSA. Froups of 30–45 COCs were matured in vitro in a separate well containing 500 µL medium supplemented either with 0 (INS0), 0.1 µg mL–1 (INS0.1) or 10 µg mL–1 (INS10) bovine insulin (I5500). The medium was incubated at least 1 h before onset of maturation in an atmosphere of 5% CO2 in humidified air at 38.5°C. All COCs were incubated for 22 h (24 h after the end of aspiration) at 38.5°C under a 5% O2, 5% CO2 atmosphere.
In vitro fertilisation
After maturation, COCs were washed twice with washing medium, consisting of 114 mM sodium chloride (S5886), 3.19 mM potassium chloride (P5405), 2 mM sodium bicarbonate (S5761), 0.29 mM sodium phosphate (S5011), 2 mM calcium chloride (C7902), 10 mM HEPES (H3375), 0.49 mM magnesium chloride (M2393), 1 µL mL–1 phenol red (P0290) supplemented with 0.5 µM sodium pyruvate (P4562), 0.03 µM sodium lactate (L7900), 50 µg mL–1 gentamicin and 0.3% w/v BSA. Most of the surrounding cumulus cells were removed mechanically until three to five layers of cumulus cells remained. The COCs were transferred to four-well dishes with 460 µL fertilisation medium, consisting of 114 mM sodium chloride (S5886), 3.19 mM potassium chloride (P5405), 25.88 mM sodium bicarbonate (S5761), 0.29 mM sodium phosphate (S5011), 0.49 mM magnesium chloride (M2393), 2 mM calcium chloride (C7902), 10 mM HEPES (H3375), 1 µL mL–1 phenol red (P0290), 0.5 µM sodium pyruvate (P4562), 0.03 µL sodium lactate (L7900), 50 µg mL–1 gentamicin, 0.6% w/v fatty acid-free BSA (A7030), with the addition of 3 µg mL–1 heparin (H3149) and penicillamine, hypotaurine and adrenaline (PHE) giving a final concentration of 1.7 mM sodium chloride (S5886), 10 µM hypotaurine (H1384), 20 µM penicillamine (P4875), 1.5 µM adrenaline (E1635), 42 µM and sodium metabisulfite (S9000).
Two sperm straws (200 µL each) were thawed and prepared by the swim-up procedure. Spermatozoa were put into four tubes, each containing 1 mL capacitation medium, consisting of 110 mM sodium chloride (S5886), 2.68 mM potassium chloride (P5405), 25 mM sodium bicarbonate (S5761), 0.29 mM sodium phosphate (S5011), 0.49 mM magnesium chloride (M2393), 5 mM HEPES (H3375), 1 µM sodium pyruvate (P4562), 0.03 µL sodium lactate (L7900), 1.23 µg mL–1 glucose (G6152), 50 µg mL–1 gentamicin and 0.6% w/v BSA, and incubated for 45 min at 38.5°C in a 5% CO2 incubator. After swim-up, the spermatozoa were removed with 750 µL capacitation medium and pooled in a centrifugation tube. Centrifugation (300g, 8 min, room temperature) produced a sperm pellet, which was washed and diluted in fertilisation medium. Sperm motility before and after swim-up was checked by microscopy on a warm plate and the volume of sperm suspension giving a final concentration of 1 × 10⁶ spermatozoa per mL was added to the oocytes. Oocytes (in groups of 30–45 per well) and spermatozoa were coincubated at 38.5°C in a maximal humidified atmosphere of 5% CO2, 5% O2 and 90% N2 for 22 h.
In vitro culture
Modified synthetic oviducal fluid (mSOF) was used for in vitro culture and consisted of 0.11 M sodium chloride (S5886), 7 mM potassium chloride (P5405), 1.19 mM potassium phosphate monobasic (P5655), 25 mM sodium bicarbonate (S5761), 0.33 mM pyruvic acid sodium salt (P4562), 1 mM l-glutamine (G8540), 0.171 mM calcium chloride (C7902), 1.5 mM glucose (G6152), 110 mM sodium lactate (L7900) and 0.49 mM magnesium chloride (M2393), with addition of minimum essential medium (MEM) non-essential amino acids solution (100×; M7145), amino acids solution (50×; B6766), 0.4% w/v fatty acid-free BSA and 50 µg mL–1 gentamicin.
The oocytes were denuded 22 h after insemination by pipetting and washed twice in mSOF medium before being transferred to the culture medium. Presumed zygotes were incubated under a humidified atmosphere of 5% CO2, 5% O2 and 90% N2 at 38.5°C in 500 µL mSOF medium per well until Day 8. The culture medium was covered with 300 µL paraffin oil (Ovoil; Vitrolife AB, Gothenburg, Sweden) during culture.
The cleavage rate was checked 44 h after insemination by noting the proportion of cleaved embryos. On Day 7, the blastocyst rate was recorded, whereas on Day 8 blastocysts were graded for quality (Grades 1–4) and developmental stage (blastocyst, expanded blastocyst, hatching or hatched blastocyst; International Embryo Transfer Society (IETS) 2010) and moved from culture for further investigations (immediate staining and microscopy or stored deep frozen for gene expression studies).
Staining, image analysis and morphological evaluation by number of nuclei
In all, 339 BC8 were used for morphological evaluation, with 104 in the INS10 group, 116 in the INS0.1 group and 119 in the INS0 group. There were no differences among the three groups used for staining in terms of grade (mean (± s.e.m.) 1.64 ± 0.05, 1.55 ± 0.05 and 1.53 ± 0.05 in the INS10, INS0.1 and INS0 groups, respectively) or stage (1.91 ± 0.07, 2.04 ± 0.07 and 2.08 ± 0.07 in the INS10, INS0.1 and INS0 groups, respectively). Blastocysts were stained with 4.45 µM Hoechst 33342 (B2261) for 20 min. They were then washed three times in phosphate-buffered saline + 0.1% polyvinyl alcohol (PBS-PVA) to remove any remaining dye and then mounted in black well plates in Vectashield (Vector Laboratories, Burlingame, CA, USA). Embryos were placed in approximately 2 µL fluid in the centre of the black well plate and 2 µL Vectashield was added around the drop until the well was full. All images were taken immediately after staining or, at the latest, the following day using an epifluorescence microscope (LSM 510; Carl Zeiss, Jena, Germany) and a fluorescence microscope camera. Image analysis was performed using ZEN 2008 Light Edition Software (Carl Zeiss; http://www.zeiss.com, accessed 13 January 2016). Each BC8 was photographed according to standard magnification (×20) and one camera image (epifluorescence image) where the focus area was in the central area of the blastocyst (CAM). Staging and grading were performed again to confirm the results of the light microscopy on Day 8 in the laboratory.
The number of nuclei was counted by two independent evaluators in a blinded study from the CAM picture (blue Hoechst staining). The average of both counts was calculated. If the sums differed by more than 10%, the count was repeated and deleted from the final calculations if still too different.
Microarray-based transcriptome study
An embryo-specific microarray from Agilent Technologies (Santa Clara, CA, USA) was used in collaboration with the EmbryoGENE platform (Université Laval, Québec, Canada), comprised of a total of 42 242 probes, as described by Robert et al. (2011).
Freezing and pooling for RNA extraction
All steps were performed under strict RNAse-free conditions. Before freezing, all blastocysts were graded and stage determined according to valid standards (Lindner and Wright 1983; IETS 2010). Blastocysts were washed three times in PBS-PVA before being frozen separately in 2 µL PBS-PVA at –80°C. RNA extraction was performed with pools of 10 embryos with equally distributed developmental stages and quality grades per pool. Only blastocysts of high-quality grades were used. Four replicates of 10 embryos per treatment (INS10, INS0.1, INS0) were used for the RNA analyses (n = 120 BC8).
RNA extraction
RNA extraction and the following steps for gene expression analyses were performed at the EmbryoGENE platform (Robert et al. 2011). Total RNA and genomic (g) DNA were extracted in parallel using the AllPrepDNA/RNA micro kit (Qiagen, Hilden, Germany). The gDNA was kept at –80°C for later epigenetic studies. The quality and quantity of total RNA was assessed using the Agilent 2100 Bioanalyzer (Agilent, Santa Clara, CA, USA) and RNA 6000 Pico Reagents (Agilent Technologies). All pooled samples resulted in RNA integrity number (RIN) values above 7.5. Half the extracted RNA was subsequently used for microarray analysis and the other half was used for reverse transcription–quantitative polymerase chain reaction (RT-qPCR) analysis.
RNA amplification
RNA amplification was required because of the limited amount of RNA in the starting material and was performed using the RiboAmp HS-plus RNA-amplification Kit (Life Technologies, Burlington, ON, Canada; linear amplification based on the EBERWINE method; Van Gelder et al. 1990). Briefly, total cellular RNA from the samples was amplified with two rounds of first- and second-strand cDNA synthesis, followed by cDNA purification, in vitro transcription and anti-sense(a) RNA) purification. The resulting aRNA was analysed by measuring its concentration and purity using a Nanodrop (NanoDrop Products, Wilmington, DE, USA) (Fleige and Pfaffl 2006). All samples fulfilled the quality criteria of an optical density ratio of 260 to 280 nm (OD260/OD280) >1.8 and an OD260/OD230 >1.8. The aRNA concentration varied between 227.5 and 798.1 ng µL–1. The amplification step was validated according to the methods described by Vallée et al. (2009) and Gilbert et al. (2010).
aRNA labelling
The universal linkage system (ULS) by Kreatech (Leica Microsystems, Concord, ON, Canada) for Agilent microarrays was used for labelling of aRNA. Briefly, 2 µL each of CY3-ULS (green) and CY5-ULS (red) was added to 2 μg aRNA, derived from the treated or control sample. Non-reacted ULS label was removed using a Picopure RNA Isolation Kit (Life Technologies). The amount of labelling and final aRNA concentration were checked using a Nanodrop before hybridisation.
Hybridisation of Agilent oligo microarray slides
For hybridisation, 825 ng labelled, linearly amplified aRNA was used for each colour and the microarray hybridisation chamber was loaded according to the manufacturer’s instructions (Agilent Technologies). The slides were washed for 3 min in wash buffer 1 at RT°C, 3 min in wash buffer 2 at 42°C, 10 s in acetonitrile at room temperature and 30 s in stabilisation and drying solution at room temperature (Agilent).
Microarray data analysis of the transcriptome
Slides were scanned with a PowerScanner (Tecan, Mannedorf, Switzerland) and feature extraction was performed using Array-pro6.3 (Media Cybernetics, Bethesda, MD, USA). Intensity files were analysed with FlexArray (Genome Quebec, Montreal, Canada) (Blazejczyk et al. 2007). Raw fluorescence intensity data were corrected by background subtraction, Loess normalisation within array and quantile normalisation between arrays. Moreover, data were analysed using Ingenuity Pathway Analysis (IPA) (Qiagen, Redwood City, CA, USA) by constructing pathways and gene interaction patterns affected by insulin treatment.
RT-qPCR validation of candidate genes
Validation of microarray results was performed by RT-qPCR on the RNA from the same pools used for the microarray analysis. Total extracted RNA equivalent to the amount of five blastocysts (four replicates for each group) was used. The RNA was transformed into cDNA using the Qscript Flex cDNA kit (Quanta Biosciences, Gaithersburg, MD, USA) and an oligo-dT according to the manufacturer’s instructions. Specific primers for each selected gene were designed using PrimerQuest (Integrated DNA Technologies, Coralville, IA, USA) and RT-qPCR was performed using a LightCycler 480 SYBR Green I Master and LightCycler 480 System (Roche Diagnostics, Laval, Canada). To confirm the specificity of each pair of primers, the amplicons were electrophoresed on an agarose gel, purified and sequenced. A standard curve consisting of five points of the PCR product for each primer pairs diluted from 1 pg to 0.1 fg was used for real-time quantification of the PCR output. The PCR conditions used for all genes were as follows: denaturing cycle for 10 s at 95°C, followed by 50 PCR cycles (denaturing at 95°C for 10 s; annealing at specific temperature for 10 s; extension at 72°C for 20 s), a melting curve (95°C for 1 s, 65°C for 1 s, and a step cycle starting at 72°C up to 97°C at a rate of 0.11°C s–1) and a final cooling step at 40°C. Data analysis was performed using LightCycler 480 Software 1.5.0 SP4 (version 1.5.0.39) with the second-derivative maximum analysis method. Data normalisation used GeNORM normalisation factor (Biogazelle, Gent, Belgium) from expression values of three reference genes, namely β-actin (ACTB), peptidylprolyl Isomerase A (Cyclophilin A) (PPIA) and beta-2-microglobulin (B2M). According to GeNORM, the two most stable housekeeping genes (B2M and ACTB) were used to transform the data. Primer sequences, product size, annealing temperature and accession numbers are provided in Table S1, available as Supplementary Material to this paper.
Statistical analyses
Developmental rates, morphological analyses and cell counts
The main effects of insulin treatment during maturation were analysed by analysis of variance (ANOVA) using the PROC GLM procedure of SAS version 9.2 (SAS Institute Inc., Cary, NC, USA). Results were analysed following arc sinus √p transformation of initial percentages. Post-ANOVA multiple comparisons were realised by using the Scheffé adjustment and contrast options available under GLM. The significance level was set at P < 0.05. Results are presented as the least square mean ± s.e.m. of initial percentages unless specified otherwise. Similar procedures were used to analyse the effects of insulin treatment on gross morphology (embryo stage and quality grade) and the number of nuclei following Hoechst staining.
Microarray
An empirical Bayes moderated t-test and the ‘limma’ package in R (Smyth 2004) were used to search for differentially expressed genes between the control and each of the insulin-treated groups. The EmbryoGENE microarray platform (Robert et al. 2011) was used to obtain a large-scale comparison between the insulin-treated groups and the control group. A positive or negative fold-change of >1.5 with P < 0.05 was set as the definition for differentially expressed transcripts (DET).
RT-qPCR
Differences in expression between the INS0 and the INS0.1 groups, as well as between the INS0 and the INS10 groups, were compared by unpaired t-test (Prism 5; GraphPad Software Inc., La Jolla, CA, USA) following log transformation of data. Differences in expression were considered as significant at one-tailed P < 0.05.
Results
Effects of insulin on developmental competence
First cleavage rates (i.e. proportion of oocytes cleaved/immature oocytes) did not differ significantly between the insulin-treated (INS10 and INS0.1) and control (INS0) groups (Table 1).

|
Significant effects of insulin treatment during in vitro maturation and the embryo production period were observed on blastocyst development rates (total number of blastocysts/total number of immature oocytes) by Day 8 (P < 0.05; Table 1). The percentage of blastocyst development by Day 8 was highest in the INS0 group. Blastocyst rates in the INS10 group were significantly lower than in the INS0 group and there was tendency for lower blastocyst rates in the INS0.1 group compared with the control group (P = 0.14; Table 1). Combining treated versus untreated oocytes (i.e. INS10 and INS0.1 vs INS0) indicated a lower blastocyst rate in the treated compared untreated group (P < 0.05; Table 1).
Effects of insulin on phenotype and morphology of BC8
Gross morphological evaluation of embryo stages and quality grades revealed no significant differences between the treatment groups. However, average cell count following Hoechst staining of nuclei differed significantly when the INS10 and INS0.1 groups were together compared with the INS0 group (P = 0.03;Table 1). In both treated groups, the cell number was increased by nearly 10% compared with control.
Effects of insulin on gene expression patterns in BC8
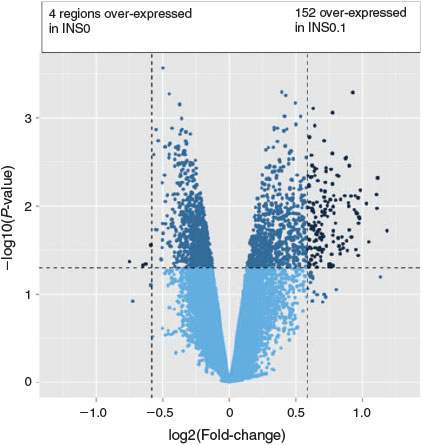
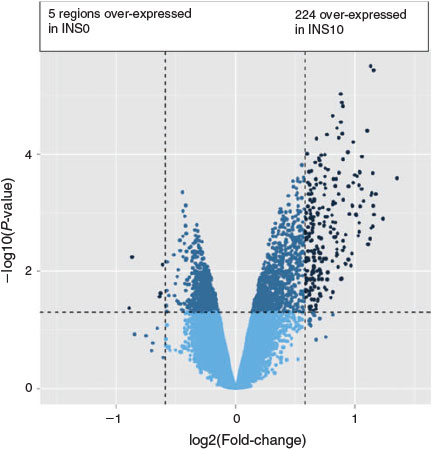
Analysis of gene expression in insulin-treated versus control groups revealed differences for 156 transcripts in the INS0.1 group (four downregulated, 152 upregulated; Fig. 1) and 229 transcripts in the INS10 group (five downregulated, 224 upregulated; Fig. 2) with 120 of the changed transcripts being present in both groups (Fig. 3). Compared with the control group, most of the concordant DETs showed a more prominent fold-change in the INS10 than INS0.1 group, with a more pronounced effect of insulin on gene expression following maturation in the presence of the higher concentration of insulin. Correlation between fold-changes in the INS0.1 and INS10 groups was high (r = 0.70; P < 0001), showing that most genes responded in a similar way to the lower and higher concentrations of insulin. The global transcription pattern of embryos developing after insulin treatment during oocyte maturation exhibited overall upregulation of gene expression.
|
|
|
Following global gene expression pattern analysis, genes associated with growth/chromatin structure, steroid/cholesterol metabolism and energy supply were found in the top 10 upregulated genes, sorted by fold-change (Tables 2, 3). Canonical pathway and cellular function analysis by IPA revealed that DETs were associated with NF-E2 p45-related factor-2 (NRF2)-mediated oxidative stress response (seven DETs in INS0.1 and six DETs in INS10, including kelch-like ECH-associated protein 1, KEAP1), the cell cycle (60 DETs in INS0.1 and 11 DETs in INS10, including SRY (sex determining region Y)-box 2 (SOX2)), cellular compromise (22 DETs in INS0.1 and 13 DETs in INS10, including KEAP1), lipid and carbohydrate metabolism (16 DETs in INS0.1 and 17 DETs in INS10, including acetyl-/propionyl-coenzyme A carboxylase alpha chain (ACCA1), apolipoprotein A-I (APOA1), cytochrome P450 family 11 subfamily A member 1 (CYP11A), 7-dehydrocholesterol reductase (DHCR7), insulin induced gene 1 (INSIG)), cellular growth and proliferation (24DETs in INS0.1 and 21 DETs in INS10, including APOA1 and DHCR7) and cellular assembly and organisation (16 DETs in INS0.1 and 25 DETs in INS10, including APOA1, CYP11A1, INSIG; Table 4; Tables S2–S13). The specified genes were used as representatives for the pathways and validated by RT-qPCR. More detailed analysis of the gene network linked to lipid metabolism revealed strong evidence of changes in the cholesterol and steroid metabolism of both insulin-treated groups (Fig. 4a, b).

|

|

|

|
The data discussed herein have been deposited in the Gene Expression Omnibus of the National Center for Biotechnology Information (NCBI; Edgar et al. 2002) and are accessible through GEO Series accession number GSE62881 (http://www.ncbi.nlm.nih.gov/geo/query/acc.cgi?acc=GSE62881, accessed 17 September 2015).
RT-qPCR validation of differential gene expression of selected candidate genes
RT-qPCR validation was performed for 14 candidate genes chosen among representative genes of the most affected pathways, thus allowing broad validation of the changes in gene expression induced by insulin treatment. Most genes were linked to energy metabolism, cell differentiation and cellular compromise (gene groups sorted by function, according to IPA), with some genes having an effect in several pathways, which is why their validation is of particular importance. Eleven of the 14 selected genes (80%) showed similar patterns as the microarray data (Fig. S1a, b, c, d). Of these, four differed in the same direction with a tendency for higher expression as determined by RT-qPCR in the treated compared with control groups. Tendencies for differences in expression following a different direction than the microarray results were observed for the mevalonate (diphospho) decarboxylase (MVD), Fas-activated serine/threonine kinase (FASTK) and ATPase, H+ Transporting, Lysosomal Accessory Protein 2 (ATP6AP2) transcripts. Genes involved in apoptotic signalling (FASTK) and cell differentiation/blastocyst formation (SOX2, goosecoid homeobox (GSC)) were selected to validate the effects of insulin on developmental potential. Effects on metabolism were addressed by selecting genes involved in growth, lipid metabolism (adiponectin receptor 2 (ADIPOR2), INSIG1, APOA1, DHCR7, MVD, CYP11A1, ACCA1, and phosphatidic acid phosphatase type 2C (PPAP2C)) and the oxidative stress response, as well as in mitochondrial activity (KEAP1 and NADH:ubiquinone oxidoreductase subunit A10 (NDUFA10)). DNA (cytosine-5-)-methyltransferase 3 beta (DNMT3B), an important epigenetic modulator, was also differentially expressed in blastocysts derived from the insulin-treated groups.
Discussion
The results of the present study validate an in vitro model for metabolic imbalance caused by hyperinsulinaemia during oocyte maturation. The use of two different insulin concentrations allowed conclusions regarding different dose effects by investigating similarities and differences in embryo developmental rates, phenotype and mRNA expression related to the exposure of oocytes to an extreme (INS10) and more moderate (INS0.1) concentration of insulin during maturation. It was shown that both concentrations of insulin led to similar lasting effects in the blastocysts 8 days after exposure. Regarding developmental rates and phenotype, both treatment groups were more closely related to each other than the control group. This was also apparent in the observed gene expression patterns, where a strong fold-change correlation for INS0.1 and INS10 was obtained and similar pathways were affected regardless of the treatment concentration. This was further supported by RT-qPCR results. This correlation strengthens our results because the DET data from both insulin groups could be seen as issued from a complete biological replicate. Still, the strongest effect in all aspects was observed in the INS10 group, which is interesting because it reveals the potentially toxic effect of high insulin concentrations on early embryo development by gaining insights into the molecular patterns involved. This result provides a basis for further investigations and should lead to a better understanding of reasons behind fertility problems linked to hyperinsulinaemia.
The Day 8 blastocyst rate was decreased in the insulin-treated groups, reaching significance when both treatment groups together were compared with the control group (Table 1), confirming the hypothesis that elevated insulin concentrations during maturation impair the developmental competence of the oocyte. Analyses of differences in gene expression levels linked to a certain phenotype provided suggestions for the underlying biological pathways and we suspect that the phenotype in the INS10 and INS0.1 groups is less favourable for later development because we confirmed a lower blastocyst rate in both groups compared with the control group. The phenotype in the insulin-treated group was characterised by a higher cell number in blastocysts on Day 8 compared with those derived from untreated oocytes. Because there was no significant difference in developmental stage or embryo quality grade according to morphological evaluation of all groups on Day 8, the increased cell number of the developing embryos after insulin treatment may not be linked to a more progressed developmental stage, but rather implies increased proliferation. This observation was confirmed by transcriptome analyses, because none of the DETs in the INS10 or INS0.1 groups is common with those known to be associated with stage-related differences (Rekik et al. 2011). An increased cell number more likely indicates accelerated proliferation and growth within the equally developed groups, because embryo stage as a confounder can be excluded. Whether the variation in cell number is beneficial or harmful for future development needs to be investigated further. As reported in the ‘quiet embryo hypothesis’ (Baumann et al. 2007; Leese et al. 2007), a slower metabolism during the early stages is seen as beneficial for survival of the embryo and a characteristic of good viability. The increased proliferation could be associated with metabolic stress induced by insulin through an activated metabolic profile. This is supported by our results showing DETs linked to lipid metabolism and the NRF2-mediated stress response. Other studies have reported decreased cell numbers under metabolic stress conditions linked to low circulating insulin concentration as a model using elevated non-esterified fatty acids (NEFA) during in vitro maturation mimicking NEB (Van Hoeck et al. 2011). Earlier, other authors investigated the effect of insulin on blastocyst cell number in different species, such as the rabbit (Herrler et al. 1998), mouse (Mihalik et al. 2000) and cow (Matsui et al. 1995, 1997; Bowles and Lishman 1998; Mihalik et al. 2000; Byrne et al. 2002; Augustin et al. 2003). These authors reported contradictory results, including no effect (Bowles and Lishman 1998; Mihalik et al. 2000; Byrne et al. 2002) or an increased cell number in cows (Matsui et al. 1995, 1997; Augustin et al. 2003), mice (Mihalik et al. 2000) and rabbits (Herrler et al. 1998). In the majority of studies, insulin was added during culture, which is different from our chosen model, in which insulin is added during maturation. Differences between species, in the period of exposure and in the concentrations used make comparisons and final conclusions difficult. Summarising, we still hypothesise that a cell number close to the one found in the control group is beneficial for later development, linking together the best developmental outcome with phenotype.
We could not find any significant differences in cleavage rate between the different groups (Table 1). Early cleavage is usually known to be linked to developmental competence (Yadav et al. 1993; Plante et al. 1994; Lonergan et al. 1999; Ward et al. 2001) and could indicate a possible faster development following maturation in the presence of insulin. Because we cannot be certain about the advantage or disadvantage of hastened development during this stage, our observations are consistent with the notion that insulin treatment during maturation did not have any effects on cleavage rate or pace compared with the control group. In conclusion, the effect of insulin exposure during maturation primarily affects events following first cleavage.
A more precise tool to assess the developmental potential of an embryo is to investigate its gene expression patterns; as such, molecular studies are likely to reveal more information about metabolic activity and survival factors expressed by the embryo (Vigneault et al. 2009). The response of oocytes or embryos exposed to different metabolic stressors can result in changes in the transcriptome, as shown for hyperglycaemia (Cagnone et al. 2012), NEFA (Van Hoeck et al. 2015) and serum lipids (Cagnone and Sirard 2014). The use of different concentrations could reveal changes specific for certain substances, as well as revealing concentration differences with different effects of the same substance depending on the concentration used (i.e. physiological or toxic concentrations). We performed large-scale analyses of transcriptome differences together with investigations of candidate genes involved in apoptosis, differentiation and metabolism of the Day 8 embryo after insulin treatment. Because the focus of the present study was to define developmental potential and embryo survival, candidate genes were selected supporting the hypothesis that insulin exposure during maturation increases the development, differentiation and growth of the growing embryo during metabolic imbalance, but at the expense of a decreased viability (Baumann et al. 2007). When evaluating the transcriptome in the INS10 and INS0.1 versus INS0 groups, general upregulation of gene expression was observed with more evident differences after exposure to the higher concentration of insulin. This means that even after a relatively short-term exposure to insulin during maturation, a different expression pattern remains 8 days after the initial treatment, which demonstrates the severe impact of metabolic stress on the developing embryo. Thus, we showed that the oocyte is sensitive to insulin in the final phase of maturation and that insulin exposure during maturation has an effect on early development, at least until the blastocyst stage. Metabolic programming of the embryo in challenging situations may also have consequences for the adaption capacity of the offspring later in life and may cause changes for following generations, because some epigenetic changes in response to dietary situations have been reported to be transgenerationally heritable (Heerwagen et al. 2010). Because we found upregulation of the DNA methyltransferase DNMT3B, a different methylation pattern of embryos treated with insulin during maturation may be suspected (Reik et al. 2001).
Using IPA, DETs were further defined and pathways related to energy metabolism, differentiation, the oxidative stress response and mitochondrial activity were confirmed by RT-qPCR, with a concordance of 80% with the microarray data. Consequently, we confirmed that insulin exposure during maturation has an effect on energy homeostasis of the embryo. Most evident differences were observed in gene expression linked to lipid metabolism (e.g. where both upregulation of pathways leading to lipid accumulation (DHCR7 and MVD) and its countermeasures (ADIPOR2, APOA1 and INSIG) were found). The lower insulin concentration (INS0.1) affected cholesterol metabolism on different levels, with general stimulation of lipid uptake in the cells, whereas the higher dose (INS10) even stimulated pathways against the accumulation of cholesterol and lipids, probably to regulate the excess of stored lipids, which could be harmful to the normal function of cell metabolism. Insulin increases the production of the apolipoprotein APOA1 gene expression, as reported earlier (Murao et al. 1998; Lam et al. 2003), which can be seen in insulin-resistant individuals. Although the catabolic rate of APOA1 is increased in diabetic patients APOA1 levels are usually reduced. This is associated with a higher risk of coronary heart disease (Mooradian et al. 2004). The increased expression of APOA1 in both the INS10 and INS0.1 groups is an interesting finding because imbalances in serum lipoproteins play an important role in the hyperinsulinaemia–metabolic syndrome complex and could be linked to metabolic programming of the embryo (van Montfoort et al. 2014).
Genes associated with differentiation, blastocyst formation, inner cell mass development and growth (transcriptional enhancer factor TEF-3 (TEAD4), SOX2, and GSC) have been reported as markers of embryo quality (Meijer et al. 2000; Nishioka et al. 2008) and were found to be upregulated by insulin treatment in the present study, which supports the hypothesis that the differential gene expression pattern of the embryo is showing some asynchrony with the observed phenotype. As there are changes in gene expression as well as in the phenotype (increased cell number) which point in the direction of an expedite development, detrimental consequences of this accelerated development cannot be excluded even for later stages of the embryo. Even if studying the effect of insulin on early embryo development is still complicated because of multiple factors interacting with insulin signalling, such as the IGF system, including binding proteins and different receptor types, the results of the present study demonstrate important changes in phenotype and gene expression induced by insulin. Several observed changes in the transcriptome have a direct link to metabolism and developmental potential, which shows the importance of a balanced metabolic situation necessary for healthy embryonic development in the cow. This knowledge will also help us to understand the reasons behind reproductive disorders linked to hyperinsulinaemia in humans, because this in vitro system is a good model for studying oocyte maturation in women with hyperinsulinaemia caused by obesity or diabetes. Because we could prove that the oocyte is sensitive to insulin during maturation with changes persisting 8 days after exposure, we suggest that the use of insulin in different media in vitro embryo production systems should be limited. It cannot be excluded that the effects of insulin on different metabolic processes remain even at later developmental stages and could cause problems for the offspring later in life. It may be interesting to also investigate later stages of development to determine whether the effects found in the present study persist after the blastocyst stage or whether compensatory mechanisms exist. The genes identified in the present study as being differentially expressed in response to insulin signalling could be used to investigate and monitor specific levels of methylation in newborn calves from NEB cows or potentially in children from patients with metabolic syndrome. By investigating developmental rates, morphology and gene expression of BC8 derived from oocytes matured in the presence of two different insulin concentrations, the present study provides a detailed picture of the effects of insulin on early development. Because it even includes conclusions about a different concentration effects of insulin, the present study could add value for improving in vitro production protocols and reducing the risk of an induced hyperinsulinaemia in in vitro production systems. It further provides information regarding the biological pathways that could be involved in the impaired fertility caused by hyperinsulinaemia and elucidates possible negative consequences for offspring derived from hyperinsulinaemic conditions because of metabolic disturbances or created by in vitro systems.
Acknowledgements
The authors acknowledge Isabelle Dufort, Dominic Gagné and Eric Fournier at EmbryoGENE for their support in the laboratory and bioinformatics work, and Maria Celina Abraham and Ida Lindgren for their help in the IVF laboratory in SLU, Uppsala. The authors also thank SCAN (Linköping, Sweden) for providing the ovaries for the present study. Acknowledgements to Jeanette Axelsson for valuable input during the project proposal writing and planning. This work was supported by FORMAS, The Swedish Research Council for Environment, Agricultural Sciences and Spatial Planning (Grant no. 222–2010–1132). Collaboration with EmbryoGENE was supported by The Natural Sciences and Engineering Research Council of Canada (NSERC) Canada.
References
Abraham, M. C., Gustafsson, H., Ruete, A., and Brandt, Y. C. B. (2012). Breed influences on in vitro development of abattoir-derived bovine oocytes. Acta Vet. Scand. 54, 36.| Breed influences on in vitro development of abattoir-derived bovine oocytes.Crossref | GoogleScholarGoogle Scholar | 22682104PubMed |
Acevedo, N., Ding, J., and Smith, G. D. (2007). Insulin signaling in mouse oocytes. Biol. Reprod. 77, 872–879.
| Insulin signaling in mouse oocytes.Crossref | GoogleScholarGoogle Scholar | 1:CAS:528:DC%2BD2sXht1Cnu77I&md5=1d2967e5ac7aa17a84b9b758d34d70e9CAS | 17625112PubMed |
Adamiak, S. J., Mackie, K., Watt, R. G., Webb, R., and Sinclair, K. D. (2005). Impact of nutrition on oocyte quality: cumulative effects of body composition and diet leading to hyperinsulinemia in cattle. Biol. Reprod. 73, 918–926.
| Impact of nutrition on oocyte quality: cumulative effects of body composition and diet leading to hyperinsulinemia in cattle.Crossref | GoogleScholarGoogle Scholar | 1:CAS:528:DC%2BD2MXhtFGktb7L&md5=a352c18978ef408e1f8797cdcefcc538CAS | 15972884PubMed |
Augustin, R., Pocar, P., Wrenzycki, C., Niemann, H., and Fischer, B. (2003). Mitogenic and anti-apoptotic activity of insulin on bovine embryo produced in vitro. Reproduction 126, 91–99.
| Mitogenic and anti-apoptotic activity of insulin on bovine embryo produced in vitro.Crossref | GoogleScholarGoogle Scholar | 1:CAS:528:DC%2BD3sXlvFCnurs%3D&md5=66f3d80d48b2902947f0b05bafbac2c3CAS | 12814351PubMed |
Baumann, C. G., Morris, D. G., Sreenan, J. M., and Leese, H. J. (2007). The quiet embryo hypothesis: molecular characteristics favoring viability. Mol. Reprod. Dev. 74, 1345–1353.
| The quiet embryo hypothesis: molecular characteristics favoring viability.Crossref | GoogleScholarGoogle Scholar | 1:CAS:528:DC%2BD2sXhtVCmtr7O&md5=783a2db3ee0ceb70f660a10bef6cd0bdCAS | 17342740PubMed |
Blazejczyk, M., Miron, M., and Nadon, R. (2007). FlexArray: a statistical data analysis software for gene expression microarrays. Available at http://genomequebec.mcgill.ca/FlexArray [verified 4 February 2016].
Bowles, C. M., and Lishman, A. W. (1998). Attempts to improve the yield of bovine blastocysts by incorporating insulin, selenium and transferrin in the in vitro system. S. Afr. J. Anim. Sci. 28, 30–37.
| 1:CAS:528:DyaK1cXmvVSls74%3D&md5=8afc49e3dfff852aeed7de1bbb2b22b9CAS |
Brewer, C. J., and Balen, A. H. (2010). The adverse effects of obesity on conception and implantation. Reproduction 140, 347–364.
| The adverse effects of obesity on conception and implantation.Crossref | GoogleScholarGoogle Scholar | 1:CAS:528:DC%2BC3cXht1Cnu7fI&md5=4cf15ff689ed3cd957f9207de6c731c8CAS | 20395425PubMed |
Britt, J. H. (1992). Impacts of early postpartum metabolism on follicular development and fertility. In ‘Proceedings of the Annual Convention of the American Association of Bovine Practitioners 1992’, Volume 24. (Ed. E. I. Williams.) pp. 39–43. (Frontier Printers: Stillwater, OK.)
Butler, W. R., and Smith, R. D. (1989). Interrelationships between energy balance and postpartum reproductive function in dairy cattle. J. Dairy Sci. 72, 767–783.
| Interrelationships between energy balance and postpartum reproductive function in dairy cattle.Crossref | GoogleScholarGoogle Scholar | 1:STN:280:DyaL1M3jsVyhtQ%3D%3D&md5=ac9f7926b81b6f5a4ee1d6427b0b2323CAS | 2654227PubMed |
Byrne, A. T., Southgate, J., Brison, D. R., and Leese, H. J. (2002). Regulation of apoptosis in the bovine blastocyst by insulin and the insulin-like growth factor IGF superfamily. Mol. Reprod. Dev. 62, 489–495.
| Regulation of apoptosis in the bovine blastocyst by insulin and the insulin-like growth factor IGF superfamily.Crossref | GoogleScholarGoogle Scholar | 1:CAS:528:DC%2BD38Xlt1Klsrg%3D&md5=b0d2b6c76f1b0ac7aca3657c5db4e4caCAS | 12112582PubMed |
Cagnone, G., and Sirard, M. A. (2014). The impact of exposure to serum lipids during in vitro culture on the transcriptome of bovine blastocysts. Theriogenology 81, 712–722.e3.
| The impact of exposure to serum lipids during in vitro culture on the transcriptome of bovine blastocysts.Crossref | GoogleScholarGoogle Scholar | 1:CAS:528:DC%2BC2cXhtlSlsLw%3D&md5=0ac721c0bbee096dd22b24cbfef1d1ccCAS | 24439163PubMed |
Cagnone, G. L. M., Dufort, I., Vigneault, C., and Sirard, M. A. (2012). Differential gene expression profile in bovine blastocysts resulting from hyperglycemia exposure during early cleavage stages. Biol. Reprod. 86, 50.
| Differential gene expression profile in bovine blastocysts resulting from hyperglycemia exposure during early cleavage stages.Crossref | GoogleScholarGoogle Scholar |
Colton, S. A., Pieper, G. M., and Downs, S. M. (2002). Altered meiotic regulation in oocytes from diabetic mice. Biol. Reprod. 67, 220–231.
| Altered meiotic regulation in oocytes from diabetic mice.Crossref | GoogleScholarGoogle Scholar | 1:CAS:528:DC%2BD38XkvV2itb8%3D&md5=2b224f43932eb3d5e6b3601a9acf6b4eCAS | 12080021PubMed |
Eckel, R. H., Grundy, S. M., and Zimmet, P. Z. (2005). The metabolic syndrome. Lancet 365, 1415–1428.
| The metabolic syndrome.Crossref | GoogleScholarGoogle Scholar | 1:CAS:528:DC%2BD2MXjsVegtbg%3D&md5=1404c089aba4bf43e1330c321e3d5128CAS | 15836891PubMed |
Edgar, R., Domrachev, M., and Lash, A. E. (2002). Gene Expression Omnibus: NCBI gene expression and hybridization array data repository. Nucleic Acids Res. 30, 207–210.
| Gene Expression Omnibus: NCBI gene expression and hybridization array data repository.Crossref | GoogleScholarGoogle Scholar | 1:CAS:528:DC%2BD38Xht12kurs%3D&md5=c744ec5dcf54fb7714e661befbba232dCAS | 11752295PubMed |
Fleige, S., and Pfaffl, M. W. (2006). RNA integrity and the effect on the real-time qRT-PCR performance. Mol. Aspects Med. 27, 126–139.
| RNA integrity and the effect on the real-time qRT-PCR performance.Crossref | GoogleScholarGoogle Scholar | 1:CAS:528:DC%2BD28XisF2gsrg%3D&md5=252e294f19bab6bf3578e20dd0823d07CAS | 16469371PubMed |
Fleming, T. P., Lucas, E. S., Watkins, A. J., and Eckert, J. (2012). Adaptive responses of the embryo to maternal diet and consequences for post implantation development. Reprod. Fertil. Dev. 24, 35–44.
| Adaptive responses of the embryo to maternal diet and consequences for post implantation development.Crossref | GoogleScholarGoogle Scholar |
Fouladi-Nashta, A. A., and Campbell, K. H. S. (2006). Dissociation of oocyte nuclear and cytoplasmic maturation by the addition of insulin in cultured bovine antral follicles. Reproduction 131, 449–460.
| Dissociation of oocyte nuclear and cytoplasmic maturation by the addition of insulin in cultured bovine antral follicles.Crossref | GoogleScholarGoogle Scholar | 1:CAS:528:DC%2BD28Xjs12js7k%3D&md5=b82c2c9dd07f346534454f608b720fe7CAS | 16514188PubMed |
Freret, S., Grimard, B., Ponter, A., Joly, C., Ponsart, V., and Humblot, P. (2006). Reduction of body-weight gain enhances in vitro embryo production in overfed superovulated dairy heifers. Reproduction 131, 783–794.
| Reduction of body-weight gain enhances in vitro embryo production in overfed superovulated dairy heifers.Crossref | GoogleScholarGoogle Scholar | 1:CAS:528:DC%2BD28XltV2jt7o%3D&md5=5fc7a3c996786b56dd4df8d504a34804CAS | 16595729PubMed |
Garnsworthy, P. C., Fouladi-Nashta, A. A., Mann, G. E., Sinclair, K. D., and Webb, R. (2009). Effect of dietary-induced changes in plasma insulin concentrations during the early post partum period on pregnancy rate in dairy cows. Reproduction 137, 759–768.
| Effect of dietary-induced changes in plasma insulin concentrations during the early post partum period on pregnancy rate in dairy cows.Crossref | GoogleScholarGoogle Scholar | 1:CAS:528:DC%2BD1MXosl2nur4%3D&md5=e67243242035bca0a1a8d2a4fcb4c2dcCAS | 19129370PubMed |
Gilbert, I., Scantland, S., Sylvestre, E.-L., Dufort, I., Sirard, M.-A., and Robert, C. (2010). Providing a stable methodological basis for comparing transcript abundance of developing embryos using microarrays. Mol. Hum. Reprod. 16, 601–616.
| Providing a stable methodological basis for comparing transcript abundance of developing embryos using microarrays.Crossref | GoogleScholarGoogle Scholar | 1:CAS:528:DC%2BC3cXptlegt7Y%3D&md5=e48013a41c09cf4e262b1ebfc1dd38e6CAS | 20479066PubMed |
Gong, J. G., Lee, W. J., Garnsworthy, P. C., and Webb, R. (2002). Effect of dietary-induced increases in circulating insulin concentrations during the early postpartum period on reproductive function in dairy cows. Reproduction 123, 419–427.
| Effect of dietary-induced increases in circulating insulin concentrations during the early postpartum period on reproductive function in dairy cows.Crossref | GoogleScholarGoogle Scholar | 1:CAS:528:DC%2BD38Xit1Cls74%3D&md5=7bc921258a2b1842162da30bcc7a014cCAS | 11882019PubMed |
Gordon, I. R. (2003). ‘Laboratory Production of Cattle Embryos.’ 2nd edn. (CAB International, Cambridge University Press: Wallingford.)
Hayashi, I., Larner, J., and Sato, G. (1978). Hormonal growth control of cells in culture. In Vitro 14, 23–30.
| Hormonal growth control of cells in culture.Crossref | GoogleScholarGoogle Scholar | 1:CAS:528:DyaE1cXhtFGlsr0%3D&md5=40ede3b1f8f395d9dc40e6798c037bd3CAS | 624557PubMed |
Heerwagen, M. J. R., Miller, M. R., Barbour, L. A., and Friedman, J. E. (2010). Maternal obesity and fetal metabolic programming: a fertile epigenetic soil. Am. J. Physiol. Regul. Integr. Comp. Physiol. 299, R711–R722.
| Maternal obesity and fetal metabolic programming: a fertile epigenetic soil.Crossref | GoogleScholarGoogle Scholar | 1:CAS:528:DC%2BC3cXht1WgurvI&md5=529734f878f65fbf23976edb5dadb369CAS |
Herrler, A., Krusche, C. A., and Beier, H. M. (1998). Insulin and insulin-like growth factor-I promote rabbit blastocyst development and prevent apoptosis. Biol. Reprod. 59, 1302–1310.
| Insulin and insulin-like growth factor-I promote rabbit blastocyst development and prevent apoptosis.Crossref | GoogleScholarGoogle Scholar | 1:CAS:528:DyaK1cXnvVKku70%3D&md5=31504d499753c0a5f6d13bb3f17c08b1CAS | 9828171PubMed |
Hyttel, P., Fair, T., Callesen, H., and Greve, T. (1997). Oocyte growth, capacitation and final maturation in cattle. Theriogenology 47, 23–32.
| Oocyte growth, capacitation and final maturation in cattle.Crossref | GoogleScholarGoogle Scholar |
International Embryo Transfer Society (IETS) (2010). ‘Manual of the International Embryo Transfer Society.’ 4th edn. (IETS: Champaign, IL.)
Lam, J. K., Matsubara, S., Mihara, K., Zheng, X., Mooradian, A. D., and Wong, N. C. W. (2003). Insulin induction of apolipoprotein AI, role of Sp1. Biochemistry 42, 2680–2690.
| Insulin induction of apolipoprotein AI, role of Sp1.Crossref | GoogleScholarGoogle Scholar | 1:CAS:528:DC%2BD3sXhtVaktb4%3D&md5=459f1db65b53e9059fdf97f5d59a47efCAS | 12614163PubMed |
Landau, S., Braw-Tal, R., Kaimb, M., Borb, A., and Bruckental, I. (2000). Preovulatory follicular status and diet affect the insulin and glucose content of follicles in high-yielding dairy cows. Anim. Reprod. Sci. 64, 181–197.
| Preovulatory follicular status and diet affect the insulin and glucose content of follicles in high-yielding dairy cows.Crossref | GoogleScholarGoogle Scholar | 1:CAS:528:DC%2BD3cXovFWis7c%3D&md5=417b49d05967502ec764c8934070bb82CAS | 11121895PubMed |
Leese, H. J., Sturmey, R. G., Baumann, C. G., and McEvoy, T. G. (2007). Embryo viability and metabolism: obeying the quiet rules. Hum. Reprod. 22, 3047–3050.
| Embryo viability and metabolism: obeying the quiet rules.Crossref | GoogleScholarGoogle Scholar | 17956925PubMed |
Leibfried-Rutledge, M. L., Critser, E. S., Eyestone, W. H., Northey, D. L., and First, N. L. (1987). Development potential of bovine oocytes matured in vitro or in vivo. Biol. Reprod. 36, 376–383.
| Development potential of bovine oocytes matured in vitro or in vivo.Crossref | GoogleScholarGoogle Scholar | 1:STN:280:DyaL2s3hsVemsQ%3D%3D&md5=5a241cdb6afa8213cb9eb21d82351e3fCAS | 3580458PubMed |
Leroy, J. L. M. R., Rizos, D., Sturmey, R., Bossaert, P., Gutierrez-Adan, A., Van Hoeck, V., Valckx, S., and Bols, P. E. (2012). Intrafollicular conditions as a major link between maternal metabolism and oocyte quality: a focus on dairy cow fertility. Reprod. Fertil. Dev. 24, 1–12.
| Intrafollicular conditions as a major link between maternal metabolism and oocyte quality: a focus on dairy cow fertility.Crossref | GoogleScholarGoogle Scholar |
Lewis, A. M., Kaye, P. L., Lising, R., and Cameron, R. D. (1992). Stimulation of protein synthesis and expansion of pig blastocysts by insulin in vitro. Reprod. Fertil. Dev. 4, 119–123.
| Stimulation of protein synthesis and expansion of pig blastocysts by insulin in vitro.Crossref | GoogleScholarGoogle Scholar | 1:CAS:528:DyaK38XlsVeqsL4%3D&md5=b4c9b329e2cf5a39885e670c9413adc6CAS | 1585007PubMed |
Lindner, G. M., and Wright, R. W. (1983). Bovine embryo morphology and evaluation. Theriogenology 20, 407–416.
| Bovine embryo morphology and evaluation.Crossref | GoogleScholarGoogle Scholar | 1:STN:280:DC%2BD283pvVKgsg%3D%3D&md5=91876147b11b0a3613a4f81549d84ad6CAS | 16725857PubMed |
Lonergan, P., Khatir, H., Piumi, F., Rieger, D., Humblot, P., and Boland, M. P. (1999). Effect of time interval from insemination to first cleavage on the developmental characteristics, sex and pregnancy rates following transfer of bovine preimplantation embryos. J. Reprod. Fertil. 117, 159–167.
| Effect of time interval from insemination to first cleavage on the developmental characteristics, sex and pregnancy rates following transfer of bovine preimplantation embryos.Crossref | GoogleScholarGoogle Scholar | 1:CAS:528:DyaK1MXmtlaltLo%3D&md5=a386395cd34ae93f9a5d3c8653f8a7e9CAS | 10645257PubMed |
Lucy, M. (2006). Mechanisms linking growth hormone, insulin and reproduction: lessons from the postpartum dairy cow. Cattle Pract. 14, 23–27.
Matsui, M., Takahashi, Y., Hishinuma, M., and Kanagawa, H. (1995). Stimulatory effects of insulin on the development of bovine embryos fertilized in vitro. J. Vet. Med. Sci. 57, 331–336.
| Stimulatory effects of insulin on the development of bovine embryos fertilized in vitro.Crossref | GoogleScholarGoogle Scholar | 1:CAS:528:DyaK2MXmt1Gnurc%3D&md5=bc950c3fac97f9b2955e655405771d34CAS | 7492656PubMed |
Matsui, M., Takahashi, Y., Hishinuma, M., and Kanagawa, H. (1997). Stimulation of the development of bovine embryos by insulin and insulin-like growth factor-I IGF-I is mediated through the IGF-I receptor. Theriogenology 48, 605–616.
| Stimulation of the development of bovine embryos by insulin and insulin-like growth factor-I IGF-I is mediated through the IGF-I receptor.Crossref | GoogleScholarGoogle Scholar | 1:CAS:528:DyaK2sXmt1WhsL8%3D&md5=10981eeb672ee88c2a65358dafb12ec2CAS | 16728156PubMed |
Meijer, H. A., Van De Paver, S. A., Stroband, H. W. J., and Boerjan, M. L. (2000). Expression of the organizer specific homeobox gene Goosecoid gsc in porcine embryos. Mol. Reprod. Dev. 55, 1–7.
| Expression of the organizer specific homeobox gene Goosecoid gsc in porcine embryos.Crossref | GoogleScholarGoogle Scholar | 1:CAS:528:DyaK1MXnvFynsbY%3D&md5=50eee08d7f21ee01f7759a847f80ff3cCAS | 10602267PubMed |
Mihalik, J., Rehak, P., and Koppel, J. (2000). The influence of insulin on the in vitro development of mouse and bovine embryos. Physiol. Res. 49, 347–354.
| 1:CAS:528:DC%2BD3cXmsV2ksbY%3D&md5=1aaf66d2f5ccd87ce3588b9c9180ebdaCAS | 11043922PubMed |
Mooradian, A. D., Haas, M. J., and Wong, N. C. W. (2004). Transcriptional control of apolipoprotein A-I gene expression in diabetes. Diabetes 53, 513–520.
| Transcriptional control of apolipoprotein A-I gene expression in diabetes.Crossref | GoogleScholarGoogle Scholar | 1:CAS:528:DC%2BD2cXhvFeltbk%3D&md5=83590d4f7ae3e548763af30f1c18a4feCAS | 14988232PubMed |
Murao, K., Wada, Y., Nakamura, T., Taylor, A. H., Mooradian, A. D., and Wong, N. C. W. (1998). Effects of glucose and insulin on rat apolipoprotein A-I gene expression. J. Biol. Chem. 273, 18 959–18 965.
| Effects of glucose and insulin on rat apolipoprotein A-I gene expression.Crossref | GoogleScholarGoogle Scholar | 1:CAS:528:DyaK1cXltFGrtrY%3D&md5=16fbcff3a3d440ca91dc8ee61ff8ad20CAS |
Nishioka, N., Yamamoto, S., Kiyonari, H., Sato, H., Sawada, A., Ota, M., Nakao, K., and Sasaki, H. (2008). Tead4 is required for specification of trophectoderm in pre-implantation mouse embryos. Mech. Dev. 125, 270–283.
| Tead4 is required for specification of trophectoderm in pre-implantation mouse embryos.Crossref | GoogleScholarGoogle Scholar | 1:CAS:528:DC%2BD1cXhslGjt78%3D&md5=9987157b4c3be1bcbff2731201e950a6CAS | 18083014PubMed |
O’Callaghan, D., and Boland, M. P. (1999). Nutritional effects on ovulation, embryo development and the establishment of pregnancy in ruminants. Anim. Sci. 68, 299–314.
Pasquali, R., Patton, L., and Gambineri, A. (2007). Obesity and infertility. Curr. Opin. Endocrinol. Diabetes Obes. 14, 482–487.
| Obesity and infertility.Crossref | GoogleScholarGoogle Scholar | 17982356PubMed |
Pinborg, A., Gaarslev, C., and Hougaard, C. O. (2011). Influence of female bodyweight on IVF outcome: a longitudinal multicentre cohort study of 487 infertile couples. Reprod. Biomed. Online 23, 490–499.
| Influence of female bodyweight on IVF outcome: a longitudinal multicentre cohort study of 487 infertile couples.Crossref | GoogleScholarGoogle Scholar | 1:STN:280:DC%2BC3Mfpt1Sguw%3D%3D&md5=f37b33efa85f948e1f092b34750b20cdCAS | 21856228PubMed |
Plante, L., Plante, C., Shepard, D. L., and King, W. A. (1994). Cleavage and 3H-uridine incorporation in bovine embryos of high in vitro developmental potential. Mol. Reprod. Dev. 39, 375–383.
| Cleavage and 3H-uridine incorporation in bovine embryos of high in vitro developmental potential.Crossref | GoogleScholarGoogle Scholar | 1:CAS:528:DyaK2MXisFWjtro%3D&md5=970607b6ce75706669263fca25de545dCAS | 7893486PubMed |
Purcell, S. H., Chi, M. M., and Moley, K. H. (2012). Insulin-stimulated glucose uptake occurs in specialized cells within the cumulus oocyte complex. Endocrinology 153, 2444–2454.
| Insulin-stimulated glucose uptake occurs in specialized cells within the cumulus oocyte complex.Crossref | GoogleScholarGoogle Scholar | 1:CAS:528:DC%2BC38XmsVKnu7g%3D&md5=251ceabd4a76652c852e7481a79c11baCAS | 22408172PubMed |
Rao, L. V., Wikarczuk, M. L., and Heyner, S. (1990). Functional roles of insulin and insulin-like growth factors in preimplantation mouse embryo development. In Vitro Cell. Dev. Biol. 26, 1043–1048.
| Functional roles of insulin and insulin-like growth factors in preimplantation mouse embryo development.Crossref | GoogleScholarGoogle Scholar | 1:CAS:528:DyaK3MXksVagt70%3D&md5=7f73f4b4d3f72e3ff5d35843a3450b39CAS | 1703523PubMed |
Reik, W., Dean, W., and Walter, J. (2001). Epigenetic reprogramming in mammalian development. Science 293, 1089–1093.
| 1:CAS:528:DC%2BD3MXmtVWltL8%3D&md5=6009e5d8f2eaa405f3e5574d9599590dCAS | 11498579PubMed |
Rekik, W., Dufort, I., and Sirard, M.-A. (2011). Analysis of the gene expression pattern of bovine blastocysts at three stages of development. Mol. Reprod. Dev. 78, 226–240.
| Analysis of the gene expression pattern of bovine blastocysts at three stages of development.Crossref | GoogleScholarGoogle Scholar | 1:CAS:528:DC%2BC3MXkvFaju7o%3D&md5=e90f2dc940583c37a36fee0ddb0eccc2CAS | 21509852PubMed |
Richards, J. S. (2005). Ovulation: new factors that prepare the oocyte for fertilization. Mol. Cell. Endocrinol. 234, 75–79.
| Ovulation: new factors that prepare the oocyte for fertilization.Crossref | GoogleScholarGoogle Scholar | 1:CAS:528:DC%2BD2MXjt1SqtLk%3D&md5=637403b83f62f99b5932e16a6ffe0a41CAS | 15836955PubMed |
Rizos, D., Ward, F., Duffy, P., Boland, M. P., and Lonergan, P. (2002). Consequences of bovine oocyte maturation, fertilization or early embryo development in vitro versus in vivo: implications for blastocyst yield and blastocyst quality. Mol. Reprod. Dev. 61, 234–248.
| Consequences of bovine oocyte maturation, fertilization or early embryo development in vitro versus in vivo: implications for blastocyst yield and blastocyst quality.Crossref | GoogleScholarGoogle Scholar | 1:CAS:528:DC%2BD38Xlt1Giug%3D%3D&md5=fd530554a4e416cc604ed66ebc4922a4CAS | 11803560PubMed |
Robert, C., Nieminen, J., Dufort, I., Gagné, D., Grant, J. R., Cagnone, G., Plourde, D., Nivet, A.-L., Fournier, É., Paquet, É., Blazejczyk, M., Rigault, P., Juge, N., and Sirard, M.-A. (2011). Combining resources to obtain a comprehensive survey of the bovine embryo transcriptome through deep sequencing and microarrays. Mol. Reprod. Dev. 78, 651–664.
| Combining resources to obtain a comprehensive survey of the bovine embryo transcriptome through deep sequencing and microarrays.Crossref | GoogleScholarGoogle Scholar | 1:CAS:528:DC%2BC3MXhtFGns7vK&md5=75c686b8c32e9ef12dc16ac2d4268e37CAS | 21812063PubMed |
Robker, R. L., Akison, L. K., Bennett, B. D., Thrupp, P. N., Chura, L. R., Russell, D. L., Lane, M., and Norman, R. J. (2009). Obese women exhibit differences in ovarian metabolites, hormones, and gene expression compared with moderate-weight women. J. Clin. Endocrinol. Metab. 94, 1533–1540.
| Obese women exhibit differences in ovarian metabolites, hormones, and gene expression compared with moderate-weight women.Crossref | GoogleScholarGoogle Scholar | 1:CAS:528:DC%2BD1MXlvVCqtrw%3D&md5=760ea5af15a944a7834ccc057f620791CAS | 19223519PubMed |
Schultz, G. A., Hogan, A., Watson, A. J., Smith, R. M., and Heyner, S. (1992). Insulin, insulin-like growth factors and glucose transporters: temporal patterns of gene expression in early murine and bovine embryos. Reprod. Fertil. Dev. 4, 361–371.
| Insulin, insulin-like growth factors and glucose transporters: temporal patterns of gene expression in early murine and bovine embryos.Crossref | GoogleScholarGoogle Scholar | 1:CAS:528:DyaK3sXlt1yhsA%3D%3D&md5=ab6d740b608083d6a413048686fea789CAS | 1461988PubMed |
Shimizu, T., Murayama, C., Sudo, N., Kawashima, C., Tetsuka, M., and Miyamoto, A. (2008). Involvement of insulin and growth hormone GH during follicular development in the bovine ovary. Anim. Reprod. Sci. 106, 143–152.
| Involvement of insulin and growth hormone GH during follicular development in the bovine ovary.Crossref | GoogleScholarGoogle Scholar | 1:CAS:528:DC%2BD1cXktlCqsbk%3D&md5=169baf43c7be1cfdf56b3cd8c7579918CAS | 17507188PubMed |
Smyth, G. K. (2004). Linear models and empirical bayes methods for assessing differential expression in microarray experiments. Stat. Appl. Genet. Mol. Biol. 3, 1–25.
| Linear models and empirical bayes methods for assessing differential expression in microarray experiments.Crossref | GoogleScholarGoogle Scholar |
Spicer, L. J., and Echternkamp, S. E. (1995). The ovarian insulin and insulin-like growth factor system with an emphasis on domestic animals. Domest. Anim. Endocrinol. 12, 223–245.
| The ovarian insulin and insulin-like growth factor system with an emphasis on domestic animals.Crossref | GoogleScholarGoogle Scholar | 1:CAS:528:DyaK2MXnt1Ort78%3D&md5=bf0f9ac8cb17d219fcc06b2c127d443eCAS | 7587167PubMed |
Sutton-McDowall, M. L., Gilchrist, R. B., and Thompson, J. G. (2010). The pivotal role of glucose metabolism in determining oocyte developmental competence. Reproduction 139, 685–695.
| The pivotal role of glucose metabolism in determining oocyte developmental competence.Crossref | GoogleScholarGoogle Scholar | 1:CAS:528:DC%2BC3cXltFajtr0%3D&md5=c465b83355bc254d53da580f2c639bcbCAS | 20089664PubMed |
Valckx, S. D., De Pauw, I., De Neubourg, D., Inion, I., Berth, M., Fransen, E., Bols, P. E., and Leroy, J. L. M. R. (2012). BMI-related metabolic composition of the follicular fluid of women undergoing assisted reproductive treatment and the consequences for oocyte and embryo quality. Hum. Reprod. 27, 3531–3539.
| BMI-related metabolic composition of the follicular fluid of women undergoing assisted reproductive treatment and the consequences for oocyte and embryo quality.Crossref | GoogleScholarGoogle Scholar | 1:CAS:528:DC%2BC38XhslKrsLrL&md5=00dad46ba8011e880d6cd44e25ec241fCAS | 23019302PubMed |
Vallée, M., Dufort, I., Desrosiers, S., Labbe, A., Gravel, C., Gilbert, I., Robert, C., and Sirard, M.-A. (2009). Revealing the bovine embryo transcript profiles during early in vivo embryonic development. Reproduction 138, 95–105.
| Revealing the bovine embryo transcript profiles during early in vivo embryonic development.Crossref | GoogleScholarGoogle Scholar | 19383715PubMed |
Van Gelder, R. N., Von Zastrow, M. E., Yool, A., Dement, W. C., Barchas, J. D., and Eberwine, J. H. (1990). Biochemistry amplified RNA synthesized from limited quantities of heterogeneous cDNA. Proc. Natl Acad. Sci. USA 87, 1663–1667.
| Biochemistry amplified RNA synthesized from limited quantities of heterogeneous cDNA.Crossref | GoogleScholarGoogle Scholar | 1:CAS:528:DyaK3cXhsFejsLg%3D&md5=1f99026d1617cc93b6031ed89837d86bCAS | 1689846PubMed |
Van Hoeck, V., Sturmey, R. G., Bermejo-Alvarez, P., Rizos, D., Gutierrez-Adan, A., Leese, H. J., Bols, P. E. J., and Leroy, J. L. M. R. (2011). Elevated non-esterified fatty acid concentrations during bovine oocyte maturation compromise early embryo physiology. PLoS One 6, e23183.
| Elevated non-esterified fatty acid concentrations during bovine oocyte maturation compromise early embryo physiology.Crossref | GoogleScholarGoogle Scholar | 1:CAS:528:DC%2BC3MXhtFKmsLjM&md5=a0b552d20a6393da836bc87c594fdd9eCAS | 21858021PubMed |
Van Hoeck, V., Rizos, D., Gutierrez-Adan, A., Pintelon, I., Jorssen, E., Dufort, I., Sirard, M.-A., Verlaet, A., Hermans, N., Bols, P. E. J., and Leroy, J. L. M. R. (2015). Interaction between differential gene expression profile and phenotype in bovine blastocysts originating from oocytes exposed to elevated non-esterified fatty acid concentrations. Reprod. Fertil. Dev. 27, 372–384.
| Interaction between differential gene expression profile and phenotype in bovine blastocysts originating from oocytes exposed to elevated non-esterified fatty acid concentrations.Crossref | GoogleScholarGoogle Scholar | 1:CAS:528:DC%2BC2MXhslegtrc%3D&md5=c2983d160738a33eb399550736a125d2CAS | 24360349PubMed |
van Montfoort, A. P. A., Plösch, T., Hoek, A., and Tietge, U. J. F. (2014). Impact of maternal cholesterol metabolism on ovarian follicle development and fertility. J. Reprod. Immunol. 104–105, 32–36.
| Impact of maternal cholesterol metabolism on ovarian follicle development and fertility.Crossref | GoogleScholarGoogle Scholar |
Vigneault, C., Gravel, C., Vallée, M., McGraw, S., and Sirard, M. A. (2009). Unveiling the bovine embryo transcriptome during the maternal-to-embryonic transition. Reproduction 137, 245–257.
| Unveiling the bovine embryo transcriptome during the maternal-to-embryonic transition.Crossref | GoogleScholarGoogle Scholar | 1:CAS:528:DC%2BD1MXovV2ksL8%3D&md5=a3093644ae8b6a7abc5dce51b47ba0fbCAS | 18987256PubMed |
Ward, F., Rizos, D., Corridan, D., Quinn, K., Boland, M., and Lonergan, P. (2001). Paternal influence on the time of the first embryonic cleavage post insemination and the implications for subsequent bovine embryos development in vitro and fertility in vivo. Mol. Reprod. Dev. 60, 47–55.
| Paternal influence on the time of the first embryonic cleavage post insemination and the implications for subsequent bovine embryos development in vitro and fertility in vivo.Crossref | GoogleScholarGoogle Scholar | 1:CAS:528:DC%2BD3MXlvFWisrY%3D&md5=a664c32c5e6627ab0c055324be82a358CAS | 11550267PubMed |
Ward, F., Enright, B., Rizos, D., Boland, M., and Lonergan, P. (2002). Optimization of in vitro bovine embryo production: effect of duration of maturation, length of gamete co-incubation, sperm concentration and sire. Theriogenology 57, 2105–2117.
| Optimization of in vitro bovine embryo production: effect of duration of maturation, length of gamete co-incubation, sperm concentration and sire.Crossref | GoogleScholarGoogle Scholar | 12066869PubMed |
Wu, L. L. Y., Norman, R. J., and Robker, R. L. (2012). The impact of obesity on oocytes: evidence for lipotoxicity mechanisms. Reprod. Fertil. Dev. 24, 29–34.
| The impact of obesity on oocytes: evidence for lipotoxicity mechanisms.Crossref | GoogleScholarGoogle Scholar |
Yadav, B. R., King, W. A., and Betteridge, K. J. (1993). Relationships between the completion of first cleavage and the chromosomal complement, sex, and developmental rates of bovine embryos generated in vitro. Mol. Reprod. Dev. 36, 434–439.
| Relationships between the completion of first cleavage and the chromosomal complement, sex, and developmental rates of bovine embryos generated in vitro.Crossref | GoogleScholarGoogle Scholar | 1:STN:280:DyaK2c7jslCmtA%3D%3D&md5=6153a7b328d7a647a3d5404ea506fe68CAS | 8305205PubMed |
Zhang, X., and Armstrong, D. T. (1990). Presence of amino acids and insulin in a chemically defined medium improves development of 8-cell rat embryos in vitro and subsequent implantation in vivo. Biol. Reprod. 42, 662–668.
| Presence of amino acids and insulin in a chemically defined medium improves development of 8-cell rat embryos in vitro and subsequent implantation in vivo.Crossref | GoogleScholarGoogle Scholar | 1:CAS:528:DyaK3cXktFyis7Y%3D&md5=558db0a5d014b9470d1b687c9b386e90CAS | 2189503PubMed |
Zhang, L., Blakewood, E. G., Denniston, R. S., and Godke, R. A. (1991). The effect of insulin on maturation and development of in vitro-fertilized bovine oocytes. Theriogenology 35, 301.
| The effect of insulin on maturation and development of in vitro-fertilized bovine oocytes.Crossref | GoogleScholarGoogle Scholar |