

HIV service capacity: identifying current and future areas of clinical shortage
Kylie-Ann Mallitt A , James Jansson A , Handan Wand A , Levinia Crooks B and David P. Wilson A CA The Kirby Institute, University of New South Wales, Sydney, NSW 2052, Australia.
B The Australasian Society for HIV Medicine, Sydney, NSW 2010, Australia.
C Corresponding author. Email: dwilson@kirby.unsw.edu.au
Sexual Health 11(1) 17-23 https://doi.org/10.1071/SH13151
Submitted: 27 September 2013 Accepted: 14 October 2013 Published: 29 November 2013
Abstract
Background: The capacity of HIV services to meet the clinical needs of people living with HIV (PLHIV) has not been evaluated. Similarly, whether HIV services are positioned to respond to increases in patient demand outside metropolitan centres over the next decade is unknown. Methods: A novel statistical methodology was used to estimate HIV clinical service capacity in Australia. A survey of HIV services was conducted. Geostatistical analysis was used to identify significant regions of clinical service undersupply relative to the estimated number of PLHIV in 2010 and 2020. Results: In 2010, an estimated 2074 PLHIV (9.7% of all PLHIV) resided in regions more than 15 km from a clinical service provider; 485 PLHIV (2.3% of all PLHIV) live >50 km away. By 2020, this is estimated to rise to 3419 and 807 (11.5% and 2.7% of estimated PLHIV) for 15 km and 50 km, respectively. To meet this demand, the establishment of new HIV services are required in the areas of greatest HIV clinical undersupply. In 2010, these are northern Sydney and western New South Wales, the Queensland mid-north coast and the outer suburbs of Melbourne. At the current estimated rate of increase in PLHIV, areas that will become critically undersupplied by 2020 include south-west Sydney, the outer suburbs of Brisbane and Western Australia. Conclusions: This study provides a quantitative assessment using modern statistical techniques to identify HIV clinical service gaps that is applicable in developed and nondeveloped settings. Training of new HIV clinicians should be directed towards undersupplied areas.
Additional keywords: case management, clinical expertise, service planning, undersupply.
Background
Globally, the annual number of new HIV infections is declining, but the number of people living with HIV (PLHIV) is increasing.1 Timely use of effective antiretroviral therapy has resulted in a normal lifespan for PLHIV.2 In developed countries, the majority of PLHIV reside in a geographical location close to the concentration of clinical services.3 However, in the general population, there are significant numbers of people moving from metropolitan to rural or coastal areas as they age due to perceived advantages in lifestyle and affordability.4,5 It is expected that PLHIV will follow this trend, given stable long-term treatment regimens and increased survival, which has led to a shift from inpatient to ambulatory care.6
Generally, the clinical workforce with expertise in HIV management is undersupplied relative to the estimated number of PLHIV.7 This is particularly evident within developing countries and also in rural areas of developed countries.6 There are fewer clinicians in non-metropolitan areas with experience in complex HIV case management relative to cities.8 The ability of PLHIV to access appropriate treatment during the acute and chronic phases of disease depends on accessibility, the level of clinical expertise and the capacity of the service (appropriate numbers of clinicians and opening hours).3,6,9,10
Provision of HIV clinical services, given the aging and increased geographical spread of PLHIV, is problematic.6 Access to timely, high-quality services for diagnosis, prescription of antiretroviral therapy and the treatment of comorbidities affects long-term prognosis.11 In order to assess current and future HIV clinical service needs, accurate estimates are required of the number of PLHIV and the capacity of existing clinical services.6
The size of the clinical workforce is generally estimated from records of the number of registered clinicians, with or without specific HIV qualifications.12 However, there is an increasingly multidisciplinary approach to HIV clinical management, with clinicians working part-time and at multiple clinical locations, and engaging in ‘task-shifting’ of duties to lesser qualified or experienced personnel in areas of workforce shortage.13,14 This introduces a challenge to obtaining accurate estimates of the size of the broader HIV clinical workforce.
The aim of this study is to identify current and future areas of workforce shortage in Australia, implementing a novel method to estimate HIV clinical service capacity. We estimate the number of full-time equivalent (FTE) clinicians with expertise in HIV management by geographical region in 2010 and 2020 through the design and implementation of a new survey. These data are compared with estimates of the number of PLHIV during the same period from another study.15 An application of geostatistical analysis methods are then used to identify areas that are significantly clinically undersupplied with HIV clinicians relative to the number of PLHIV. These data are critical to identify the locations of greatest supply–demand deficit and to inform locations where targeted training in HIV management for clinicians will be of most benefit.
Methods
In 2011, a seven-question survey was developed and sent to all hospital departments and sexual health services in Australia; and to community general clinicians that were registered with the Australasian Society for HIV Medicine or were working in formal HIV shared-care arrangements. Data was collected on the number of FTE doctors available to treat patients at each clinical location; the proportion of PLHIV among the case mix, the level of HIV expertise among staff and the capacity to take on additional PLHIV. Descriptive results are presented as frequencies and percentages. In the case of nonresponse, missing data on the number of hours worked by clinicians at a clinical location was imputed using hot-deck imputation.16 In this method, missing data are replaced with observed data values from similar services, based on location (state or territory) and service type.
Estimates of the number of PLHIV in each statistical region of Australia in 2010 and 2020 were obtained from a separate study conducted by the authors.15 Briefly, an agent-based simulation model was linked to the Australian National Registry of HIV diagnoses. In combination with data on internal migration patterns from the Australian Bureau of Statistics and Australian population mortality rates, the size of the population of PLHIV in Australia was estimated.
HIV clinical service capacity in Australia was estimated by statistical region (66 regions in total), as defined by the Australian Bureau of Statistics. The analysis was conducted in two phases: (i) a descriptive analysis where the number of clinicians was compared with the number of PLHIV by region and (ii) a geostatistical analysis to identify ‘cold-spots’ across the country where HIV clinical service capacity was significantly undersupplied relative to the number of PLHIV. HIV clinical service capacity was estimated for (a) 2010, assuming the current number of model-estimated PLHIV and reported clinicians by geographical location; and (b) 2020, assuming a model-estimated rise in the number of PLHIV and the current number of reported clinicians. The number of clinicians in Australia with expertise in HIV is not increasing.17
The estimated proportion of PLHIV who live within a 15-km and 50-km radius of a HIV clinical service provider was calculated using spatial statistics in ArcGIS ver. 9.3 (Environmental Systems Research Institute Inc., Redlands, CA, USA). The 15-km distance was chosen to capture the majority of PLHIV, who live within inner-cities. However, a 50-km distance was also chosen to represent a country-wide scale.
The number of PLHIV was divided by the number of FTE clinicians to create an HIV service ratio for each statistical region, which reflects the number of PLHIV in a region per FTE clinician available with expertise in HIV case management. Regions were ranked based on thresholds of the HIV service ratio. Regions were considered ‘well supplied’ if they had less than 100 PLHIV per FTE doctor and at least 1 doctor; ‘adequately supplied’ if they had 100–499 PLHIV per FTE doctor, or no doctor and <100 PLHIV; ‘undersupplied’ if they had 500–999 PLHIV per FTE doctor, or no doctor and 100–499 PLHIV; or ‘critically undersupplied’ if they had at least 1000 PLHIV per FTE doctor, or no doctor and 500–999 PLHIV. Self-reported data of the capacity of a clinical location to take on additional PLHIV was used to inform these thresholds. Generally, among well supplied, adequately supplied, undersupplied and critically undersupplied regions, all, most, few and none of the services in the region reported being able to take on at least 25% more PLHIV, respectively. For regions that were categorised as being undersupplied or critically undersupplied, the HIV service ratio was used to calculate the number of FTE clinicians that would be needed in order to achieve an adequately supplied level.
For the geostatistical analysis, the latitude and longitude of each clinical location was obtained based on street address information published by Australasian Society for HIV Medicine.18 Spatial Scan Statistics (SaTScan ver. 8.0, SaTScan, Boston, MA, USA) was used to detect ‘cold-spots’ where the number of FTE clinicians is significantly undersupplied relative to the number of PLHIV. This methodology is described in detail elsewhere.19 Briefly, clustering algorithms were used to identify areas of clinical undersupply by allowing circular windows of various sizes to range continuously across the study region. At each location, the number of clinicians relative to PLHIV inside the window was compared with the ratio of clinicians to PLHIV outside the region. A statistical count-based (Poisson) model was used, where the number of FTE hours worked by clinicians in each region was scaled to a whole number that can be considered a ‘count’ of clinicians. For each circle, the likelihood was calculated for the alternative hypothesis that there is a decreased number of clinicians relative to the number of PLHIV inside the circle against the null hypothesis that the HIV clinical service capacity is the same inside the circle as outside. A cold-spot (or cluster) was detected within a defined geographical area if the area has a disproportionate lack of clinicians when compared with neighbouring areas under study. Potential clusters were rank-ordered according to the likelihood of clinical undersupply. A significant P-value indicates that HIV clinical capacity in this region is significantly lower than in other study areas.
This study was approved by the University of NSW Human Research Ethics Committee (reference number 2010–7-51).
Results
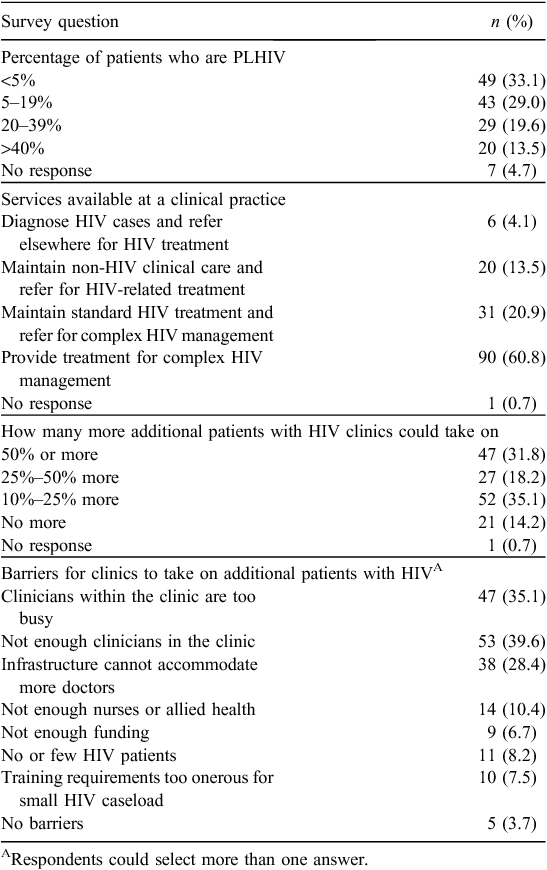
The survey response rate was 54.8% (148 out of 270). The response was highest for hospital specialists and community sexual health clinicians (63.3% and 65.8% respectively), and was lowest for community general clinicians without HIV qualifications (25.9%). Table 1 summarises survey data for each clinical location. Most services had fewer than 5% of their case mix that were PLHIV (33.1%); 13.5% had greater than 40% that were PLHIV. The majority of services provided management of complex HIV cases (60.8%); however, 4.1% reported that they referred patients elsewhere after diagnosis. Although 14.2% of services did not have the capacity to take on any additional PLHIV, 31.8% of services could take on 50% more PLHIV. The main barriers to taking on additional PLHIV were clinicians being too busy and inadequate infrastructure.
|
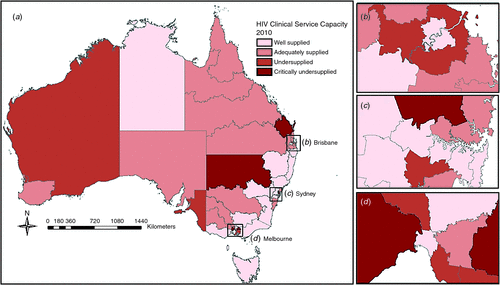
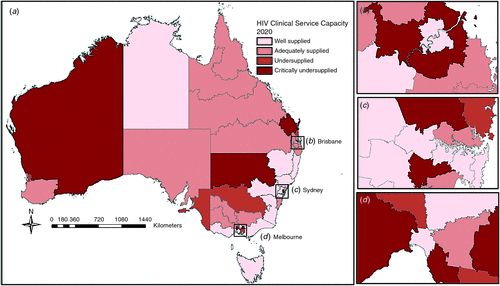
In 2010, an estimated 2074 PLHIV resided in statistical local areas more than 15 km from a HIV service (9.7% of all PLHIV) and 485 PLHIV resided in statistical local areas more than 50 km from a HIV service (2.3% of all PLHIV). By 2020, this is estimated to rise to 3419 (11.5% of estimated PLHIV in 2020) and 807 (2.7% of all PLHIV in 2020) for 15 km and 50 km, respectively. In 2010, the inner suburbs of Melbourne had approximately three times the number of PLHIV per FTE clinician than the inner suburbs of Sydney.
Areas undersupplied and critically undersupplied with HIV clinicians are listed in Table 2, with the number of additional FTE clinicians needed achieve adequate supply. Areas of greatest HIV clinical undersupply in 2010 are central northern Sydney and western New South Wales, the Queensland mid-north coast and the outer suburbs of Melbourne. At the current estimated rate of increase in PLHIV, additional areas that will become critically undersupplied by 2020 include south-west Sydney, the outer suburbs of Brisbane and Western Australia (particularly in mining regions to the south and west of Perth). Areas of undersupply for 2010 and 2020 are displayed in Figs 1 and 2 respectively. The number of additional FTE clinicians that would need to be trained in order to bring critically undersupplied regions to an adequate level ranges from 0.6 in Wide-Bay Burnett (2010) to 5.2 in outer western Melbourne (2020).

|
|
|
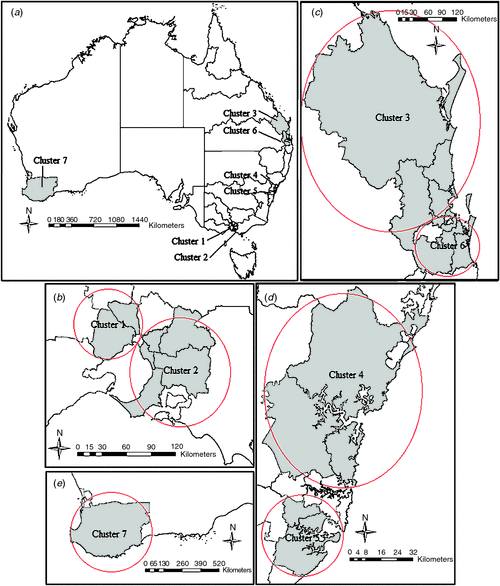
Geostatistical analysis confirmed statistically significant cold-spots in the main areas that were identified as being undersupplied with HIV clinicians in the descriptive analysis. Seven significant clusters were identified (each with P < 0.0001) as follows: (1) south-east Melbourne (inner eastern, southern, outer eastern, south-eastern and Mornington Peninsula), (2) north-west Melbourne (outer western, north-western), (3) outer Brisbane (city outer ring, north Brisbane Statistical Division (BSD) balance, Sunshine Coast, West Moreton, Wide Bay-Burnett), (4) north of Sydney (central northern Sydney, northern beaches, Gosford-Wyong), (5) south Sydney (St George-Sutherland, Canterbury-Bankstown), (6) south-east Queensland (Gold Coast, south and east BSD balance) and (7) Western Australia (lower western). Some clusters are concentrated, such as St George and Canterbury-Bankstown, with a geographical radius of 15.7 km. Other clusters are more generalised, such as outer Brisbane, with a radius of 244.6 km. The average cluster size was 81.7 km. These clusters are displayed in Fig. 3 for the year 2010. The results of the geostatistical analysis for the year 2020 did not differ from those for 2010.
|
Discussion
In this study, we have demonstrated a novel application to identify locations where HIV clinical expertise is undersupplied. In Australia, it is estimated that in 2010, 12 regions were undersupplied (18.1%) and five regions were critically undersupplied (7.6%). By 2020, we estimate that this will shift to 11 regions that are undersupplied (16.7%) and nine regions that are critically undersupplied (13.6%). These areas correspond to seven statistically significant ‘cold-spots’ of HIV clinical service deficit identified using geostatistical analysis. To our knowledge, this is the first study to apply this method to clinical service planning.
These results are consistent with current knowledge of HIV in Australia. The concentration of PLHIV and of HIV-specific clinical services is situated in inner-city Sydney and Melbourne. Clusters of clinical undersupply in the outer suburbs of Sydney and Melbourne reflect the natural spread of individuals in a mature epidemic.6 Driving forces behind this geographical shift are likely to be the aging population of PLHIV and decreased housing affordability. As the population of PLHIV reaches retirement age, increased clinical expertise will be required to treat age-related comorbidities in the context of HIV infection.6 A significant challenge for HIV service planning will be to not only maintain HIV clinical expertise in regional areas, but also to increase the ability to manage complex HIV treatment and comorbidities in these locations.
Across all regions in this study, we estimated that there were 343 FTE clinicians with training in HIV management. The number of additional FTE clinicians that would need to be trained in order to bring all regions to an adequate level of supply is 22 in 2010 and 38 by 2020. This corresponds to a required increase of 6.4% in 2010 and 11.1% by 2020. Much of the required increase in HIV service capacity is located in areas which are not serviced by major hospitals or sexual health services. In regional and remote areas, many PLHIV are required to travel large distances to access HIV services. Most existing clinical locations in this study indicated that they had the capacity to take on additional PLHIV as patients (85.1%). However, most services also reported that there existed barriers to treating additional PLHIV, such as a lack of clinicians and infrastructure.
Determining priority areas for action to improve HIV clinical service capacity is challenging.20 In the Australian context, regional and remote areas should be prioritised for increased HIV clinical service training over outer metropolitan areas. Even though there are fewer PLHIV in these regional and remote regions than in outer metropolitan areas, the areas that have the highest capacity to benefit from increased service capacity are regional and remote areas with increasing populations of PLHIV. Alternative models of care, with increased training for shared-care clinicians and sexual health nurses outside of metropolitan areas, are likely to be the most appropriate model in some cases.21
To our knowledge, this is the first study to estimate country-wide HIV clinical service capacity, taking into account small-scale geographical differences and the number of hours worked by clinicians. However, there are some limitations to the study. The overall response rate was 54.8% and imputation was used to estimate the number of hours worked by clinicians in these cases. Imputation was essential in this study to differentiate locations were there were no clinical services from locations where there were clinical services that did not respond to our survey. However, the large proportion of imputed results may lead to bias. Additionally, this study is subject to limitations in the estimates of the number of PLHIV. The model used to generate these estimates is based on the movement patterns of the general Australian population, which may not accurately reflect the movement of the population of PLHIV.
Conclusions
In this study, we utilise a novel methodology to identify areas of HIV clinical undersupply in a developed setting. Using this method in Australia, we identified seven geographical clusters that are significantly undersupplied with HIV doctors relative to the number of PLHIV. Training of clinicians in HIV case management and shared-care clinicians should be directed towards these areas, particularly locations in rural and remote areas.
Conflicts of interest
None declared.
Acknowledgements
The authors acknowledge funding from the Australian Government Department of Health and Ageing, and grant numbers FT0991990 and DP1093026 from the Australian Research Council. The researchers are independent from the source of funding. The views expressed in this publication do not necessarily represent the position of the Australian Government. The Kirby Institute is affiliated with the Faculty of Medicine, University of New South Wales.
References
[1] World Health Organisation (WHO). Global HIV/AIDS response: epidemic update and health sector progress towards universal access. Progress report 2011. Geneva: WHO; 2011.[2] Lohse N, Hansen A, Pedersen G, Kronborg G, Gerstoft J, Sørensen H, et al Survival of persons with and without HIV Infection in Denmark, 1995–2005. Ann Intern Med 2007; 146 87–95.
| Survival of persons with and without HIV Infection in Denmark, 1995–2005.Crossref | GoogleScholarGoogle Scholar | 17227932PubMed |
[3] McLean S, Savage J. Existing services for people living with HIV in Australia. Background paper for models of access and clinical service delivery project. Sydney, NSW: Australasian Society for HIV Medicine; 2009.
[4] Gurran N, Squires C, Blakeley E. Meeting the sea change challenge: best practice models of local and regional planning for sea change communities in coastal Australia. Sydney, NSW: University of Sydney 2005.
[5] Duncombe W, Robbins M, Wolf DA. Retire to where? A discrete choice model of residential location. Int J Popul Geogr 2001; 7 281–93.
| Retire to where? A discrete choice model of residential location.Crossref | GoogleScholarGoogle Scholar |
[6] Savage J, Crooks L, McLean S. Models of access and clinical service delivery for HIV positive people in Australia. Sydney, NSW: Australasian Society for HIV Medicine ; 2009.
[7] World Health Organisation (WHO). The world health report 2006: working together for health. Geneva: WHO; 2006.
[8] Pell C, Donohoe S, Conway D. Health care services for men who have sex with men in different Australian states and territories since the emergence of HIV. Sex Health 2008; 5 161–8.
| Health care services for men who have sex with men in different Australian states and territories since the emergence of HIV.Crossref | GoogleScholarGoogle Scholar | 18588781PubMed |
[9] Markson LE, Houchens R, Fanning TR, Turner BJ. Repeated emergency department use by HIV-infected persons: effect of clinic accessibility and expertise in HIV care. J Acquir Immune Defic Syndr 1998; 17 35–41.
| Repeated emergency department use by HIV-infected persons: effect of clinic accessibility and expertise in HIV care.Crossref | GoogleScholarGoogle Scholar | 1:STN:280:DyaK1c%2FpslamtA%3D%3D&md5=8ba5d20ba5e443bb98525e78256c40cbCAS |
[10] Carman M, Grierson J, Pitts M, Hurley M, Power J. Trends in the location of the HIV-positive population in Australia: implications for access to healthcare services and delivery. Sex Health 2010; 7 154–8.
| Trends in the location of the HIV-positive population in Australia: implications for access to healthcare services and delivery.Crossref | GoogleScholarGoogle Scholar | 20465979PubMed |
[11] Keiser O, Orrell C, Egger M, Wood R, Brinkhof MWG, Furrer H, et al Public-health and individual approaches to antiretroviral therapy: township South Africa and Switzerland compared. PLoS Med 2008; 5 e148
| Public-health and individual approaches to antiretroviral therapy: township South Africa and Switzerland compared.Crossref | GoogleScholarGoogle Scholar | 18613745PubMed |
[12] Samb B, Celletti F, Holloway J, Van Damme W, De Cock KM, Dybul M. Rapid expansion of the health workforce in response to the HIV epidemic. N Engl J Med 2007; 357 2510–4.
| Rapid expansion of the health workforce in response to the HIV epidemic.Crossref | GoogleScholarGoogle Scholar | 1:CAS:528:DC%2BD2sXhsVemu7bI&md5=0579962316d953d447c9ae61912b105dCAS | 18077816PubMed |
[13] Walsh A, Ndubani P, Simbaya J, Dicker P, Brugha R. Task sharing in Zambia: HIV service scale-up compounds the human resource crisis. BMC Health Serv Res 2010; 10 272
| 20849626PubMed |
[14] Fulton BD, Scheffler RM, Sparkes SP, Auh EY, Vujicic M, Soucat A. Health workforce skill mix and task shifting in low income countries: a review of recent evidence. Hum Resour Health 2011; 9 1
| 21223546PubMed |
[15] Jansson J, Wilson DP. Projected demographic profile of people living with HIV in Australia: planning for an older generation. PLoS ONE 2012; 7 e38334
| Projected demographic profile of people living with HIV in Australia: planning for an older generation.Crossref | GoogleScholarGoogle Scholar | 1:CAS:528:DC%2BC38Xht1Srs7fN&md5=d1900b5e7b34acd2fd00fb54d6630827CAS | 22912660PubMed |
[16] Altmayer L. Hot-deck imputation: a simple DATA step approach. Proceedings of the 2002 Northeast SAS User’s Group, September 2002, Buffalo, NY.
[17] Mallitt KA, Jansson J, Crooks L, McGuigan D, Wand H, Wilson DP. Demand for HIV clinical services is increasing in Australia, while supply is decreasing. Sex Health 2012; 10 43–6.
[18] Australasian Society for HIV Medicine (ASHM) Directory of HIV. Hepatitis and related services 2009–2010. Darlinghurst: ASHM; 2009.
[19] Kulldorff M. A spatial scan statistic. Comm Statist Theory Methods 1997; 26 1481–96.
| A spatial scan statistic.Crossref | GoogleScholarGoogle Scholar |
[20] Stevens A, Gillam S. Needs assessment: from theory to practice. BMJ 1998; 316 1448–52.
| Needs assessment: from theory to practice.Crossref | GoogleScholarGoogle Scholar | 1:STN:280:DyaK1c3jvFKisw%3D%3D&md5=f27c1eea88d07ebd5c82f4e887464999CAS | 9572762PubMed |
[21] Newman CE, de Wit JBF, Kippax SC, Reynolds RH, Canavan PG, Kidd MR. The role of the general practitioner in the Australian approach to HIV care: interviews with ‘key informants’ from government, non-government and professional organisations. Sex Transm Infect 2012; 88 132–5.
| The role of the general practitioner in the Australian approach to HIV care: interviews with ‘key informants’ from government, non-government and professional organisations.Crossref | GoogleScholarGoogle Scholar | 22345027PubMed |