

Greenhouse gas (N2O and CH4) fluxes under nitrogen-fertilised dryland wheat and barley on subtropical Vertosols: risk, rainfall and alternatives
Graeme D. Schwenke A D , David F. Herridge B , Clemens Scheer C , David W. Rowlings C , Bruce M. Haigh A and K. Guy McMullen AA Tamworth Agricultural Institute, New South Wales Department of Primary Industries, Tamworth, NSW 2340, Australia.
B School of Environmental and Rural Science, University of New England, Armidale, NSW 2351, Australia.
C Institute for Future Environments, Queensland University of Technology, Brisbane, Qld 4000, Australia.
D Corresponding author. Email: graeme.schwenke@dpi.nsw.gov.au
Soil Research 54(5) 634-650 https://doi.org/10.1071/SR15338
Submitted: 17 November 2015 Accepted: 9 March 2016 Published: 21 June 2016
Journal Compilation © CSIRO Publishing 2016 Open Access CC BY-NC-ND
Abstract
The northern Australian grains industry relies on nitrogen (N) fertiliser to optimise yield and protein, but N fertiliser can increase soil fluxes of nitrous oxide (N2O) and methane (CH4). We measured soil N2O and CH4 fluxes associated with wheat (Triticum aestivum) and barley (Hordeum vulgare) using automated (Expts 1, 3) and manual chambers (Expts 2, 4, 5). Experiments were conducted on subtropical Vertosol soils fertilised with N rates of 0–160 kg N ha–1.
In Expt 1 (2010), intense rainfall for a month before and after sowing elevated N2O emissions from N-fertilised (80 kg N ha–1) wheat, with 417 g N2O-N ha–1 emitted compared with 80 g N2O-N ha–1 for non-fertilised wheat. Once crop N uptake reduced soil mineral N, there was no further treatment difference in N2O. Expt 2 (2010) showed similar results, however, the reduced sampling frequency using manual chambers gave a lower cumulative N2O. By contrast, very low rainfall before and for several months after sowing Expt 3 (2011) resulted in no difference in N2O emissions between N-fertilised and non-fertilised barley. N2O emission factors were 0.42, 0.20 and –0.02 for Expts 1, 2 and 3, respectively. In Expts 4 and 5 (2011), N2O emissions increased with increasing rate of N fertiliser. Emissions were reduced by 45% when the N fertiliser was applied in a 50 : 50 split between sowing and mid-tillering, or by 70% when urea was applied with the nitrification inhibitor 3,4-dimethylpyrazole-phosphate.
Methane fluxes were typically small and mostly negative in all experiments, especially in dry soils. Cumulative CH4 uptake ranged from 242 to 435 g CH4-C ha–1 year–1, with no effect of N fertiliser treatment. Considered in terms of CO2 equivalents, soil CH4 uptake offset 8–56% of soil N2O emissions, with larger offsets occurring in non-N-fertilised soils.
The first few months from N fertiliser application to the period of rapid crop N uptake pose the main risk for N2O losses from rainfed cereal cropping on subtropical Vertosols, but the realisation of this risk is dependent on rainfall. Strategies that reduce the soil mineral N pool during this time can reduce the risk of N2O loss.
Additional keywords: 3,4-dimethylpyrazole-phosphate (DMPP), ENTEC, Hordeum vulgare, Triticum aestivum.
Introduction
Direct greenhouse gas (GHG) emissions from Australia’s agricultural sector total 81 Mt carbon dioxide equivalents (CO2-e) annually, or 15% of net national GHG emissions of 547 Mt CO2-e (Commonwealth of Australia 2015b). The agriculture sector is the primary source of emissions of both methane (CH4), essentially associated with meat and wool production, and nitrous oxide (N2O), predominantly associated with grain cropping (Dalal et al. 2003). Methane emissions from enteric fermentation (i.e. grazing animals) account for ~70% of all agricultural emissions, and N2O a further 15–20%. Concerns over the impacts of increasing GHG concentrations in the atmosphere and resultant effects on global warming and climate change have prompted the Australian agricultural sector to sponsor research into methodologies for improved GHG mitigation. These methodologies will then be incorporated into industry plans for environmentally sustainable production that maintains or increases farm profitability and market access (Rodriguez et al. 2003; Gunasekera et al. 2007; Blumenthal et al. 2008).
The concentration of N2O in the atmosphere is increasing, largely because of increased anthropogenic N inputs into the soil. Emissions of N2O from the soil originate from the biological processes of nitrification and denitrification, which utilise inorganic N from any source (Bremner 1997). Susceptibility to N2O loss is primarily determined by the interaction between the rate of supply of inorganic N, plant demand for N, soil properties, and environmental conditions (Dalal et al. 2003). Of particular concern are N2O emissions associated with fertiliser N inputs in combination with soil moisture.
The Australian Government publishes quarterly national inventories of the sources and magnitude of GHG emissions (Commonwealth of Australia 2015b) as well as comprehensive guidelines on how the emissions are calculated (Commonwealth of Australia 2015a). For the inventories, emissions of N2O associated with grain cropping are calculated by using an emissions factor (EF), which is the proportion of N input subsequently emitted to the atmosphere as N2O, applied to estimated amounts of N fertiliser and other N inputs (IPCC 2006). Australia uses a country-specific EF of 0.2% for N fertiliser used in rainfed cropping (Commonwealth of Australia 2015a), a value based on an analysis by Shcherbak and Grace (2014) of recent Australian field research.
Those same Australian studies indicate that the percentage of fertiliser N applied to grain crops and emitted as N2O varies substantially. The array of values reflects, among other factors, rate of fertiliser N, crop type, tillage practice, stubble management, soil texture, soil pH, and environment – particularly rainfall and temperature (Barker-Reid et al. 2005; Barton et al. 2008, 2010, 2013; Li et al. 2008; Officer et al. 2010; Wang et al. 2011; Schwenke et al. 2015). An analysis of Australian work in which conservation tillage was used indicates an overall average EF of 0.28% from a range 0.01–0.77%. The EFs for subtropical dryland cropping in northern New South Wales (NSW) and southern Queensland (average 0.48%) were higher than for the remainder of Australian grain-growing areas (average 0.07%).
Li et al. (2008) suggested that it was inappropriate to use a single default EF to estimate N2O emissions associated with grain cropping, with crop type, management and environmental factors needing to be taken into account in the calculations. Nitrous oxide is emitted episodically, largely in association with rainfall events. For example, there were 8–10 spikes of N2O emissions during the 3 years of field monitoring in the study by Wang et al. (2011), with the spikes much greater in magnitude for N-fertilised treatments than for unfertilised treatments. Those authors concluded that emissions mainly occurred when the water-filled pore space (WFPS) was >50% and the daily air temperature was >10°C. Other studies have also reported temporal patterns of N2O emissions (Barton et al. 2008, 2011; Officer et al. 2010; Schwenke et al. 2015). Therefore, the occurrence of rainfall episodes coinciding with other conditions conducive to high N2O emissions will determine the EF for any particular situation.
From an industry point of view, an emissions intensity index (EI) can be a more effective tool than EF for comparing management options to optimise both crop yield and N2O emissions (Scheer et al. 2012). The EI is calculated as the ratio of N2O emitted to grain produced. Simply aiming to minimise N2O emissions with no regard to continued profitable grain production will produce strategies that are unlikely to be adopted by grain growers. Instead, using a yield-scaled emissions approach such as EI should ensure that proposed N2O-mitigation strategies are both agronomically efficient and economically profitable (Van Groenigen et al. 2010). Substantially more data from direct field measurements of N2O emissions are needed so that EFs and EIs can be applied that are at least more specific to region, crop type and soil (Ogle et al. 2014).
Apart from soils used for wetland rice cultivation, agricultural soils are typically considered a sink, not a source, of atmospheric CH4, but limited availability of data means that CH4 uptake by soil microorganisms is currently not considered in Australian GHG inventory calculations (Dalal et al. 2008). Methanotrophic activity tends to be greater in forest soils than grasslands, with dryland arable soils typically having much lower uptake potential (Le Mer and Roger 2001). Conditions favouring greater CH4 uptake by cultivated soils include low WFPS, temperatures >10°C, greater aeration, more gas-diffusion pathways (less compaction), non-acidic pH and low salinity (Dalal et al. 2008). Fine-textured soils typically have low CH4 oxidation rates due to their low porosity and high water retention, which combine to restrict diffusion of CH4 into the soil profile (Dutaur and Verchot 2007). However, long-term no-till management that improves soil structure can enhance gas diffusivity and CH4 uptake (Plaza-Bonilla et al. 2014). The addition of ammonium to soils through fertilisers may temporarily inhibit CH4 uptake through competition between some methanotrophic groups and ammonium oxidisers for oxygen in the soil atmosphere. Long-term N-fertiliser use can also cause long-lasting reductions in methanotrophic activity (Hütsch et al. 1993). Chemical additives used to inhibit soil nitrification may either enhance (Weiske et al. 2001) or inhibit (Syamsul Arif et al. 1996) soil CH4 uptake.
Globally, CH4 uptake in cultivated soils averages 0.92 kg CH4-C ha–1 year–1 across a range of boreal, temperate and tropical climates (Dutaur and Verchot 2007). Soil CH4 flux data from cultivated Australian soils are available for tropical sugarcane soils in Queensland (Weier 1999; Denmead et al. 2010), temperate winter crops on a sandy soil in Western Australia (Barton et al. 2010, 2013), and subtropical winter wheat on a clay soil (Wang et al. 2011). There is a need for substantially more field-based data on CH4 fluxes from a diversity of soil types, climatic conditions and potentially influential management factors. Such data would be used in national GHG inventories and, where CH4 uptake exceeds CH4 emission, might be used to offset some of the N2O emissions produced during the same cropping period (Wang et al. 2011).
We report data from five experiments conducted during a 2-year period in northern NSW, in which we used both automated and manual chambers to monitor fluxes of N2O and CH4 associated with the production of N-fertilised wheat and barley. The automated chamber system provides high temporal-measurement resolution of GHG fluxes that can be readily related to changes in soil factors, particularly temperature and moisture. Chamber numbers, however, are restricted (in our case to 12), in turn restricting the number of treatments and/or replicates that can be monitored at any one time. On the other hand, manual chambers deployed at a particular site or experiment need not be as restricted in number and may therefore prove useful in assessing potential emissions-reducing management options.
Materials and methods
Five field-plot experiments were conducted in the winter cropping seasons of 2010 and 2011. Expts 1, 2 and 3 were at the Tamworth Agricultural Institute (31.152°S, 150.982°E) near Tamworth, NSW. Expt 4 (31.484°S, 150.177°E) and Expt 5 (31.171°S, 150.806°E) were on nearby commercial farms. All experiments were on neutral–alkaline Vertosols (Isbell 2002) of medium–heavy clay content.
Experiments 1 and 3: automated chambers in wheat (2010) and barley (2011)
The site for Expts 1 and 3 was described by Schwenke et al. (2015), along with field methods of soil and plant sampling, laboratory analysis, monitoring of soil-water content and environmental conditions, and data interpretation.
Plots were 12 m long and 6 m wide. The experimental crops were wheat (Triticum aestivum cv. Crusader) in 2010 and barley (Hordeum vulgare cv. Shepherd) in 2011. All plots were sown with a no-till planter at a row spacing of 0.25 m. Wheat was sown on 27 July 2010. The previous crop (2009) was chickpea (Cicer arietinum). Wheat plots were machine-harvested on 15 December 2010. Following the weed-free summer–autumn fallow, barley was sown on 27 June 2011 and it was harvested on 16 December 2011. Rates of applied N fertiliser were 0 or 80 kg N ha–1 (wheat) and 0 or 60 kg N ha–1 (barley). Rates were calculated as the projected crop N demand minus the pre-sowing soil mineral N supply as determined by soil-core testing to 1.5 m depth (Herridge 2011). Urea-N was side-banded at sowing at a 0.1-m offset to each plant row and a soil depth of 0.05–0.1 m. Weeds, insect pests and plant diseases were controlled chemically by using appropriate compounds at approved rates when necessary. The 2010 wheat and 2011 barley were grown within a larger crop rotation trial organised as a randomised complete block design with four replicates.
Fluxes of N2O and CH4 were measured in three of the four replicates. One chamber (0.5 m by 0.5 m by 0.15 m high) was deployed in each treatment of three replicate plots from July 2010 to June 2011 for wheat, and from June 2011 to July 2012 for barley. Chambers were secured to bases pushed 0.1 m into the soil. Each base covered two crop rows and two N-fertiliser bands. During crop growth, chambers were moved weekly to new locations within each plot to minimise the impact of the chamber on plant growth. Chamber height was increased with extensions so that the chamber covered the crops as they grew, to include N2O emitted through plant transpiration (Chang et al. 1998). At maturity, plants growing within the chamber bases were hand-harvested, the grain was removed, and the plant residues were returned to the same base.
We used a 12-chamber automated gas-measuring system (Scheer et al. 2011) on four treatments within the larger rotation trial. Data from only two of the four treatments are presented in this paper. The automatically operated chambers in the first replicate were closed for 60 min, during which time four separate samples of air from the chamber headspace were collected at 15-min intervals. Samples were analysed immediately in an in-situ gas chromatograph (8610C; SRI Instruments, Torrance, CA, USA) fitted with an electron-capture detector for N2O measurement and a flame-ionisation detector for CH4 measurement. After the closure period, the chambers in the first replicate opened and those in the second replicate closed for 60 min, followed by the chambers in the third replicate 60 min later. After 180 min, the cycle restarted, giving eight measurements per chamber per day.
The N2O and CH4 concentrations in the four air samples from each chamber during each closure period were regressed against closure time. For N2O fluxes, we used the HMR routine, developed by Pedersen et al. (2010), which selects the most appropriate model for flux estimation based on the data from each measurement period. The routine first fitted a non-linear model to the data. Where this fit was not statistically significant, the linear model was then fitted. If neither model was statistically significant, a slope of zero was assigned. For CH4 fluxes, we used linear regression, with a slope of zero assigned where r2 <0.8. The slope of the selected regression was used in the calculation of N2O and CH4 fluxes (Schwenke and Haigh 2016). Chamber temperature was measured by using a thermocouple probe in one chamber in each replicate set of four. Excessive heat (>55°C) within a chamber triggered a cessation of the current measurement and the chambers opened. Similarly, chambers opened and measurements were suspended when rainfall intensity exceeded 0.4 mm in 5 min. Altogether, ~25% of all possible measurement opportunities (eight per day) in Expts 1 and 3 were missed through heat, rainfall, equipment removal for planting or harvesting, or equipment servicing or breakdown. Cumulative N2O and CH4 emitted during the experiment were calculated by linear interpolation between daily average fluxes.
Aboveground plant and grain samples (two 0.5-m rows per plot) were collected before harvest by hand-cutting, then dried at 70°C for 48 h, weighed and analysed for total N concentration (%N) by combustion analysis (EA1112; Thermo Finnigan, San Jose, CA, USA). Grain protein was calculated by multiplying grain %N by a factor of 5.7. All results for grain yield and protein were standardised to a moisture content of 12% before treatments were compared. After harvest, all plant residue material from a plot was distributed evenly across that same plot.
Surface and subsurface samples (0–0.1 and 0.1–0.2 m) for soil mineral N (ammonium and nitrate) were collected in a cross-row transect of five 0.05-m-diameter cores per plot. For deeper samples (0.2–0.3, 0.3–0.6, 0.6–0.9, 0.9–1.2 and 1.2–1.5 m), two cores were collected per plot. Surface and subsurface samples were collected approximately monthly and deeper cores at pre-sowing and post-harvest. Soil bulk density was determined by the small-core volumetric-ring method (Cresswell and Hamilton 2002). Soil-water content was determined by gravimetric analysis at each time of soil sampling. Ammonium-N and nitrate-N in filtered (Whatman 42) soil extracts (2 M KCl) that were prepared on the day of sampling were determined by standard colourimetric analyses with a flow injection analyser (Lachat Instruments, Loveland, CO, USA). Soil moisture was also monitored by using a site-calibrated ThetaProbe ML2x soil moisture sensor (Delta-T Devices, Burwell, UK) at 0.05 m depth in the soil within each chamber.
Weather conditions measured at the site included ambient air temperature and relative humidity (Tinytag Plus 2: TGP-4500; Gemini Data Loggers, Chichester, UK), daily rainfall (RainLogger; RainWise, Trenton, ME, USA), and soil temperature at 0.05 and 0.15 m depths (Tinytalk II; Gemini Data Loggers).
Experiment 2: manual chambers in wheat (Tamworth, 2010)
Experiment 2 was adjacent to Expts 1 and 3. Plots were 12 m long and 2 m wide. Wheat (cv. Crusader) was sown on 27 July 2010. The experiment was part of a larger, randomised complete block experiment with four replicates. Results presented here are for 4-m-wide plots that grew chickpea in 2009 and were then divided in half lengthwise, with one half receiving N fertiliser in 2010 and the other half no N fertiliser. Emissions of N2O and CH4 were measured weekly on average (range 1–16 days between samplings) during the first 2 months, then every 12 days on average for the remainder of the year. Crop agronomy, and soil and plant sampling, were conducted as described for Expt 1. Manual measurements of GHG emission were described previously (Schwenke et al. 2015). The chambers were the same dimensions as the automated chambers used in Expt 1 and included plants. Chamber bases were inserted 0.1 m into the soil and remained in place throughout the experiment but chambers were removed after sampling. Upon chamber closure, 18-mL air samples were collected in pre-evacuated 12=mL glass Exetainer vials (Labco, UK) after 0, 30 and 60 min. All samples were later analysed using a laboratory gas chromatograph with detectors similar to those used in Expt 1.
Experiment 4: manual chambers in wheat (Spring Ridge, 2011)
Wheat (cv. EGA Gregory) was sown on a Black Vertosol on 21 June 2011 and harvested on 5 December 2011. Plots were 9 m long and 1.5 m wide (5 rows at 0.3-m spacing). Nitrogen fertiliser treatments were: 0, 40, 80 and 160 kg N ha–1 applied as urea side-banded at sowing; a split urea application (40 kg N ha–1 at sowing + 40 kg N ha–1 as broadcast urea at Z31, mid-tillering; Zadoks et al. 1974) and 80 kg N ha–1 of DMPP (3,4-dimethylpyrazole-phosphate) coated urea (ENTEC™, Incitec-Pivot Fertilisers, Melbourne, Australia) at sowing. All treatments were replicated four times within a randomised block design.
Fluxes of N2O and CH4 were measured by using manual chambers on 14 occasions during crop growth. Chambers were 0.25-m-diameter PVC cylinders positioned centrally over the fertiliser band, then pushed into the ground to a depth of 0.1 m, leaving 0.2 m above the soil surface. At the time of sampling, a lid fitted with a rubber O-ring was placed on the top of each chamber. Several chambers were sampled immediately after fitting the lids to give an average ambient gas concentration that was used for that day’s flux calculations. Using pre-evacuated, 12-mL glass Exetainer (Labco, Lampeter, UK) vials, we collected 20 mL chamber air through a rubber septum in the chamber lid at 0, 30 and 60 min post-closure. These samples were analysed as for Expt 2. Cumulative N2O emitted during the experiment was calculated by multiplying the average daily flux rate of consecutive samples by the number of days between those consecutive sample collections. However, where consecutive samples were collected at more than 3 days apart, the intervening daily fluxes were calculated by halving each previous day’s flux. High-temporal resolution data from a previous auto chamber experiment at the site showed that this calculation avoided overestimating fluxes during extended dry periods after rainfall events and dry periods leading up to a wet period with high fluxes (Schwenke et al. 2015). Cumulative fluxes of CH4 were calculated by linear interpolation between sampling days.
Daily rainfall was measured at the site using a tipping-bucket rain logger (RainWise). Soil was sampled to 1.5 m depth at eight locations across the trial area before sowing, then approximately monthly to 0.1 m in each plot during the crop’s growth. Samples were processed and analysed for mineral N as in Expt 1. Biomass was measured at plant maturity (Z99) by collecting all aboveground plant matter in two 0.5-m lengths of row per plot. Cut samples were dried at 70°C for 48 h then weighed and analysed for %N as per Expts 1 and 3.
Experiment 5: manual chambers in barley (Bithramere, 2011)
Barley (cv. Shepherd) was sown on a Red Vertosol on 9 June 2011 and harvested on 30 November 2011. Plots were 9 m long and 1.5 m wide (five rows at 0.3-m spacing). Nitrogen fertiliser treatments were 0, 30, 60 and 90 kg N ha–1 applied as urea side-banded at sowing, a split urea application treatment (30 kg N ha–1 at sowing + 30 kg N ha–1 as broadcast urea at Z31, mid tillering), and 60 kg N ha–1 of DMPP-coated urea at sowing. All treatments were replicated four times within a randomised block design.
Fluxes of N2O and CH4 were measured on 13 separate occasions during the crop growth as in Expt 4. Plant and soil samples were also collected and analysed as in Expt 4.
N2O emission factors and emission intensity
Emission factors for N2O were calculated by first subtracting the N2O emitted from the non-N-fertilised crop from that emitted by the N-fertilised crop, then dividing the net amount by the fertiliser N applied. In Expts 1–3, this was calculated for the crop-only period (EFcrop, sowing–harvest) and for the full year after N fertiliser application (EFyear). In Expts 4 and 5, EF was calculated for the crop period only. The N2O EI (g N2O-N t–1 grain) was calculated as the cumulative N2O emitted over the measurement period, divided by the grain yield from the same plot.
Non-CO2 GHG balance
Using the cumulative N2O and CH4 emission totals, an annual non-CO2 GHG balance was calculated for each treatment in each trial as follows:
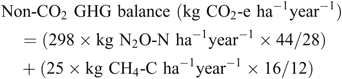
The conversion factors of 298 and 25 were used to convert N2O and CH4, respectively, to CO2-e (Forster et al. 2007).
Statistical analyses
Statistical comparisons of treatment results were made using the REML with spatial analysis procedure in Genstat 16th edition (VSN International Ltd, Hemel Hempstead, UK). Individual treatment means were tested for difference using the least significant difference (l.s.d.) test at a probability level of P = 0.05. Possible correlations between daily gas fluxes and environmental factors (air temperature, soil temperature at depths of 0.05 and 0.15 m, rainfall and WFPS) were investigated by using the multiple linear regression procedure in Genstat 16th edition.
Results
Rainfall
Monthly rainfall deviated considerably from long-term averages at the experimental sites (Fig. 1). At the Tamworth site, rainfall in the weeks preceding sowing of Expts 1 and 2 was three times the long-term July average for the site (93rd percentile), and continued at a high intensity into August (86th percentile). Rainfall throughout the remainder of the growing season was near normal until harvest in December when the monthly total was double the long-term average (94th percentile). By contrast, there was minimal rainfall before, during and for 2 months after the sowing of Expts 3, 4 and 5 in June–July 2011 (33rd and 16th percentiles). Only in September and November 2011 were the monthly rainfalls well above average (86th and 91st percentiles).

|
Total in-crop (sowing–harvest) rainfall was 476, 476, 380, 303 and 338 mm for Expts 1–5, respectively. However, much of the above-average rainfall recorded in November 2011 occurred just before harvest and thus did not benefit crop production; for example, 86 mm rainfall occurred in the final week before harvest at Expt 5. During the post-harvest fallow to the end of the 12-month emissions-measuring period, Expts 1 and 2 had an additional 315 mm rainfall, and Expt 3 an additional 400 mm.
Soil mineral N
Pre-sowing mineral N concentrations (0–1.5 m) were uniform across the sites used for Expts 1–3 (data not shown). Post-harvest sampling to 1.5 m depth showed no significant treatment effects on mineral N at any depth in the soil profile.
In all experiments, treatment effects of N fertiliser application on surface-soil mineral N (0–0.1 and 0–0.2 m) were evident for 1–3 months after application (Fig. 2), depending on the experimental conditions. In Expts 1 and 2 (Fig. 2a), soil mineral N in the surface declined between June and July 2010 as a result of the intense rainfall and waterlogging conditions between these sample times. Although sampling in late August 2010 showed significant treatment differences in soil mineral N, levels were much less than expected considering the amount of N applied; therefore, much of the applied N had been either lost or taken up by the crop. The next sampling in October found little remaining evidence of treatment effects. Following harvest in December 2010, soil mineral N increased in all treatments during the 6-month fallow period, with no effect of the N fertiliser application in July 2010.

|
Mineral N in the surface soil of Expt 3 (Fig. 2a) showed a large effect of fertiliser N throughout the dry period until September 2011, when rainfall and crop uptake reduced available N to nil by November 2011. Mineralisation of soil organic matter and crop residues rapidly replenished soil mineral N during the summer fallow, but no significant effects of the N fertiliser applied in June 2011 were detected post-harvest.
Surface soil mineral N in Expts 4 and 5 (Fig. 2b, c) showed effects of the fertiliser N applied at sowing throughout crop growth. However, treatment differences had disappeared by harvest. In Expt 4, the strategies of split N (40 + 40 kg N ha–1) and DMPP-coated urea (80 kg N ha–1) applications tended to reduce soil mineral N, particularly the ammonium component (not shown), in samples collected during July and August 2011 compared with the same rate of N added as urea at sowing (80 kg N ha–1). These apparent trends were not statistically significant (P > 0.05). In September 2011, despite similar total mineral-N levels, the treatment with DMPP-coated urea had significantly more ammonium-N than the urea at sowing and the split N treatments, demonstrating its effectiveness in delaying nitrification. For Expt 5, there were no significant N treatment effects on soil mineral N at any sampling date.
Crop production, N uptake and grain yield
Nitrogen uptake by the wheat and barley in Expts 1 and 2 was not affected by N fertiliser, whereas in Expt 3, N fertiliser resulted in significantly higher crop N uptake (Table 1). Crop (aboveground) residue N was similarly unaffected by N fertiliser in Expts 1 and 2 but was higher with N application in Expt 3 (Table 1).

|
In 2010, wheat grain yields were reduced because of late sowing caused by rain delays, waterlogging after sowing, a late frost coinciding with flowering, and rainfall during crop maturation (Table 1). These factors led to low harvest indices of 0.26 (Expt 1) and 0.22 (Expt 2). There was no significant effect of N fertiliser on grain yields in either experiment, but grain protein contents were high and, in Expt 1, were significantly increased with added N fertiliser.
Crop production in 2011 (Expt 3) was reduced by low available soil water at sowing and very dry conditions for the first 2 months post-sowing (Fig. 1). As a result, crop biomass was below that of 2010, although grain yields were similar across the two seasons (Table 1). The 2011 harvest index was 0.42. Fertiliser N addition in 2011 significantly increased yield in hand-harvested samples (although not in machine-harvested results), grain protein, and grain N removal (Table 1).
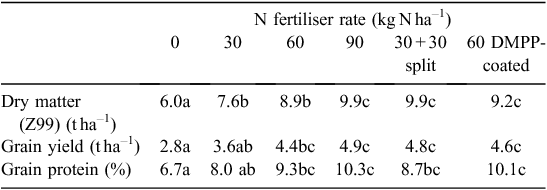
In Expts 4 and 5, mature crop biomass, grain yield and grain protein were increased by N fertiliser above the nil N treatment. In Expt 4, although all fertiliser N treatments produced similar biomass, 80 kg N ha–1 applied at sowing produced the highest grain yield, higher than the treatments with split N or the DMPP-coated urea with the same amount of N applied (Table 2). All three 80 kg N ha–1 strategies gave similar grain protein results, whereas the 160 kg N ha–1 rate significantly increased grain protein. The treatments with split N application and DMPP-coated urea did not influence grain yield or grain protein in Expt 5 but did result in greater mature biomass than the equivalent N rate all applied at sowing (Table 3).

|
|
Daily N2O fluxes
In general, N2O emissions were very low, interspersed with brief periods of higher emission activity after heavy rain fell on saturated soils with either freshly decomposing crop residue or recently added N fertiliser. Daily N2O fluxes (g N2O-N ha–1 day–1) averaged 1.0 in Expt 1 (range –1.7 to 33.5), 1.6 in Expt 2 (range –1.8 to 14.4), 0.6 in Expt 3 (range –1.0 to 33.0), 4.2 in Expt 4 (range –1.7 to 26.5), and 9.1 in Expt 5 (range –0.7 to 118.4).
Nitrous oxide fluxes in the first 2 months after N application were greater in the N-fertilised treatments of Expts 1 and 2 than in the corresponding nil-N treatments (Fig. 3b, c). Sowing and N fertiliser application on 27 July 2010 was followed by 68 mm rainfall over 3 days on an already-saturated soil, so soil WFPS remained >70% for much of the first 2 months post-sowing (Fig. 3a). From October 2010 onwards, the soil dried as the crop grew and N2O emissions remained low, with no difference in daily N2O flux between N-fertilised and non-fertilised treatments. In November and December 2010, isolated heavy rainfall events temporarily increased WFPS and N2O emission, but only for 1–2 days. Post-harvest N2O emissions were very low, with daily fluxes only temporarily exceeding 1 g N2O-N ha–1 day–1 following significant rainfall. Daily N2O emissions measured in Expt 2 were generally similar to those in Expt 1 (Fig. 3c).

|
During the June–December 2011 crop period of Expt 3, there were only 7 days when soil WFPS exceeded 70% (Fig. 4a). It was not until February 2012 that more than 3 consecutive days showed soil WFPS >70%. As a result, daily N2O fluxes were low throughout the year of measurement, with only a single spike in daily N2O flux >10 g N2O-N ha–1 day–1 during June 2012 (Fig. 4b). There was no measurable impact of N fertiliser addition on N2O flux at any stage in Expt 3.

|
Daily N2O fluxes in Expts 4 and 5 were low for the first half of the growing season (Fig. 5b, e) owing to dry conditions, with elevated emissions recorded only after heavy rainfall (28 mm for Expt 4, 45 mm for experiment 5; Fig. 5a, d) in the later stages of the experimental period. In Expt 4, rain in early September 2011 resulted in treatment differences in N2O emissions. The 160 kg N ha–1 treatment produced significantly higher N2O emissions than all other treatments for the remainder of the experiment. There were also two occasions in September when N2O flux was significantly greater in the 80 kg N ha–1 treatment than the treatments with split N or DMPP-coated urea. In Expt 5, the large variation amongst replicates meant that there were no statistically significant differences between N rate treatments on most sampling occasions. However, there was a consistent trend across sampling dates for N2O fluxes in the order 90 kg N ha–1 > 60 kg N ha–1 > 30 kg N ha–1 > split N, 30 + 30 N ha–1 > DMPP-coated urea, 60 kg N ha–1.

|
Daily CH4 fluxes
Emissions of CH4 were below the detection limit or negative across all experiments; therefore, for the majority of measurements there was a net uptake of atmospheric CH4. Daily CH4 fluxes (g CH4-C ha–1 day–1) averaged –1.7 in Expt 1 (range –7.8 to 1.9), –0.9 in Expt 2 (range –5.0 to 1.0), –0.8 in Expt 3 (range –6.2 to 1.3), –1.6 in Expt 4 (range –4.7 to 1.9), and –1.9 in Expt 5 (range –5.3 to 0.2).
Fluxes of CH4 in Expts 1, 2 and 3 became increasingly negative as the crop-growing season progressed and the soil became drier (Figs 3d, e and 4c). Significant rainfall events and high soil WFPS in November 2010 and September 2011 coincided with less negative or positive CH4 fluxes. In both years of measurement, the CH4 fluxes reverted to mostly negative again as the soil dried. Fluxes of CH4 were more stable and generally less negative during the post-crop fallow than during the cropping period. Methane flux and WFPS were significantly positively correlated, with WFPS accounting for 33% of variation in CH4 fluxes in Expt 1 (P < 0.05) and 23% in Expt 3 (P < 0.05). Addition of N fertiliser did not significantly affect CH4 flux in Expts 1–3.
In Expts 4 and 5 (Fig. 5c, f), CH4 flux appeared to be positively related to soil moisture, but incomplete sampling of soil moisture during these experiments meant that statistical correlations could not be calculated. There was no significant effect of N fertiliser rate or application strategy on CH4 flux, except during one mid-September sampling in Expt 5. In that case, the treatment with DMPP-coated urea at 60 kg N ha–1 had a significantly greater negative flux than treatments with 60 kg N ha–1 or split N at 30 +30 kg N ha–1, both of which had slightly positive fluxes on the same date.
Cumulative N2O emissions
Cumulative N2O emissions for the year of measurement were significantly affected by N fertiliser application in Expts 1 and 2 (Fig. 6a) but not in Expt 3 (Fig. 6b). Most of the treatment effect in Expts 1 and 2 occurred during the first 2–3 months after N fertiliser application, with only sporadic additions to the cumulative total throughout the remainder of the measurement period.

|
For Expts 4 and 5, there was a clear trend for increasing cumulative N2O emitted with increasing N rate (Figs 6c, d and 7a, b). DMPP-coated urea reduced N2O emissions by 76% (Expt 4) and 65% (Expt 5) compared with treatments where the same rate of urea was applied (Fig. 7a, b). Similarly, the strategy of splitting N reduced N2O emissions by 38% (Expt 4) and 51% (Expt 5) compared with treatments where the same rate of urea was applied all at sowing (Fig. 7a, b).

|
Cumulative CH4 uptake
Most daily CH4 fluxes were nil or negative, so the cumulative CH4 emitted during the measurement periods was negative; that is, there was a net uptake of atmospheric methane by the soil in each experiment, with ranges of 242–435 g CH4-C ha–1 for Expts 1–3, and 181–366 g CH4-C ha–1 for Expts 4–5 (Fig. 8). There were no significant N fertiliser treatment effects on CH4 uptake in any experiment.

|
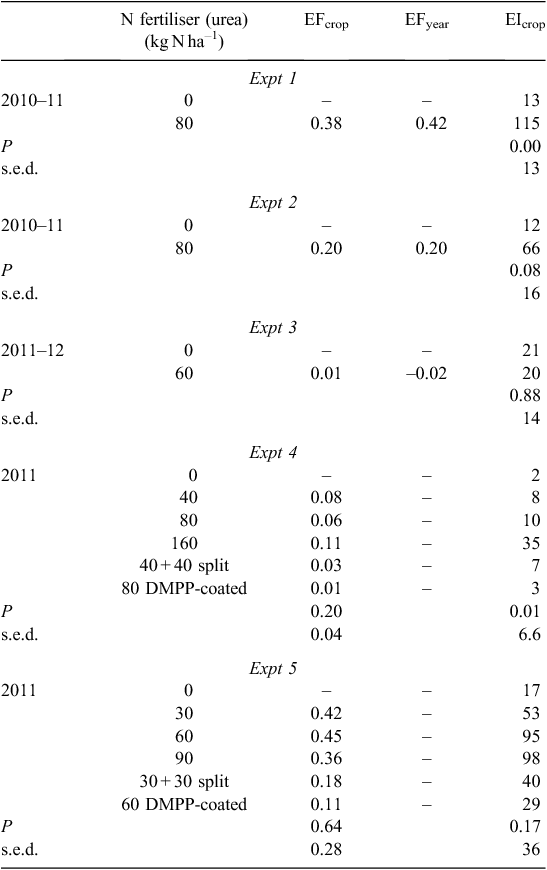
N2O emission factors
The similarity between EFcrop and EFyear in Expts 1 and 2 reflects the particular environmental conditions of these experiments, with N2O emissions primarily occurring during early crop growth (Table 4). In Expt 4, the EF for the treatment with DMPP-coated urea at 80 kg N ha–1 was significantly less than for the corresponding N rate of urea applied all at sowing (80 kg N ha–1), whereas the EF for the treatment with split N (40 + 40 kg N ha–1) was statistically between the these two treatments.
|
The EI values reflected significant effects of N fertiliser applications in Expts 1 and 4, with more N2O emitted per t grain when N fertiliser was applied in Expt 1 because of the seasonal conditions. However, in Expt 4, the inefficiency of the highest N rate was demonstrated by a higher EI than all other treatments (Table 4). The treatments with DMPP-coated urea in both Expts 4 and 5 had lower EIs than the equivalent N rates with ordinary urea, although these differences were not statistically significant.
Non-CO2 GHG balance
The non-CO2 GHG balance for the crop period varied from 10 to 150 kg CO2-e ha–1 across Expts 1–3, and from 15 to 181 kg CO2-e ha–1 for the full year (Table 5). The influence of CH4 uptake in offsetting N2O emissions differed between experiments and treatments. In CO2-e terms, CH4 uptake offset 8–11% of the N2O emitted from the 80 kg N ha–1 treatment in Expts 1 and 2, and 39–56% of the N2O from the nil N treatment. In Expt 3, fertiliser N addition did not significantly affect the 9% of N2O emissions offset by the CH4 uptake.

|
Discussion
N2O emissions in relation to rainfed grain production
Several studies have examined N2O emissions from N-fertilised dryland wheat on cracking clay soils in Australia, with total yearly N2O emissions ranging from 0.50 kg N2O-N ha–1 in western Victoria (Officer et al. 2008) to 0.90 kg N2O-N ha–1 in southern Queensland (Wang et al. 2011). By comparison, we measured 0.42 kg N2O-N ha–1 for N-fertilised wheat and 0.23 kg N2O-N ha–1 for N-fertilised barley. Our EF values for wheat (0.42% in Expt 1, 0.20% in Expt 2, 0.06% in Expt 4) and barley (–0.02% in Expt 3, 0.30% in Expt 5) were considerably lower than the 3-year average EF of 0.77% for no-till, stubble-retained wheat measured by Wang et al. (2011). However, they were generally higher than the 0.14% for N-fertilised, non-irrigated wheat in the study by Officer et al. (2008).
The dissimilarity in cumulative N2O-N totals between Expts 1 and 2 is likely the result of differences in sampling frequency (Barton et al. 2015), with manual sampling occurring weekly on average during the first 2 months, and then every 12 days on average for the remainder of the year. Large but transient daily N2O emission peaks occurring between sampling days in the first 2 months may therefore have been missed. Additionally, there may have been days when the flux at the designated time of sampling was not representative of the daily average flux rate. The high-frequency data from Expt 1 are the more robust measurement.
None of the experiments reported here experienced average rainfall in the first few months after sowing and N fertiliser application (Fig. 1). In 2010 (Expts 1 and 2), rainfall for several days after sowing resulted in conditions of high soil WFPS, which produced significant N2O emissions from the N-fertilised treatment. Soil sampling conducted 1 month after sowing found less mineral N in the soil than would be expected from the amount added in fertiliser, indicating substantial N loss from the surface soil through denitrification and nitrate leaching. Because the N-fertilised soil did not affect post-harvest N2O emissions, the critical period for N2O loss was the first 2–3 months after application of N fertiliser (Scheer et al. 2016).
By contrast, the N fertiliser applied at the 2011 sowing remained largely intact as soil mineral N for the next 2 months due to below-average moisture conditions (Fig. 1). Resumption of average, though not intense, rainfall during September led to rapid plant uptake of the soil mineral N (Fig. 2). Above-average rainfall in November temporarily increased N2O emissions but by then soil nitrate concentration was low (Fig. 2a), so N2O losses were small. As in 2010, there was minimal mineral N remaining post-harvest and no N-fertiliser treatment effect on crop residue N to cause any lasting treatment effects on post-harvest N2O emissions. Therefore, the risk of early N2O loss after fertiliser N application was not realised in 2011 because of the dry conditions. Consequently, the measured EF was effectively nil.
Clearly, N2O emissions associated with fertiliser N applications for a particular site will very much depend on the seasonal rainfall conditions. Predicting emissions by using readily available information such as soil texture, rainfall and temperature profile will produce more accurate inventory results. In the meantime, the currently prescribed EF of 0.2% appears reasonable (Shcherbak and Grace 2014; Commonwealth of Australia 2015a).
N2O mitigation options for rainfed cereal cropping
Application of N fertiliser in excess of crop requirements can lead to exponentially increased N2O emissions, as seen in Expts 4 and 5, and in many international studies (Scherbak et al. 2014). Even at optimum rates, emissions can still be substantial, so alternative strategies for N application need to be considered. Results from Expts 1 and 2 and from a study of N-fertilised canola at the same site (Schwenke et al. 2015) indicated that application of fertiliser N at sowing led to significantly higher N2O emissions for up to several months before crop growth depleted the pool of soil mineral N derived from fertiliser. Expts 4 and 5 explored two potential strategies to reduce this pool of soil mineral N. The strategies were (i) splitting the optimal N fertiliser 50 : 50 between application at sowing and topdressing at mid-tillering, and (ii) applying DMPP-coated urea at sowing at the optimal N fertiliser rate. These experiments coincided with abnormally dry conditions in 2011 where denitrification or leaching losses were minimal during the critical post-sowing period, so the full potential of these strategies could not be assessed within this study.
Cereal N uptake typically proceeds very slowly until tillering begins, and then increases rapidly to a maximum N uptake rate during the jointing stage. Therefore, it is logical to delay some or all of the N fertiliser application until late tillering. Splitting the N application for cereal production has been found to increase grain yield, grain protein and fertiliser N recovery in many studies (IAEA 2000). Split N application is practised in many cereal-growing regions worldwide; however, it is rare in the study region. This is because <20% of the annual rainfall (600–800 mm) occurs in winter, winter rainfall events are highly variable with coefficients of variation of 46–80% (Webb et al. 1997), and forecast rain fronts during winter may not eventuate into sufficient rainfall for the crop to utilise the applied N (Doyle and Shapland 1991; Herridge 2011). Other studies of effects of split N application on N2O emissions have shown mixed results, depending on the timing of significant rainfall events in relation to N application (Weier 1999; Burton et al. 2008; Venterea and Coulter 2015), or the total N rate applied (Allen et al. 2008; Zebarth et al. 2008). Expts 4 and 5 in this study showed apparent reductions in emissions of 38–51% compared with a single N application at sowing, although grain yield was also reduced in Expt 4. Further field research is needed into the impacts of split N application on N2O emissions from rainfed cereal crops in Australia.
The application of DMPP-coated urea fertiliser (ENTEC) at sowing to delay nitrification has been reported in several cropping experiments (Weiske et al. 2001; Liu et al. 2013; De Antoni Migliorati et al. 2014; Scheer et al. 2014; Scheer et al. 2016). All studies showed that this treatment significantly reduced nitrate production from fertiliser and consequently reduced seasonal N2O emissions by 38–75% compared with standard urea, with deviations in effectiveness linked to soil moisture and temperature conditions (Chen et al. 2010; Menéndez et al. 2012). In our study, DMPP-coated urea reduced cumulative N2O emissions in Expts 4 and 5 by 65–75% compared with standard urea when both were applied at the same N rate at sowing. Our soil mineral N and N2O results also indicated good potential for these strategies to influence the outcome in a wetter season, but the 2011 season did not see waterlogging that would have caused potentially yield-reducing soil N loss through denitrification. Further field research is needed to quantify the impact of nitrification inhibition as a practical mitigation option in unusually wet cropping seasons.
CH4 uptake associated with rainfed grain production
Methane uptake rather than emission dominated CH4 fluxes in this study, with the rate of uptake negatively correlated with soil moisture; that is, dry soil absorbed more CH4. Daily CH4 fluxes were within the ranges for CH4 emission and uptake recorded for other Australian rainfed grain-cropping experiments (Barton et al. 2010, 2013; Wang et al. 2011). The annual cumulative CH4-C uptake in this study ranged from 242 to 435 g CH4-C ha–1 year–1 (Table 5), which was comparable to the 301–539 g CH4-C ha–1 year–1 uptake measured in a semi-arid sandy soil (Barton et al. 2013). However, other Australian grain-cropping studies have reported either no net CH4 uptake (Barton et al. 2010), or net CH4 emissions of 75–150 g CH4-C ha–1 year–1 (Wang et al. 2011).
There is evidence in the literature for the inhibition of soil CH4 uptake by applied N fertiliser (Dalal et al. 2008), but we found no such effects in our experiments. Likewise, Wang et al. (2011), with a similar soil type (Black Vertosol) and subtropical climate, also found no effect of long-term (38-year) N fertiliser addition on CH4 fluxes during 3 years of continuous monitoring. In Expt 5, one sampling period indicated enhanced CH4 uptake from soils fertilised with DMPP-coated urea compared with soils fertilised with standard urea at the same N rate. Weiske et al. (2001) found that DMPP-coated ammonium sulfate nitrate stimulated annual soil CH4 uptake by an average of 28% during a 3-year study in Germany, with the treatment differences in 2 years lasting for several months after fertiliser application. Given the consistent and significant overall trend for soil CH4 uptake observed in this study, further field or laboratory studies should be targeted to isolate the effects of potentially influencing factors such as N fertiliser rate, weed management (herbicides, tillage operations), fertiliser type, and fertiliser inhibitors.
Net non-CO2 GHG emissions
Rainfed grain-cropping systems have mostly been evaluated for their impacts on N2O emissions, with CH4 and CO2 fluxes not always measured or reported. Barton et al. (2013) found that cumulative CH4 uptake increased with lime application in a wheat–wheat rotation, but they did not offset this against N2O emitted from the same treatments and did not report CO2 fluxes. Cumulatively, the beneficial effects of CH4 uptake by the soils in this study offset the environmentally harmful effects of the N2O emitted by 9–56%, with proportionally greater offsets occurring in the non-N fertilised plots that had lower N2O emissions. Wang et al. (2011) found no treatment effects on CH4 flux and no clear trends towards either net CH4 emission or consumption, but they did include the CH4 flux data in a net GHG evaluation of their experimental treatments.
The net soil CO2 flux associated with cropping can also be considered when conducting a net GHG evaluation of soil–plant management options. However, the chambers used in this study necessarily included growing plants (to capture N2O emitted in transpiration); therefore, CO2 flux measured in the chambers was a product of plant photosynthesis and plant–soil respiration. Although these data can be indicative of soil microbial activity (Barton et al. 2010), the inclusion of plant respiration precludes it from use in GHG balance calculations, as does the difficulty in accounting for the C added back into the soil as plant residues and exudates.
An alternative means of including CO2 flux in a net GHG balance is to use an indirect estimate derived from long-term changes in soil organic C (SOC) stocks. For example, Wang et al. (2011) used 40 years of SOC data to calculate the net annual CO2 fluxes from continuous wheat production on a subtropical Black Vertosol. They found a near-neutral response (9 ± 196 kg CO2-e ha–1 year–1) in plots of continuous wheat under no-till, stubble-retained and N-fertilised conditions, compared with 284 ± 75 kg CO2-e ha–1 year–1 lost by the same system with no N fertiliser. Such a difference potentially outweighs the negative impacts of N2O emissions from N-fertiliser use when calculating the net GHG balance. We have not used CO2 fluxes in our calculations because comparative CO2 flux data do not exist for the no-till, stubble-retained, grain-legume–N-fertilised cereal cropping systems studied here. However, nearby long-term studies have found that SOC was stable over time in a cultivated, grain-legume–nil-N wheat rotation (Blair and Crocker 2000; Blair et al. 2006) after an initial decline (Holford et al. 1998), and potentially increasing in N-fertilised cereal–legume rotations with no-till and stubble retention (Young et al. 2005).
Conclusions
For a winter cereal crop, the critical period to target for strategic mitigation of N2O emissions is between application of the N fertiliser at sowing and the period of rapid N uptake by the growing crop after the onset of tillering. Although this risk period is present each year, actual N2O losses are realised only when rainfall intensity raises soil WFPS and denitrification activity increases. Possible management options to reduce N2O losses need further field investigation, with split applications of fertiliser N and urea coated with a nitrification inhibitor (DMPP) showing promise. The cereal crops studied here showed no post-harvest carry-over of the N applied at sowing; therefore, mineralisation of N-fertilised crop residues is unlikely to create further risk of N2O losses, as was the case with N-rich legumes and canola (Schwenke et al. 2015).
Methane uptake in this production system was largely unaffected by N-fertiliser use or application strategy, but was found to vary in response to soil WFPS. Although the uptake of CH4 by soil benefits the overall GHG balance for a cropping paddock, its contribution relative to N2O emissions is generally small in an N-fertilised situation. However, where N2O emissions are low in drier cropping seasons, CH4 uptake can almost completely offset the negative environmental effects of N2O emitted during a dryland cereal crop.
Acknowledgements
The authors gratefully acknowledge technical assistance from Kelly Leedham, Adam Perfrement, Jan Hosking, Rod Bambach, Zara Temple-Smith (NSW DPI), and Christian Brunk (QUT). This project was funded by NSW DPI and the GRDC, in conjunction with the Nitrous Oxide Research Program (NORP), which was funded by the Australian Department of Agriculture, Forests and Fisheries. We are indebted to Professor Peter Grace (QUT), the coordinator of NORP, and the other NORP network participants for their guidance and advice.
References
Allen DE, Kingston G, Rennenberg H, Dalal RC, Schmidt S (2008) Nitrous oxide emissions from sugarcane soils as influenced by waterlogging and split N fertiliser application. In ‘Proceedings 30th Annual Conference of the Australian Society of Sugar Cane Technologists’. Townsville, Qld. (Ed. RC Bruce) pp. 95–104. (Australian Society of Sugar Cane Technologists: Mackay, Qld)Barker-Reid F, Gates WP, Wilson KBR, Galbally IE, Meyer CP, Weeks IA, Eckard RJ (2005) Soil nitrous oxide emissions from rainfed wheat in SE Australia. In ‘Science, control, policy and implementation. Proceedings Fourth International Symposium on Non-CO2 Greenhouse Gases (NCGG-4)’. Utrecht, The Netherlands. (Ed. A van Amstel). (IOC Press: Amsterdam)
Barton L, Kiese R, Gatter D, Butterbach-Bahl K, Buck R, Hinz C, Murphy DV (2008) Nitrous oxide emissions from a cropped soil in a semi-arid climate. Global Change Biology. Bioenergy 14, 177–192.
Barton L, Murphy DV, Kiese R, Butterbach-Bahl K (2010) Soil nitrous oxide and methane fluxes are low from a bioenergy crop (canola) grown in a semi-arid climate. Global Change Biology. Bioenergy 2, 1–15.
| Soil nitrous oxide and methane fluxes are low from a bioenergy crop (canola) grown in a semi-arid climate.Crossref | GoogleScholarGoogle Scholar | 1:CAS:528:DC%2BC3cXms1antb0%3D&md5=d1c7d24d4264220dbb973917781d5336CAS |
Barton L, Butterbach-Bahl K, Kiese R, Murphy DV (2011) Nitrous oxide fluxes from a grain-legume crop (narrow-leafed lupin) grown in a semiarid climate. Global Change Biology 17, 1153–1166.
| Nitrous oxide fluxes from a grain-legume crop (narrow-leafed lupin) grown in a semiarid climate.Crossref | GoogleScholarGoogle Scholar |
Barton L, Murphy DV, Butterbach-Bahl K (2013) Influence of crop rotation and liming on greenhouse gas emissions from a semi-arid soil. Agriculture, Ecosystems & Environment 167, 23–32.
| Influence of crop rotation and liming on greenhouse gas emissions from a semi-arid soil.Crossref | GoogleScholarGoogle Scholar | 1:CAS:528:DC%2BC3sXktlGjt7c%3D&md5=87dba4171e0b58f15a0517d8d0d73e56CAS |
Barton L, Wolf B, Rowlings D, Scheer C, Kiese R, Grace P, Stefanova K, Butterbach-Bahl K (2015) Sampling frequency affects estimates of annual nitrous oxide fluxes. Scientific Reports 5, 15912
| Sampling frequency affects estimates of annual nitrous oxide fluxes.Crossref | GoogleScholarGoogle Scholar | 1:CAS:528:DC%2BC2MXhslKgsb%2FE&md5=9e294a6c60f85b158120f4387322e158CAS | 26522228PubMed |
Blair N, Crocker GJ (2000) Crop rotation effects on soil carbon and physical fertility of two Australian soils. Australian Journal of Soil Research 38, 71–84.
| Crop rotation effects on soil carbon and physical fertility of two Australian soils.Crossref | GoogleScholarGoogle Scholar |
Blair N, Faulkner RD, Till AR, Crocker GJ (2006) Long-term management impacts on soil C, N and physical fertility: Part III: Tamworth crop rotation experiment. Soil & Tillage Research 91, 48–56.
| Long-term management impacts on soil C, N and physical fertility: Part III: Tamworth crop rotation experiment.Crossref | GoogleScholarGoogle Scholar |
Blumenthal M, Umbers A, Day P (2008) ‘A responsible lead: an environmental plan for the Australian grains industry.’ (Grains Research and Development Corporation: Canberra, ACT). Available at http://www.grdc.com.au/uploads/documents/GRDC_Environmental_Plan.pdf [verified 28 May 2016]
Bremner JM (1997) Sources of nitrous oxide in soils. Nutrient Cycling in Agroecosystems 49, 7–16.
| Sources of nitrous oxide in soils.Crossref | GoogleScholarGoogle Scholar | 1:CAS:528:DyaK2sXmslCqs7Y%3D&md5=765c0e54cc956c83b7125ab88da26131CAS |
Burton DL, Zebarth BJ, Gillam KM, MacLeod JA (2008) Effect of split application of fertilizer nitrogen on N2O emissions from potatoes. Canadian Journal of Soil Science 88, 229–239.
| Effect of split application of fertilizer nitrogen on N2O emissions from potatoes.Crossref | GoogleScholarGoogle Scholar | 1:CAS:528:DC%2BD1cXmvV2lsbk%3D&md5=d5cb42fbee71113248eb75d89580932fCAS |
Chang C, Janzen HH, Cho CM, Nakonechny EM (1998) Nitrous oxide emission through plants. Soil Science Society of America Journal 62, 35–38.
| Nitrous oxide emission through plants.Crossref | GoogleScholarGoogle Scholar | 1:CAS:528:DyaK1cXhtlakurk%3D&md5=f854e43f831032703c97aaaff12303e9CAS |
Chen D, Suter HC, Islam A, Edis R (2010) Influence of nitrification inhibitors on nitrification and nitrous oxide (N2O) emission from a clay loam soil fertilized with urea. Soil Biology & Biochemistry 42, 660–664.
| Influence of nitrification inhibitors on nitrification and nitrous oxide (N2O) emission from a clay loam soil fertilized with urea.Crossref | GoogleScholarGoogle Scholar | 1:CAS:528:DC%2BC3cXis1Sgtrw%3D&md5=cb0fbf1d12401ca061462b81b933ca1fCAS |
Commonwealth of Australia (2015a) ‘National Inventory Report 2013. Vol. 1.’ (Commonwealth of Australia: Canberra, ACT)
Commonwealth of Australia (2015b) ‘Quarterly update of Australia’s National Greenhouse Gas Inventory: September 2014.’ (Commonwealth of Australia: Canberra, ACT)
Cresswell HP, Hamilton GJ (2002) Bulk density and pore space relations. In ‘Soil physical measurement and interpretation for land evaluation’. (Eds N McKenzie, K Coughlan, H Cresswell) pp. 35–58. (CSIRO Publishing: Melbourne)
Dalal RC, Wang WJ, Robertson GP, Parton WJ (2003) Nitrous oxide emission from Australian agricultural lands and mitigation options: a review. Australian Journal of Soil Research 41, 165–195.
| Nitrous oxide emission from Australian agricultural lands and mitigation options: a review.Crossref | GoogleScholarGoogle Scholar | 1:CAS:528:DC%2BD3sXktFKisr8%3D&md5=82cb3d74aaae67b11972b27b0ea300f6CAS |
Dalal RC, Allen DE, Livesley SJ, Richards G (2008) Magnitude and biophysical regulators of methane emission and consumption in the Australian agricultural, forest, and submerged landscapes: a review. Plant and Soil 309, 43–76.
| Magnitude and biophysical regulators of methane emission and consumption in the Australian agricultural, forest, and submerged landscapes: a review.Crossref | GoogleScholarGoogle Scholar | 1:CAS:528:DC%2BD1cXosVyhsrg%3D&md5=0afaa457a179510e05d70c7e3d93e097CAS |
De Antoni Migliorati M, Scheer C, Grace PR, Rowlings DW, Bell M, McGree J (2014) Influence of different nitrogen rates and DMPP nitrification inhibitor on annual N2O emissions from a subtropical wheat-maize cropping system. Agriculture, Ecosystems & Environment 186, 33–43.
| Influence of different nitrogen rates and DMPP nitrification inhibitor on annual N2O emissions from a subtropical wheat-maize cropping system.Crossref | GoogleScholarGoogle Scholar | 1:CAS:528:DC%2BC2cXmsVCjtbo%3D&md5=0844cd1e106bc3431f689d097fcc0b36CAS |
Denmead OT, Macdonald BCT, Bryant G, Naylor T, Wilson S, Griffith DWT, Wang WJ, Salter B, White I, Moody PW (2010) Emissions of methane and nitrous oxide from Australian sugarcane soils. Agricultural and Forest Meteorology 150, 748–756.
| Emissions of methane and nitrous oxide from Australian sugarcane soils.Crossref | GoogleScholarGoogle Scholar |
Doyle A, Shapland R (1991) Effect of split nitrogen applications on the yield and protein content of dryland wheat in northern New South Wales. Australian Journal of Experimental Agriculture 31, 85–92.
| Effect of split nitrogen applications on the yield and protein content of dryland wheat in northern New South Wales.Crossref | GoogleScholarGoogle Scholar | 1:CAS:528:DyaK3MXlvVaisL8%3D&md5=2f040166fd95a75ec1bbc2b186c6c401CAS |
Dutaur L, Verchot LV (2007) A global inventory of the soil CH4 sink. Global Biogeochemical Cycles 21, GB4013
Forster P, Ramaswamy V, Artaxo P, Berntsen T, Betts R, Fahey DW, Haywood J, Lean J, Lowe DC, Myhre G, Nganga J, Prinn R, Raga G, Schulz M, Van Dorland R (2007) Changes in atmospheric constituents and in radiative forcing. In ‘Climate change 2007: The physical science basis. Contribution of Working Group I to the Fourth Assessment Report of the Intergovernmental Panel on Climate Change’. (Eds S Solomon, D Qin, M Manning, Z Chen, M Marquis, KB Averyt, M Tignor, HL Miller). (Cambridge University Press: Cambridge, UK, and New York)
Gunasekera D, Kim Y, Tulloh C, Ford M (2007) Climate change – impacts on Australian agriculture. Australian Commodities: Forecasts and Issues 14, 657–676.
Herridge DF (2011) ‘Managing legume and fertiliser N for northern grains cropping.’ (Grains Research and Development Corporation: Canberra, ACT)
Holford ICR, Schweitzer BE, Crocker GJ (1998) Comparative effects of subterranean clover, medic, lucerne, and chickpea in wheat rotations, on nitrogen, organic carbon, and moisture in two contrasting soils. Soil Research 36, 57–72.
| Comparative effects of subterranean clover, medic, lucerne, and chickpea in wheat rotations, on nitrogen, organic carbon, and moisture in two contrasting soils.Crossref | GoogleScholarGoogle Scholar |
Hütsch BW, Webster CP, Powlson DS (1993) Long-term effects of nitrogen fertilization on methane oxidation in soil of the broadbalk wheat experiment. Soil Biology & Biochemistry 25, 1307–1315.
| Long-term effects of nitrogen fertilization on methane oxidation in soil of the broadbalk wheat experiment.Crossref | GoogleScholarGoogle Scholar |
International Atomic Energy Agency (IAEA) (2000) ‘Optimizing nitrogen fertilizer application to irrigated wheat: Results of a co-ordinated research project organized by the Joint FAO/IEAEA Division of Nuclear Techniques in Food and Agriculture 1994–1998.’ (International Atomic Energy Agency: Vienna). Available at http://www-pub.iaea.org/MTCD/publications/PDF/te_1164_prn.pdf [verified 28 May 2016]
IPCC (2006) ‘2006 IPCC guidelines for national greenhouse gas inventories. Volume 4. Agriculture, forestry and other land use.’ (Eds HS Eggleston, L Buendia, K Miwa T Ngara, K Tanabe). (Institute for Global Environmental Strategies: Hayama, Japan)
Isbell RF (2002) ‘The Australian soil classification.’ Revised edn. (CSIRO Publishing: Melbourne)
Le Mer J, Roger P (2001) Production, oxidation, emission and consumption of methane by soils: A review. European Journal of Soil Biology 37, 25–50.
| Production, oxidation, emission and consumption of methane by soils: A review.Crossref | GoogleScholarGoogle Scholar | 1:CAS:528:DC%2BD3MXjvFOnsbs%3D&md5=f30bc8b29fc377943386b84ca7a057cfCAS |
Li Y, Chen D, Barker-Reid F, Eckard R (2008) Simulation of N2O emissions from rain-fed wheat and the impact of climate variation in southeastern Australia. Plant and Soil 309, 239–251.
| Simulation of N2O emissions from rain-fed wheat and the impact of climate variation in southeastern Australia.Crossref | GoogleScholarGoogle Scholar | 1:CAS:528:DC%2BD1cXosVyhsrc%3D&md5=a22a5df01056230c50b4d005a6311020CAS |
Liu C, Wang K, Zheng X (2013) Effects of nitrification inhibitors (DCD and DMPP) on nitrous oxide emission, crop yield and nitrogen uptake in a wheat–maize cropping system. Biogeosciences 10, 2427–2437.
| Effects of nitrification inhibitors (DCD and DMPP) on nitrous oxide emission, crop yield and nitrogen uptake in a wheat–maize cropping system.Crossref | GoogleScholarGoogle Scholar | 1:CAS:528:DC%2BC2cXltlGktLg%3D&md5=7ae6f766dbe0c2a108f66906ecb09266CAS |
Menéndez S, Barrena I, Setien I, González-Murua C, Estavillo JM (2012) Efficiency of nitrification inhibitor DMPP to reduce nitrous oxide emissions under different temperature and moisture conditions. Soil Biology & Biochemistry 53, 82–89.
| Efficiency of nitrification inhibitor DMPP to reduce nitrous oxide emissions under different temperature and moisture conditions.Crossref | GoogleScholarGoogle Scholar |
Officer SJ, Phillips F, Armstrong R, Kelly K (2008) Nitrous oxide emissions from dry-land wheat in south-eastern Australia. In ‘Global issues paddock action. Proceedings 14th Australian Agronomy Conference’. Adelaide, South Australia. (Australian Society of Agronomy, The Regional Institute: Gosford, NSW). Available at http://www.regional.org.au/au/asa/2008/poster/farming-uncertain-climate/5831_officersj.htm [verified 28 May 2016]
Officer SF, Phillips F, Armstrong R, Graham C (2010) Nitrogen fertiliser increases nitrous oxide emissions from a semi arid Vertosol. In ‘Proceedings 19th World Congress of Soil Science’. Brisbane, Qld. (Eds RJ Gilkes, N Prakongkep) pp. 168–171. (International Union of Soil Sciences: Vienna)
Ogle S, Olander L, Wollenberg L, Rosenstock T, Tuniello F, Paustian K, Buendia L, Nihart A, Smith P (2014) Reducing greenhouse gas emissions and adapting agricultural management for climate change in developing countries: providing the basis for action. Global Change Biology 20, 1–6.
| Reducing greenhouse gas emissions and adapting agricultural management for climate change in developing countries: providing the basis for action.Crossref | GoogleScholarGoogle Scholar | 23966231PubMed |
Pedersen AR, Petersen SO, Schelde K (2010) A comprehensive approach to soil-atmosphere trace-gas flux estimation with static chambers. European Journal of Soil Science 61, 888–902.
| A comprehensive approach to soil-atmosphere trace-gas flux estimation with static chambers.Crossref | GoogleScholarGoogle Scholar |
Plaza-Bonilla D, Cantero-Martínez C, Bareche J, Arrúe J, Álvaro-Fuentes J (2014) Soil carbon dioxide and methane fluxes as affected by tillage and N fertilization in dryland conditions. Plant and Soil 381, 111–130.
| Soil carbon dioxide and methane fluxes as affected by tillage and N fertilization in dryland conditions.Crossref | GoogleScholarGoogle Scholar | 1:CAS:528:DC%2BC2cXmvV2ltLc%3D&md5=cd003df9960748c92a2d40f0c3fb994eCAS |
Rodriguez D, Probert M, Meyer M, Galbally I, Howden M, Bennett A, Nussey R, Chen D, Strong W (2003) ‘Background study into greenhouse gas emissions from the grains industry (DAV478).’ (Grains Research and Development Corporation: Canberra, ACT). Available at http://www.greenhouse.unimelb.edu.au/pdf_files/GHGGrainsEmissions.pdf [verified 28 May 2016]
Scheer C, Grace PR, Rowlings DW, Kimber S, Van Zwieten L (2011) Effect of biochar amendment on the soil-atmosphere exchange of greenhouse gases from an intensive subtropical pasture in northern New South Wales, Australia. Plant and Soil 345, 47–58.
| Effect of biochar amendment on the soil-atmosphere exchange of greenhouse gases from an intensive subtropical pasture in northern New South Wales, Australia.Crossref | GoogleScholarGoogle Scholar | 1:CAS:528:DC%2BC3MXptFymt7o%3D&md5=035eaf908fa5f45f19e185ef59a541bbCAS |
Scheer C, Grace P, Rowlings D, Payero J (2012) Nitrous oxide emissions from irrigated wheat in Australia: impact of irrigation management. Plant and Soil 359, 351–362.
| Nitrous oxide emissions from irrigated wheat in Australia: impact of irrigation management.Crossref | GoogleScholarGoogle Scholar | 1:CAS:528:DC%2BC38XhtlGmsrrJ&md5=0a0042c45a025374b5e699c821e096f1CAS |
Scheer C, Rowlings DW, Firrel M, Deuter P, Morris S, Grace PR (2014) Impact of nitrification inhibitor (DMPP) on soil nitrous oxide emissions from an intensive broccoli production system in sub-tropical Australia. Soil Biology & Biochemistry 77, 243–251.
| Impact of nitrification inhibitor (DMPP) on soil nitrous oxide emissions from an intensive broccoli production system in sub-tropical Australia.Crossref | GoogleScholarGoogle Scholar | 1:CAS:528:DC%2BC2cXht12ntL3M&md5=ee89302220febfea18060a4a6d021cc2CAS |
Scheer C, Rowlings DW, De Antoni Migliorati M, Lester DW, Bell MJ, Grace PR (2016) Effect of enhanced efficiency fertilizers on nitrous oxide emissions in a sub-tropical cereal cropping system. Soil Research 54, 544–551.
| Effect of enhanced efficiency fertilizers on nitrous oxide emissions in a sub-tropical cereal cropping system.Crossref | GoogleScholarGoogle Scholar |
Scherbak I, Millar N, Robertson GP (2014) Global metaanalysis of the nonlinear response of soil nitrous oxide (N2O) emissions to fertilizer nitrogen. Proceedings of the National Academy of Sciences of the United States of America 111, 9199–9204.
| Global metaanalysis of the nonlinear response of soil nitrous oxide (N2O) emissions to fertilizer nitrogen.Crossref | GoogleScholarGoogle Scholar |
Schwenke GD, Haigh BM (2016) The interaction of seasonal rainfall and nitrogen fertiliser rate on soil N2O emission rate, total N loss and crop yield of dryland sorghum and sunflower grown on sub-tropical Vertosols. Soil Research 54, 604–618.
| The interaction of seasonal rainfall and nitrogen fertiliser rate on soil N2O emission rate, total N loss and crop yield of dryland sorghum and sunflower grown on sub-tropical Vertosols.Crossref | GoogleScholarGoogle Scholar |
Schwenke GD, Herridge DF, Scheer C, Rowlings DW, Haigh BM, McMullen KG (2015) Soil N2O emissions under N2-fixing legumes and N-fertilised canola: A reappraisal of emissions factor calculations. Agriculture, Ecosystems & Environment 202, 232–242.
| Soil N2O emissions under N2-fixing legumes and N-fertilised canola: A reappraisal of emissions factor calculations.Crossref | GoogleScholarGoogle Scholar | 1:CAS:528:DC%2BC2MXhtVOgsL4%3D&md5=5e74db16ebc6b862a9ac74b9a0396a34CAS |
Shcherbak I, Grace P (2014) Determination of emission factors for estimating fertiliser-induced nitrous oxide emissions from Australia’s rural production systems. Report to the Australian Department of the Environment.
Syamsul Arif MA, Houwen F, Verstraete W (1996) Agricultural factors affecting methane oxidation in arable soil. Biology and Fertility of Soils 21, 95–102.
| Agricultural factors affecting methane oxidation in arable soil.Crossref | GoogleScholarGoogle Scholar | 1:CAS:528:DyaK28XhtVSisLg%3D&md5=88ba18435f75e3e45b5cf7b2b1deab73CAS |
Van Groenigen JW, Velthof GL, Oenema O, Van Groenigen KJ, Van Kessel C (2010) Towards an agronomic assessment of N2O emissions: a case study for arable crops. European Journal of Soil Science 61, 903–913.
| Towards an agronomic assessment of N2O emissions: a case study for arable crops.Crossref | GoogleScholarGoogle Scholar | 1:CAS:528:DC%2BC3MXks1Gr&md5=eeb4cb3f453a9f9bab1a9285109f287cCAS |
Venterea RT, Coulter JA (2015) Split application of urea does not decrease and may increase nitrous oxide emissions in rainfed corn. Agronomy Journal 107, 337–348.
| Split application of urea does not decrease and may increase nitrous oxide emissions in rainfed corn.Crossref | GoogleScholarGoogle Scholar |
Wang W, Dalal RC, Reeves SH, Butterbach-Bahl K, Kiese R (2011) Greenhouse gas fluxes from an Australian subtropical cropland under long-term contrasting management regimes. Global Change Biology 17, 3089–3101.
| Greenhouse gas fluxes from an Australian subtropical cropland under long-term contrasting management regimes.Crossref | GoogleScholarGoogle Scholar |
Webb AA, Grundy MJ, Powell B, Littleboy M (1997) The Australian sub-tropical cereal belt: soils, climate and agriculture. In ‘Sustainable crop production in the sub-tropics: an Australian perspective’. (Eds AL Clarke, PB Wylie) pp. 8–26. (Queensland Department of Primary Industries: Brisbane, Qld)
Weier KL (1999) N2O and CH4 emission and CH4 consumption in a sugarcane soil after variation in nitrogen and water application. Soil Biology & Biochemistry 31, 1931–1941.
| N2O and CH4 emission and CH4 consumption in a sugarcane soil after variation in nitrogen and water application.Crossref | GoogleScholarGoogle Scholar | 1:CAS:528:DyaK1MXntVOitb0%3D&md5=89a90fa50e7c1a682e5539149248b5aeCAS |
Weiske A, Benckiser G, Ottow JG (2001) Effect of the new nitrification inhibitor DMPP in comparison to DCD on nitrous oxide (N2O) emissions and methane (CH4) oxidation during 3 years of repeated applications in field experiments. Nutrient Cycling in Agroecosystems 60, 57–64.
| Effect of the new nitrification inhibitor DMPP in comparison to DCD on nitrous oxide (N2O) emissions and methane (CH4) oxidation during 3 years of repeated applications in field experiments.Crossref | GoogleScholarGoogle Scholar | 1:CAS:528:DC%2BD38Xkt1Sitw%3D%3D&md5=a92d5213be9945db80a188cff47c99f7CAS |
Young R, Wilson BR, McLeod M, Alston C (2005) Carbon storage in the soils and vegetation of contrasting land uses in northern New South Wales, Australia. Australian Journal of Soil Research 43, 21–31.
| Carbon storage in the soils and vegetation of contrasting land uses in northern New South Wales, Australia.Crossref | GoogleScholarGoogle Scholar | 1:CAS:528:DC%2BD2MXhtl2ku7c%3D&md5=bb043f9e506fc07bae4bd8214d65269dCAS |
Zadoks JC, Chang TT, Konzak CF (1974) A decimal code for the growth stages of cereals. Weed Research 14, 415–421.
| A decimal code for the growth stages of cereals.Crossref | GoogleScholarGoogle Scholar |
Zebarth BJ, Rochette P, Burton DL, Price M (2008) Effect of fertilizer nitrogen management on N2O emissions in commercial corn fields. Canadian Journal of Soil Science 88, 189–195.
| Effect of fertilizer nitrogen management on N2O emissions in commercial corn fields.Crossref | GoogleScholarGoogle Scholar | 1:CAS:528:DC%2BD1cXmvV2lsLc%3D&md5=4e9c3c5f27539ac7590b70ff4ddb7ffdCAS |