

Digital mapping of soil erodibility for water erosion in New South Wales, Australia
Xihua Yang A C , Jonathan Gray A , Greg Chapman A , Qinggaozi Zhu B , Mitch Tulau A and Sally McInnes-Clarke AA New South Wales Office of Environment and Heritage, PO Box A290, Sydney South, NSW 1232, Australia.
B School of Life Sciences, University of Technology, Sydney, Australia.
C Corresponding author. Email: xihua.yang@environment.nsw.gov.au
Soil Research 56(2) 158-170 https://doi.org/10.1071/SR17058
Submitted: 14 February 2017 Accepted: 31 July 2017 Published: 13 October 2017
Journal compilation © CSIRO 2018 Open Access CC BY-NC-ND
Abstract
Soil erodibility represents the soil’s response to rainfall and run-off erosivity and is related to soil properties such as organic matter content, texture, structure, permeability and aggregate stability. Soil erodibility is an important factor in soil erosion modelling, such as the Revised Universal Soil Loss Equation (RUSLE), in which it is represented by the soil erodibility factor (K-factor). However, determination of soil erodibility at larger spatial scales is often problematic because of the lack of spatial data on soil properties and field measurements for model validation. Recently, a major national project has resulted in the release of digital soil maps (DSMs) for a wide range of key soil properties over the entire Australian continent at approximately 90-m spatial resolution. In the present study we used the DSMs and New South Wales (NSW) Soil and Land Information System to map and validate soil erodibility for soil depths up to 100 cm. We assessed eight empirical methods or existing maps on erodibility estimation and produced a harmonised high-resolution soil erodibility map for the entire state of NSW with improvements based on studies in NSW. The modelled erodibility values were compared with those from field measurements at soil plots for NSW soils and revealed good agreement. The erodibility map shows similar patterns as that of the parent material lithology classes, but no obvious trend with any single soil property. Most of the modelled erodibility values range from 0.02 to 0.07 t ha h ha–1 MJ–1 mm–1 with a mean (± s.d.) of 0.035 ± 0.007 t ha h ha–1 MJ–1 mm–1. The validated K-factor map was further used along with other RUSLE factors to assess soil loss across NSW for preventing and managing soil erosion.
Additional keywords: digital soil maps, geographic information system (GIS), hillslope erosion, Revised Universal Soil Loss Equation (RUSLE).
Introduction
Hillslope erosion (or sheet and rill erosion in combination) is the detachment and transport of soil by raindrop impact and overland flow, which is a major form of soil erosion in Australia and many parts of the world. Hillslope erosion removes fertile topsoil that contains most of the soil’s plant nutrients and soil micro-organisms that contribute to soil health. Subsequent increases in sediment concentration and deposition may cause environmental and water quality degradation in rivers, lakes and reservoirs (Sekhar and Rao 2002). Severe hillslope erosion is also associated with loss of soil carbon and biodiversity (Lal and Pimental 2008; Olson et al. 2016).
Various soil erosion models are available for different purposes, but for the questions of broad-scale resource use, the simplest and generally most appropriate model is the Universal Soil Loss Equation (USLE; Wischmeier and Smith 1978) model and its derivative, the Revised Universal Soil Loss Equation (RUSLE; Renard et al. 1997) or its modified version in Australia, SOILOSS (Rosewell 1993). These models have been now widely used to estimate soil loss in a wide variety of land use conditions across Australia (e.g. Lu et al. 2003; Teng et al. 2016) and all over the world (e.g. Panagos et al. 2014; Belasri and Lakhouili 2016). When using the USLE or RUSLE, the component factors relating to rainfall erosivity (R-factor; MJ mm h–1 ha–1 year–1), topography (LS-factor; dimensionless), soil erodibility (K-factor; t ha h ha–1 MJ–1 mm–1), ground cover (C-factor; dimensionless) and soil conservation practices (P-factor; dimensionless) are multiplied to calculate the long-term average annual soil loss per unit area.
The soil erodibility or K-factor is an essential parameter in erosion prediction and conservation planning. The soil erodibility (K) factor represents: (1) the susceptibility of soil or surface material to erosion; (2) the transportability of the sediment; and (3) the amount and rate of run-off given a particular rainfall input, as measured under a standard set of conditions. Four major soil properties have been identified that govern erodibility: texture (particle size distribution), structure, organic matter content and permeability (USDA 2013). For a particular soil, the soil erodibility factor is the rate of erosion per unit erosion index from a standard plot. The K-factor reflects the fact that different soils erode at different rates when the other factors that affect erosion are the same.
Coarse-textured soils, such as sandy soils, have low K-factors because of low run-off, even though these soils are easily detached. Medium-textured soils, such as the silt loam soils, have moderate K-factors because they are moderately susceptible to detachment and they produce moderate run-off. Soils with a high silt content are especially susceptible to erosion and have high K-factors. These soils are easily detached and they tend to crust and produce large amounts and rates of run-off. Soil clay content, particularly the percentage of particles <125 µm (100P125) at the soil surface following wetting by rain (minimum dispersing of natural soil aggregates), affects wet sediment density (Loch et al. 1998), and it has even been suggested that 100P125 could provide a surrogate for the particle size parameter (M) to improve the prediction of K-factors for all Australian soils (Rosewell and Loch 2002; Lu et al. 2003).
Organic matter in the soil reduces soil erodibility because it produces compounds that bind soil particles together, reducing the susceptibility of the soil to detachment by raindrop impact and surface run-off. In addition, organic matter increases aggregation in the soil, which increases infiltration and reduces run-off and thus erosion. Land use, such as that involving the growth of plant roots and incorporation of organic material into the soil, affects soil erodibility. The results of Saha et al. (2007) show that land surface organic coating and the root system of plants increase soil organic carbon and aggregation and, by improving water transfer and permeation, decrease soil erodibility. In RUSLE, such effects are considered in the cover management factor as prior land use (PLU) and surface cover (SC) subfactors (Yang 2014).
The permeability of a soil is the ability of water to move through it (permeate it) and depends on the physical and chemical properties of the soil, notably particle size distribution (the range of particle sizes present), porosity, pore size distribution and pore continuity. Permeability of the soil profile affects K because it affects run-off, and it is commonly measured in terms of the rate of water flow through the soil in a given period of time, usually expressed as a permeability rate in millimetres per hour. Permeability can also be affected by plant growth and land management.
Soil structure describes the arrangement of the solid parts of the soil and of the pore spaces located between them. Soil structure affects K because it affects detachment and infiltration. Good soil structure and high aggregate stability are important for improving soil fertility, enhancing porosity and decreasing erodibility (Bronick and Lal 2005).
Rock fragments can have a major effect on soil erosion. Rock fragments on the surface act as surface cover and reduce soil loss, like other surface cover, such as crop residue and plant litter. Rocks in the soil can reduce permeability and increase run-off, which increases erosion. The United States Agriculture Handbook Vol. 537 (Wischmeier and Smith 1978) separates the effects of stone fragments into two components: (1) surface rock fragments that can further reduce the splash detachment rate in a similar way to how vegetation protects soils from rainfall intensity; and (2) subsurface rock fragments that lead to increased soil loss due to reduced water infiltration.
Climate also affects soil erodibility and its seasonal variation. Various empirical studies have measured erodibility in a temporal context, such as the work of Knapen et al. (2007). Temporal variations in K-factors can be explained primarily by variations in soil moisture content, but consolidation effects, root growth, residue decomposition and the presence of microbiotic soil crusts all play a role as well.
Direct measurement of the erodibility factor for the RUSLE is both costly and time consuming because it requires long-term erosion measurement on field plots; in Australia, it has only been feasible for a few soils in New South Wales (NSW) and Queensland (Rosewell and Loch 2002). Numerous attempts have been made to simplify the costly technique and to estimate the soil erodibility from readily available soil property data (e.g. Wischmeier et al. 1971; Renard et al. 1997; Wang et al. 2016). To date, several soil erodibility models have been developed and used widely around the world, such as the USLE or the soil erodibility nomograph (Wischmeier and Smith 1978), RUSLE (Renard et al. 1997), the Erosion Productivity Impact Calculator (EPIC; Sharply and Williams 1990), the geometric mean diameter (Dg)-based model (Römkens et al. 1988) and its revised version with the addition of the organic matter component (Dg-OM; Wang et al. 2016). Because most of those models were developed on the basis of American soil conditions, we need to assess their applicability in a given group of soils at specific geographical locations outside the US. Some efforts have been made to compare models for specific regions or conditions, such as in Iraq (Hussein et al. 2007), Chile (Bonilla and Johnson 2012) and China (Zhang et al. 2008), but results vary depending on the location and the scales (Römkens et al. 1988; Torri et al. 1997, 2002).
A comparison of some point-based measurements from Australian agricultural soils and those estimated using the nomograph showed that the nomograph provided reasonable results for cultivated soils low in clay content, but performed poorly for aggregated clay soils (Rosewell and Loch 2002; Silburn 2011). Despite some continent-scale applications of RUSLE in Australia (e.g. Lu et al. 2003; Teng et al. 2016), the K-factor values from these studies have never been validated due to lack of reliable soil property data.
Recently, a major national project has resulted in the release of the Soil and Landscape Grid of Australia (SLGA 2017). This includes digital soil maps (DSMs) for a wide range of key soil properties over the entire Australian continent at a spatial resolution of 3 arcseconds (~90 m), with six depth intervals down to 2 m (Grundy et al. 2015). Associated maps presenting upper and lower 95% confidence level predictions are also provided with SLGA (2017). The DSMs provide the necessary soil property information for estimating the erodibility K-factor including soil texture, bulk density and organic carbon. Further DSMs for a range of soil properties over NSW have recently been prepared using the Soil and Land Information System (SALIS) data (Office of Environment & Heritage (OEH) 2017a). These maps are at a resolution of 100 m and cover six soil depth intervals down to 2 m (OEH 2017b), consistent with the SLGA.
The aims of the present study were to assess several existing methods or maps on erodibility estimation and produce a seamless high-resolution soil erodibility map for the entire state of NSW (with an area of 809 444 km2) using the most recent SALIS data and DSMs at various depths (down to 100 cm). The digital soil erodibility map was validated with available field plots data and further used along with other RUSLE factors to assess soil loss across NSW.
Materials and methods
Soil erodibility estimates
Eight methods for estimating soil erodibility were assessed, namely the USLE (Wischmeier and Smith 1978), RUSLE (Renard et al. 1997), SOILOSS (Rosewell 1993), Dg (Römkens et al. 1988), Dg-OM (Wang et al. 2016), a look-up table (LUT) method based on the great soil group (GSG) map, an approach based on bioturbation and geomorphic extension of soil formation factors (D50) and the Australian K-factor map produced by CSIRO (K_CSIRO) based on the soil visible–near infrared spectroscopic database (Teng et al. 2016).
USLE estimates
The K-factor value based on the USLE (K_USLE) was estimated based on basic soil property variables (Wischmeier et al. 1971; Wischmeier and Smith 1978) for those cases where the silt fraction does not exceed 70% using Eqn 1:
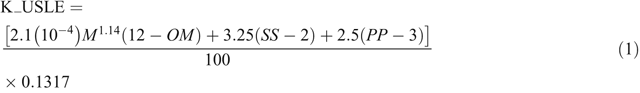
where OM is the percentage soil organic matter (= soil organic carbon × 1.72), SS is the soil structure code, PP is the soil profile permeability class referring to the rate of infiltration of water into the whole soil profile, and M is the particle size parameter that defines the relationship between the percentage of silt, very fine sand and clay content, calculated as follows:

where Silt is the percentage silt (0.002–0.05 mm) content, with most NSW soils having a silt fraction <68% (Rosewell 1993), VFS is the percentage of very fine sand (0.05–0.1 mm) and Clay is the percentage clay (<0.002 mm) content based on USDA (2013) classification. The K-factor expressed in US customary units (t ac h ac–1 ft-tf–1 in–1) is converted to SI units (t ha h ha–1 MJ–1 mm–1) by multiplying by 0.1317.
There are four SS and six PP classes (Rosewell and Loch 2002) and these classes are described as below:
-
SS Class 1: very fine granular, where particles are mostly <1 mm in diameter;
-
SS Class 2: fine granular, where particles are mostly 1–2 mm in diameter;
-
SS Class 3: medium or coarse granular, where particles are mostly 2–10 mm in diameter;
-
SS Class 4: blocky, platy or massive;
-
PP Class 1: rapid, >130 mm h–1;
-
PP Class 2: moderate to rapid, 60–130 mm h–1;
-
PP Class 3: moderate, 20–60 mm h–1;
-
PP Class 4: slow to moderate, 5–20 mm h–1;
-
PP Class 5: slow, 1–5 mm h–1; and
-
PP Class 6: very slow, <1 mm h–1.
Both SS and PP classes were derived from GSG through LUT with reference to the SOILOSS program (Rosewell 1993). For example, PP Class 3 is usually for soils where the subsoil structure grade is moderate or strong or where the texture is coarser than silty clay. Soils that have moderately permeable topsoils underlain by silty clays or silty clay loams with weak subangular or angular blocky structures are usually Class 4. Permeable surface soils overlying massive clays or silty clays are usually Class 5 (Murphy et al. 1998).
RUSLE estimates
The K-factor estimated based on RUSLE (K_RUSLE) is similar to that estimated using USLE except that in RUSLE the K-factors vary during the year rather than remaining constant. RUSLE2 (USDA 2013) computes a monthly value for soil erodibility based on monthly precipitation and monthly temperature. The 10-year storm erosion index (EI) along with slope steepness is recommended in RUSLE2 to compute the reduction in erosivity by ponding (USDA 2013). There is also a change in the calculation of the soil structure subfactor (Ks), as follows:

SOILOSS estimates
The K-factor based on SOILOSS (K_SOILOSS; Rosewell 1993) was modified from USLE for NSW soils containing <68% silt plus very fine sand as follows:

Dg estimates
The K-factor based on the Dg model (K_Dg; Renard et al. 1997) is defined in Eqn 5:

where Dg is the geometric mean diameter of the soil particles (mm) and is calculated using Eqn 6:

where fi is the weight percentage of the particle size fraction, mi is the arithmetic mean of the particle size limits (mm), and n is the number of particle size classes. Constants used for the calculation of the parameter Dg, in the case of three basic textural classes (clay, sand, silt) were adapted from Borselli et al. (2012).
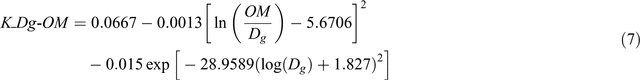
Dg-OM estimates
An improved Dg model with soil organic matter, namely the Dg-OM model (Wang et al. 2016), was also used to estimate K (K_Dg-OM), as follows:
GSG estimates
The K-factor from GSG soil types (K_GSG) was produced based on an LUT using the most recent GSG map (OEH 2017c) that provides soil types across NSW using the GSG classification system (Stace et al. 1968). The LUT was developed based on expert knowledge with reference to the SALIS database. Each of the GSG classes (52 in total) represented in the map was allocated an erodibility value based first on published literature values in NSW (e.g. Lu et al. 2003; Rosewell 1993), then on laboratory values and soil surveys provided in soil landscape reports, and finally on soil texture, structure and permeability levels based on NSW SALIS. An LUT was developed and used to assign a corresponding K-factor value to each GSG (against total 38 858 polygons). Simultaneously, local soil survey experts double-checked the entire GSG mapping coverage to ensure correct allocation of the dominant groups. These processes iterate and make adjustments for GSG outliers and anomalies.
D50 estimates
The D50-derived K factor (K_D50) is based on the hypothesis that the difference in soil texture between topsoil and subsoil is related to long-term soil erodibility (Paton et al. 1995). This assumes that, other factors being equal, sites with highly contrasting topsoil and subsoil textures would be expected to have had greater removal of fine-grained bioturbated surface materials by slope -wash processes than sites with less erodible soil materials. K_D50 values were produced from DSMs based on the difference between the geometric mean diameter of the soil particles for 0–30 and 30–100 cm soil depths as a texture contrast parameter (Paton et al. 1995).
CSIRO estimates
CSIRO scientists (Teng et al. 2016) used an Australian soil visible–near infrared spectroscopic database to estimate soil properties (i.e. sand, silt, clay and organic carbon content) based on the USLE method (Wischmeier and Smith 1978). A digital map of K-factors (referred to herein as K_CSIRO) was produced for the entire Australia land mass at a spatial resolution of ~90 m; that map was obtained and used in the present study for comparison.
The required input data for the estimates detailed above are presented in Fig. 1 and their sources and statistics are listed in Table 1. The above methods have been implemented in a geographical information system (ESRI’s ArcGIS) using automated scripts so that all the processes are automated, fast and repeatable.

|

|
Validation
The validation dataset, consisting of soil loss and erodibility data measured from erosion plots, includes five different soil reference groups, namely Chromosols, Vertosols, Ferrosols, Kandosols, Rudosols/Tenosols, and Sodosols based on the Australian Soil Classification (Isbell 2002). The equivalent soils according to the World Reference Base (WRB) for Soil Resources (IUSS Working Group WRB 2015) are Luvisols, Vertisols, Phaeozems/Nitisols, Umbrisols, Leptosol, and Solonetz, all together representing more than 60% of NSW soils by area. Soils plots representing these soils are located at six Soil Conservation Research Centres across NSW (Cowra, Gunnedah, Inverell, Scone, Wagga Wagga and Wellington). The plots were 42 m long, with slopes ranging 7–11% with various treatments (Rosewell 1993). These plots were maintained under continuous bare fallow and exposed to natural rainfall during the experiment period (Edwards 1987), but changed to pasture or other land uses later on. Periods of measurement ranged from 4 to 30 years, resulting in at least 4500 plot-years of records (Edwards 1987). This represents probably the largest body of such data outside the US, and provides a means of independently evaluating the usefulness and accuracy of the various soil loss prediction models that are available. The measured soil loss was normalised to the USLE unit plots of 22.1 m and 9% slope. The K-factor was then obtained from K = A/R, where A is the normalised soil loss (t ha–1) and R is the total rainfall erosivity for the same period (MJ mm ha–1 h–1). These plot experiments provided 15 data points for K-factor values that commonly vary from 0.015 to 0.055, differing by a factor of 3.7. Comparisons between these measurements and the soil erodibility nomograph showed reasonable agreement (Rosewell 1993). In addition, 12 new soil plots were installed in early 2014 in the Warrumbungle National Park (WNP), mostly on Rudosols and Tenosols according to the WRB, for the bushfire recovery research project. These plots were based on a smaller size of 8 m2 as recommended in Riley et al. (1981) for easy and inexpensive installation in the mountainous area. Soil particle size, sediment weight, soil texture, organic matter and rain gauge data were collected during regular visits (approximately every 2 months), providing supplementary estimates of K-factor values. Although there are many limitations in these reference data, such as plot sizes and periods of measurement, these plot data, when normalised to USLE plot unit, still provide meaningful comparisons for estimations of K-factor values in that area. Table 2 lists the basic information for the soil plot sites and the K-factor values. Other RUSLE factors are derived from Yang (2014; for the C-factor), Yang (2015; for the LS-factor) and Yang and Yu (2015; for the R-factor).

|
Model performance, and hence its predictive capacity, was measured by the coefficient of efficiency (Ec; Nash and Sutcliffe 1970):

where yi and  are observed and modelled values respectively,
  is the average of observed values and M is sample size. Essentially, Ec is an indicator of how close the scatters of predicted versus actual values are to the 1 : 1 line, which can be considered as a measure of model efficiency. Values of Ec vary from –∞ to 1, and the closer values are to 1, the stronger the model. We chose Ec because it was commonly used to assess model performance in related studies (e.g. Yang 2015). The common coefficient of determination (R2) and relative errors were also used to test model performance by comparing plot values with predicted values estimated by all models described above.
Results and Discussion
Performance of soil erodibility estimates
In general, the K-factor maps derived using the different estimators are very different, both in patterns and values. Visual examination shows that the K_USLE, K_RUSLE and K_SOILOSS have similar patterns, as expected from the similarities in their formulae (Fig. 2).

|
Fig. 3 shows comparisons of mean K-factor values from field plot measurements with those from different estimators or sources. K_Dg not only underestimates the K-factor values, but also shows a negative correlation with the soil plots measurements, with values concentrated in the range 0.01–0.02. The improved Dg model with soil organic matter (K_Dg-OM) did show some improvement (R2 = 0.438) but it overestimated the K values. K_D50 and K_GSG are sparsely distributed with little correlation with the measured values (R2 < 0.21 and Ec negative). It is not surprising that the geometric mean-based methods (Dg and D50) do not predict soil erodibility very well, because particle size distribution alone is only a very coarse measure of soil erodibility and the K-factor is correlated to many other soil properties (Bonilla and Johnson 2012). K_CSIRO (Teng et al. 2016) showed a positive and good correlation with the soil plots measurements, but the K-factor values were mostly concentrated in the range 0.027–0.031 for these plot sites; even state-wide, the variation was only ~0.016 (range 0.020–0.036 across NSW). The USLE-based estimators (K_USLE, K_RUSLE and K_SOILOSS) show similar distributions along the 1 : 1 line for observed data and predicted values. The predicted values all fall in a similar range to the observed values in the range 0.005–0.070, with a strong positive correlation between the two. The comparison demonstrates that K_RUSLE is the most accurate estimator (as it is closer to the 1 : 1 line) for NSW soil erodibility compared with the other existing methods.

|
Further improvement
Studies on Australian soils show that there is considerable improvement in the prediction of erodibility when wet sediment density is taken into account (Loch and Rosewell 1992), with a modified K-factor (Km) for sediment density (Loch et al. 1998):

where Sand is the percentage of sand (>0.02 mm) that could be used to estimate wet sediment density, as recommended by Loch and Rosewell (1992). Following on from this idea and the above comparisons, a final K-factor GIS raster layer for NSW was produced based on the Km from K_RUSLE, and further adjusted with rock fragment content, referred to as K_St. This is based on the negative relationship between stone cover and the relative inter-rill sediment yield. This negative relationship is generally observed where stones are either partly embedded in the top layer or are on the surface of the soil. The soil erodibility reduction factor is expressed as an exponential decay function based on experimental field data (Poesen et al. 1994):

where St is the correction factor for the relative decrease in sediment yield and Rc is the percentage of stone cover, with 10% < Rc <100%. The updated soil erodibility value (K_St) incorporating surface stone cover, derived from SALIS, was calculated as follows:

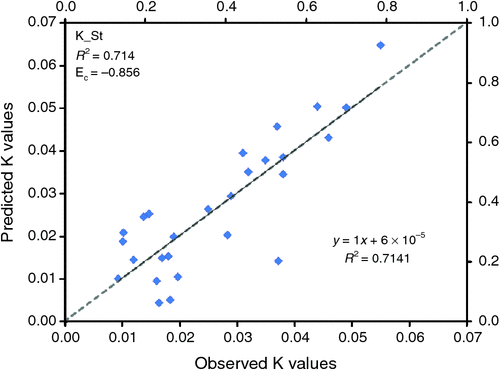
The final K-factor GIS raster layer, at a spatial resolution of 90 m (<1 ha in area), was produced based on the improved methods (Fig. 4). The improved K-factor prediction reached an even higher correlation (R2 = 0.714) and was closer to the 1 : 1 line (Ec = 0.856, relative error = 16%) (Fig. 5) compared with other existing predictors, as shown in Fig. 3.

|
|
The K-factor map produced in the present study is so far the most detailed and consistent data for the entire state of NSW. The modelled values range from 0.020 to 0.068 t ha h ha–1 MJ–1 mm–1 with a mean (± s.d.) value of 0.035 ± 0.007 t ha h ha–1 MJ–1 mm–1. The range and mean values agree well with previous results from field plot measurements and estimates from the SOILOSS program (Rosewell 1993), which ranged from 0.015 to 0.055 t ha h ha–1 MJ–1 mm–1 with a mean value of 0.033 t ha h ha–1 MJ–1 mm–1. The maps of soil erodibility shown here do not reflect actual soil erosion (soil loss), but the erodibility patterns across the landscape can enhance the awareness of land management and planning.
There is a trend in the spatial distribution of silt, the content of which generally increases from the western and central regions to the eastern coast by ~27%; the organic matter (OM) content is also higher in eastern coastal areas (~44% higher). These trends did not show up in the final K-factor map, and this may be due to the mixed effects of silt and OM content, because a higher silt content generally increases soil erodibility whereas higher OM helps reduce erodibility. Note that the nomograph method is only suitable for soils with an OM content <10%, but there are some soils (~5%) in NSW with an OM content above this limit.
According to the RUSLE definition, only the effects of rock fragments within the soil profile are considered in the estimation of K. Rock fragments resting upon the soil surface that protect the soil against the effects of raindrops and run-off are taken into account in the C-factor. However, in our previous study, surface rock fragments were not considered in the C-factor because the data were not available then (Yang 2014). Incorporating the percentage of stone cover in the K-factor is a complementary measure to the missing component in the C-factor, and this approach has also been adopted by other researchers (e.g. Poesen et al. 1994; Panagos et al. 2014).
As shown in Fig. 6, both rainfall erosivity and soil erodibility are high in the North Coast region, resulting in the highest soil loss compared with other regions. The Far West region has the lowest rate of soil loss, which may be due to the lowest rainfall erosivity (Yang and Yu 2015) and slope-steepness (Yang 2015) in this flat area, despite the erodibility being the highest. Lower erodibility in the coastal areas could be due, in part, to the relatively large amount of rock fragments that protect the soil against raindrop impact. In addition, many of these soils have a coarse-textured topsoil that rapidly accommodates infiltrating water. However, the variability of erodibility is lower than that of rainfall erosivity and the LS-factor, thus the risk of soil erosion (or potential erosion) is largely determined by the R-factor (R2 = 0.7992) and LS-factor (R2 = 0.5754). Cover and management factors were not considered here, but are used for the assessment of actual soil erosion on a seasonal or annual basis (Yang 2014).

|
The erodibility map shows similar patterns as that of the parent material lithology classes in many parts of the state. This is because lithology and soil relationships were used for soil modelling and mapping to produce DSMs. The spatial pattern of areas with high soil erodibility largely follows the more siliceous classes in the parent material map of NSW (Gray et al. 2016). The areas with high siliceous parent materials (siliceous upper, ~8.4% of soils in NSW) have an average erodibility of 0.027, which is approximately 30% higher than that of mafic parent materials (~4.7% of soils in NSW) with a mean value of 0.019 (Fig. 7). The extreme classes (ultra mafic and extremely siliceous) only account for approximately 0.3% of soils in NSW.

|
Fig. 7 also shows that soils derived from the intermediate–upper parent material class (a central class; ~18% of soils in NSW) have the highest erodibility, which then generally decreases with both more and less siliceous material (based on modal, mean and median results). The results suggest relatively lower erodibility where parent materials give rise to highly clay-rich soils (mafic or ultra-mafic class) or highly siliceous (quartz rich) soils (siliceous class). Highest erodibility is apparent in the transitional materials, where there is usually a mixture of clay, silt and quartz sands, typically associated with loamy soil materials (accounting for ~86% of the area of NSW altogether). Silt tends to be highest in soils from intermediate parent materials.
Soil properties considered in the present study include surface texture, OM content, permeability, soil structure and rock fragment content. Thus, the predicted erodibility values only reflect the intrinsic properties of a soil body and do not include factors such as slope, rainfall amount and intensity, surface cover or management practices. These factors may also have effects on soil erosion, but they are considered as separate factors (e.g. LS-factor, R-factor and C-factor) in hillslope erosion modelling.
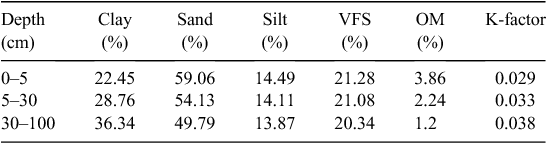
Going down the soil profiles in NSW, the percentage of clay generally increases, the percentage of sand decreases, the percentage of silt decreases slightly, but the percentage of OM decreases significantly (Table 3). The present study demonstrates that OM is negatively correlated with K-factor values and it could explain ~61% of the variation in K. The silt texture fraction has a higher correlation (R2 = 0.5337) with soil erodibility than the sand (R2 = 0.1581) and clay (R2 = 0.0378) fractions. These relationships explain the increase in soil erodibility down the soil profile, due largely to a decrease in OM content, because there is strong negative correlation between erodibility and OM content. This also indicates the importance of maintaining soil carbon in soil erosion management.
|
Conclusions
In the present study, we assessed eight existing methods or maps, and improved the mapping of soil erodibility based on recent DSMs and SALIS data for the entire state of NSW. The accuracy and consistency of the results were checked against soil plot measurements and other data sources found in the literature. Most of the modelled erodibility values ranged from 0.02 to 0.07 t ha h ha–1 MJ–1 mm–1, with a mean value of 0.035 t ha h ha–1 MJ–1 mm–1, which agree well with plot measurements. The K-factor map was further used, along with other RUSLE factors, to assess soil loss across NSW.
The soil erodibility map is an important contribution to the estimation of soil erosion for NSW because the K-factor is crucial among the input factors used to estimate soil loss according to RUSLE and other models. This is the first time a K-factor map has been produced and validated for NSW so that K-factor values are consistent and comparable at any location across the state. The map is spatially continuous with an improved spatial resolution of <1 ha. This is beneficial if the K-factor is to be used as an input to further erosion modelling, because it will enhance the level of detail and sensitivity of analysis.
The soil erodibility map produced in the present study does not reflect actual soil erosion, but rather potential erodibility patterns across the landscape, which can serve as management guides to enhance awareness of sustainable land management and planning. With available DSMs and validation data, the methodology and automated process developed in the present study can be readily applied to all of Australia and elsewhere in the world.
Soil erodibility is a complex phenomenon that is affected by many factors, including spatially variable, temporally dynamic soil properties and human activities; thus, no single model can fully represent the integrated response that constitutes soil erodibility. Future studies should further investigate the mechanisms involved in soil erodibility, and combine water and wind erosion together. Further studies should also consider other soil properties and conditions that affect soil erodibility, such as soil moisture content, crusts, mosses, roots and the seasonal variation.
Conflicts of interest
The authors declare no conflicts of interest.
Acknowledgements
This study is part of an ongoing state-wide soil erosion modelling program in NSW supported by the Office of Environment and Heritage (OEH). CSIRO and partners provided the digital soil maps via the Soil and Landscape Grid of Australia. OEH provided soil information via the SALIS system. Many OEH scientists and former staff, including Colin Rosewell, Brian Murphy, Rob Muller and John Young, provided assistance with soil plot information and field data for K-factor validation. All this help is gratefully acknowledged.
References
Belasri A, Lakhouili A (2016) Estimation of soil erosion risk using the Universal Soil Loss Equation (USLE) and geo-information technology in Oued El Makhazine watershed, Morocco. Journal of Geographic Information System 8, 98–107.| Estimation of soil erosion risk using the Universal Soil Loss Equation (USLE) and geo-information technology in Oued El Makhazine watershed, Morocco.Crossref | GoogleScholarGoogle Scholar |
Bonilla CA, Johnson OI (2012) Soil erodibility mapping and its correlation with soil properties in Central Chile. Geoderma 189–190, 116–123.
| Soil erodibility mapping and its correlation with soil properties in Central Chile.Crossref | GoogleScholarGoogle Scholar |
Borselli L, Torri D, Poesen J, Iaquinta P (2012) A robust algorithm for estimating soil erodibility in different climates. Catena 97, 85–94.
| A robust algorithm for estimating soil erodibility in different climates.Crossref | GoogleScholarGoogle Scholar |
Bronick CJ, Lal R (2005) Soil structure and management: a review. Geoderma 124, 3–22.
| Soil structure and management: a review.Crossref | GoogleScholarGoogle Scholar | 1:CAS:528:DC%2BD2cXhtVOru7jP&md5=d1d0d5563f7af42ef6d8508a96fc8a36CAS |
Edwards K (1987) ‘Runoff and soil loss studies in New South Wales.’ Technical Handbook No. 10. (Soil Conservation Service of NSW: Sydney, NSW)
Gray JM, Thomas FA, Bishop TFA, Wilford JR (2016) Lithology and soil relationships for soil modelling and mapping. Catena 147, 429–440.
| Lithology and soil relationships for soil modelling and mapping.Crossref | GoogleScholarGoogle Scholar |
Grundy MJ, Viscarra Rossel RA, Searle RD, Wilson PL, Chen C, Gregory LJ (2015) Soil and landscape grid of Australia. Soil Research 53, 835–844.
| Soil and landscape grid of Australia.Crossref | GoogleScholarGoogle Scholar |
Hussein MH, Kariem TH, Othman AK (2007) Predicting soil erodibility in northern Iraq using natural runoff plot data. Soil and Tillage Research 94, 220–228.
| Predicting soil erodibility in northern Iraq using natural runoff plot data.Crossref | GoogleScholarGoogle Scholar |
Isbell RF (2002) ‘The Australian soil classification (revised edition).’ (CSIRO Publishing: Melbourne, Vic.)
IUSS Working Group WRB (2015) World Reference Base for Soil Resources 2014, update 2015 International soil classification system for naming soils and creating legends for soil maps. World Soil Resources Reports No. 106. (FAO: Rome)
Knapen A, Poesen J, De Baets S (2007) Seasonal variations in soil erosion resistance during concentrated flow for a loess-derived soil under two contrasting tillage practices. Soil & Tillage Research 94, 425–440.
| Seasonal variations in soil erosion resistance during concentrated flow for a loess-derived soil under two contrasting tillage practices.Crossref | GoogleScholarGoogle Scholar |
Lal R, Pimental D (2008) Soil erosion: a carbon sink or source? Science 319, 1040–1042.
| Soil erosion: a carbon sink or source?Crossref | GoogleScholarGoogle Scholar | 1:CAS:528:DC%2BD1cXis1Kksrc%3D&md5=898ed8a318d85783dd00b3cf5a56e433CAS |
Loch RJ, Rosewell CJ (1992) Laboratory methods for measurement of soil erodibilities (K-factor) for the Universal Soil Loss Equation. Australian Journal of Soil Research 30, 233–248.
| Laboratory methods for measurement of soil erodibilities (K-factor) for the Universal Soil Loss Equation.Crossref | GoogleScholarGoogle Scholar |
Loch RJ, Slater BK, Devoil C (1998) Soil erodibility (Km) values for some Australian soils. Australian Journal of Soil Research 36, 1045–1055.
| Soil erodibility (Km) values for some Australian soils.Crossref | GoogleScholarGoogle Scholar |
Lu H, Prosser IP, Moran CJ, Gallant JC, Priestley G, Stevenson JG (2003) Predicting sheetwash and rill erosion over the Australian continent. Australian Journal of Soil Research 41, 1037–1062.
| Predicting sheetwash and rill erosion over the Australian continent.Crossref | GoogleScholarGoogle Scholar |
Murphy CL, Fogarty PJ, Ryan PJ 1998. Soil regolith stability classification for state forests of eastern New South Wales. Technical Report No. 41, NSW Department of Land and Water Conservation, Sydney, NSW.
Nash JE, Sutcliffe JV (1970) River flow forecasting through conceptual models, Part 1: a discussion of principles. Journal of Hydrology 10, 282–290.
| River flow forecasting through conceptual models, Part 1: a discussion of principles.Crossref | GoogleScholarGoogle Scholar |
Office of Environment & Heritage (OEH) (2017a) The Soil and Land Information System (SALIS). Available at http://www.environment.nsw.gov.au/topics/land-and-soil/soil-data/salis [verified 5 February 2017].
Office of Environment & Heritage (OEH) (2017b) Digital soil mapping of key soil properties over NSW. Technical Report, NSW OEH, Sydney, NSW. Available at http://www.environment.nsw.gov.au/Research-and-publications/Publications-search/Digital-soil-mapping-of-key-soil-properties-over-NSW [verified 14 June 2017].
Office of Environment & Heritage (OEH) (2017c) Great Soil Group (GSG) Soil Type map of NSW. Available at http://data.environment.nsw.gov.au/dataset/great-soil-group-gsg-soil-type-map-of-nsw1cf19 [verified 11 September 2017].
Olson KR, Al-Kaisi M, Lal R, Cihacek L (2016) Impact of soil erosion on soil organic carbon stocks. Journal of Soil and Water Conservation 71, 61A–67A.
| Impact of soil erosion on soil organic carbon stocks.Crossref | GoogleScholarGoogle Scholar |
Panagos P, Meusburger K, Ballabio C, Borrelli P, Alewell C (2014) Soil erodibility in Europe: a high-resolution dataset based on LUCAS. The Science of the Total Environment 479–480, 189–200.
| Soil erodibility in Europe: a high-resolution dataset based on LUCAS.Crossref | GoogleScholarGoogle Scholar |
Paton TR, Humphreys GS, Mitchell PB (1995) ‘Soils: a new global view.’ (UCL Press: London, UK)
Poesen JW, Torri D, Bunte K (1994) Effects of rock fragments on soil erosion by water at different spatial scales: a review. Catena 23, 141–166.
| Effects of rock fragments on soil erosion by water at different spatial scales: a review.Crossref | GoogleScholarGoogle Scholar |
Renard KG, Foster GR, Weesies GA, McCool DK, Yoder DC (1997) ‘Predicting soil erosion by water: a guide to conservation planning with the Revised Universal Soil Loss Equation (RUSLE).’ Agricultural Handbook, Vol. 703. (USDA: Washington, DC)
Riley SJ, Crozier P, Blong RJ (1981) An inexpensive and easily installed runoff plot. Journal of the Soil Conservation Service NSW 37, 144–147.
Römkens MJM, Poesen JWA, Wang JY (1988). Relationship between the USLE soil erodibility factor and soil properties. In ‘Conservation for future generations’. (Ed. S. Rimwanichland) pp. 371–38. (Department of Land Development: Bangkok, Thailand)
Rosewell CJ (1993) SOILOSS – a program to assist in the selection of management practices to reduce erosion. Technical Handbook No. 11, Soil Conservation Services, Sydney, NSW.
Rosewell CJ, Loch RJ (2002). Estimation of the RUSLE soil erodibility factor. In ‘Soil physical measurement and interpretation for land evaluation’. (Eds N. McKenzie, K. Coughlan, H. Cresswell) pp. 361–369. (CSIRO Publishing: Melbourne, Vic.)
Saha RJ, Tomar JMS, Ghosh PK (2007) Evaluation and selection of multipurpose tree for improving soil hydro-physic behavior under hilly eco-system of north east India. Agroforestry Systems 69, 239–247.
| Evaluation and selection of multipurpose tree for improving soil hydro-physic behavior under hilly eco-system of north east India.Crossref | GoogleScholarGoogle Scholar |
Sekhar KR, Rao BV (2002) Evaluation of sediment yield by using remote sensing and GIS: a case study from the Phulang Vagu watershed, Nizamabad District (AP), India. International Journal of Remote Sensing 23, 4499–4509.
| Evaluation of sediment yield by using remote sensing and GIS: a case study from the Phulang Vagu watershed, Nizamabad District (AP), India.Crossref | GoogleScholarGoogle Scholar |
Sharply AN, Williams JR (1990) EPIC-Erosion/Productivity Impact Calculator I, model documentation. U.S. Department of Agriculture Technical Bulletin No. 1768, USDA Agricultural Research Service, Washington, DC.
Silburn DM (2011) Hillslope runoff and erosion on duplex soils in grazing lands in semi -arid central Queensland. III. USLE erodibility (K-factors) and cover–soil loss relationships. Soil Research 49, 127–134.
| Hillslope runoff and erosion on duplex soils in grazing lands in semi -arid central Queensland. III. USLE erodibility (K-factors) and cover–soil loss relationships.Crossref | GoogleScholarGoogle Scholar |
Soil and Landscape Grid of Australia (2017) Soil and Landscape Grid of Australia. Available at http://www.clw.csiro.au/aclep/soilandlandscapegrid/index.html [verified 5 February 2017].
Stace HCT, Hubble GD, Brewer R, Northcote KH, Sleeman JR, Mulcahy MJ, Hallsworth EG (1968) ‘A handbook of Australian soils.’ (CSIRO and International Society of Soil Science, Rellim Technical Publications: Glenside, SA)
Teng HF, Viscarra Rossel RA, Shi Z, Behrens T, Chappell A, Bui E (2016) Assimilating satellite imagery and visible–near infrared spectroscopy to model and map soil loss by water erosion in Australia. Environmental Modelling & Software 77, 156–167.
| Assimilating satellite imagery and visible–near infrared spectroscopy to model and map soil loss by water erosion in Australia.Crossref | GoogleScholarGoogle Scholar |
Torri D, Poesen J, Borselli L (1997) Predictability and uncertainty of the soil erodibility factor using a global dataset. Catena 31, 1–22.
| Predictability and uncertainty of the soil erodibility factor using a global dataset.Crossref | GoogleScholarGoogle Scholar |
Torri D, Poesen J, Borselli L (2002) Corrigendum to ‘Predictability and uncertainty of the soil erodibility factor using a global dataset’. Catena 46, 309–310.
| Corrigendum to ‘Predictability and uncertainty of the soil erodibility factor using a global dataset’.Crossref | GoogleScholarGoogle Scholar |
USDA (2013) Revised Universal Soil Loss Equation, version 2 (RUSLE2). Available at http://fargo.nserl.purdue.edu/rusle2_dataweb/ [verified 5 February 2017].
Wang B, Zheng FL, Guan YH (2016) Improved USLE-K-factor prediction: a case study on water erosion areas in China. International Soil and Water Conservation Research 4, 168–176.
| Improved USLE-K-factor prediction: a case study on water erosion areas in China.Crossref | GoogleScholarGoogle Scholar |
Wischmeier WH, Smith DD (1978) ‘Predicting Rainfall Erosion Losses: A Guide to Conservation Planning.’ Agricultural Handbook Vol. 537. (USDA: Washington, DC)
Wischmeier WH, Johnson CB, Cross BV (1971) A soil erodibility nomograph for farmland and construction sites. Journal of Soil and Water Conservation 26, 183–189.
Yang X (2014) Deriving RUSLE cover factor from time-series fractional vegetation cover for hillslope erosion risk monitoring in New South Wales. Soil Research 52, 253–261.
| Deriving RUSLE cover factor from time-series fractional vegetation cover for hillslope erosion risk monitoring in New South Wales.Crossref | GoogleScholarGoogle Scholar |
Yang X (2015) Digital mapping of RUSLE slope length and steepness factor across New South Wales. Soil Research 53, 216–225.
Yang X, Yu BF (2015) Modelling and mapping rainfall erosivity in New South Wales, Australia. Soil Research 53, 178–189.
Zhang KL, Shu AP, Xu XL, Yang QK, Yu B (2008) Soil erodibility and its estimation for agricultural soils in China. Journal of Arid Environments 72, 1002–1011.
| Soil erodibility and its estimation for agricultural soils in China.Crossref | GoogleScholarGoogle Scholar |