

Modern calibration and historical testing of small-area, fire-interval reconstruction methods
Alexa J. Dugan A and William L. Baker A BA Department of Geography, Department 3371, 1000 East University Avenue, University of Wyoming, Laramie, WY 82071, USA.
B Corresponding author. Email: bakerwl@uwyo.edu
International Journal of Wildland Fire 23(1) 58-68 https://doi.org/10.1071/WF12162
Submitted: 1 October 2012 Accepted: 31 July 2013 Published: 18 October 2013
Abstract
Accuracy of small-area, fire-interval estimation methods has been inadequately assessed, thus we conducted modern calibration and historical testing of the traditional composite-fire-interval and a newer all-tree-fire-interval method for estimating population mean fire intervals. We tested in eight areas, at four scales, using 30 small plots across ponderosa pine forests on the South Rim of Grand Canyon National Park. In modern calibration, individual-plot all-tree-fire-intervals were equal to population mean fire intervals in all plots. Across the eight areas, a mean-plot version of the all-tree-fire-interval method never failed, whereas mean-plot versions of composite-fire-intervals failed in 37.5–100% of areas. Pooled composite-fire-intervals, the traditional method, failed in all subareas. In historical testing, pooled and mean-plot all-tree-fire-interval methods and two variations of a mean-plot composite-fire-interval method had the lowest mean relative errors. Again, pooled composite-fire-intervals performed poorly across the eight areas. Overall, in modern and historical tests, the mean-plot all-tree-fire-interval method outperformed all others, but highly filtered mean-plot composite-fire-intervals were fairly accurate in historical tests. Both could be reliable methods, if replicated in small plots averaged over 600–1000-ha landscapes, but for small areas, the all-tree-fire-interval method outperformed others. However, for general use, there may be more value in spatially explicit, landscape-scale methods, rather than any small-area method.
Additional keywords: all-tree-fire-interval, composite-fire-interval, fire history.
Introduction
Restoring low severity fire is hampered by lack of accurate fire-scar methods to reconstruct historical fire intervals in small areas. Inaccurate fire intervals could foster unnatural burning frequency, disrupting rather than restoring forest structure and function (Tiedemann et al. 2000; Odion and Tyler 2002), with adverse consequences for biodiversity (Laughlin and Grace 2006). The common small-area fire-interval method, using composite fire intervals (CFIs), has limitations (Arno and Petersen 1983; Baker and Ehle 2001; Kou and Baker 2006a) and an alternative, the all-tree-fire-interval (ATFI) method (Kou and Baker 2006b) lacks empirical testing. Here, we test these small-area methods using a modern calibration and historical test.
Fire historians (e.g. Swetnam and Baisan 1996) typically use the CFI method, which estimates mean fire intervals (MFIs) by compositing all fire years on scars from a sampling area (Dieterich 1980). Mean CFI, using all fire years, declines towards 1.0 year as sampling area increases and small fires are added (Arno and Petersen 1983); thus, mean CFI may reflect sample size as much as mean fire intervals (Baker and Ehle 2001; Kou and Baker 2006a). However, these CFIs are still commonly reported (e.g. Fulé et al. 2003) and incorporated into fire management plans (e.g. USDI National Park Service 2009). As mitigation, fire historians may include only fire years found on ≥10% or ≥25% of ‘recording’ samples containing open scars more likely to record subsequent fires (Agee 1993). This filtering is arbitrary, has inconsistent effects, and is sensitive to the spatial distribution of scars (Baker and Ehle 2001; Kou and Baker 2006a; Baker 2009). A solution to these limitations is needed.
Modern calibration is still needed to compare estimated CFI in small areas, for which it was developed (Dieterich 1980), to population MFI, the true mean of fire intervals across a sample area. Empirical studies suggest the common CFI method is accurate and unbiased compared to other also un-validated CFI approaches, but not for estimating population MFI (Fulé et al. 2003; Van Horne and Fulé 2006). Fulé et al. (2003) validated detection of fires in a composite list, rather than estimation of population MFI. Farris et al. (2010) found a filtered CFI accurately predicted population MFI, but for filtered plots not filtered trees that are the fire-history tradition (e.g. Swetnam and Baisan 1996). In small, simulated areas, CFIs could produce errors if scars are degraded or fire intervals long (Parsons et al. 2007). Thus, a modern empirical calibration comparing traditional CFI estimates to the population MFI is still needed.
For this calibration the population MFI must be known, and has been shown analytically and through simulation to be equivalent to the fire rotation (Baker and Ehle 2001; Kou and Baker 2006a, 2006b). Fire rotation–the expected time to burn an area equal to the study area (Romme 1980), can be easily calculated where fire areas are known (e.g. a fire atlas). The population MFI from the fire rotation is the appropriate reference for modern calibration.
Similarly, modern calibration is needed for the ATFI method, which simulation showed could produce accurate and unbiased estimates of population MFI (Kou and Baker 2006b). ATFI uses scarring fraction (SF), the fraction of trees scarred by fires; thus, avoiding the small-fire problem inherent in CFIs that use counts of fires (Arno and Petersen 1983; Kou and Baker 2006b). All trees or a random subset are sampled for tree ages and fire scars, whether scarred or unscarred, avoiding bias from targeting multi-scarred trees (Kou and Baker 2006b). For ATFI and CFI use in historical reconstructions that encounter healed and damaged scars (McBride 1983; Gutsell and Johnson 1996; Parsons et al. 2007) historical testing is also needed.
The South Rim of Grand Canyon National Park (GCNP) is ideal for modern calibration and historical testing. This modern calibration begins in 1979, when GCNP initiated prescribed burning in burn units across the South Rim to restore historical forests (USDI National Park Service 2012). Fire boundaries were mapped in a digital fire atlas (GCNP Fire Atlas, E. Gdula, Fire GIS manager, GCNP, pers. comm.), including ignition date, burn unit and area burned. Unburned areas ≤40 ha were not mapped and fires before 2000 were mapped by hand on topographic maps (E. Gdula, pers. comm., 7 July 2012), but fire atlases are the best records of recent fires (Shapiro-Miller et al. 2007). Extensive old-growth Pinus ponderosa (ponderosa pine) forests, established before Euro–American settlement in 1880, facilitate historical testing. Also, pre-Euro–American settlement CFIs were estimated at the South Rim’s Grandview region (Duhnkrack 1982; Fulé et al. 2003), allowing comparisons.
We test six hypotheses: (H1) modern CFIs are significantly different from population MFIs, (H2) modern ATFIs are not significantly different from population MFIs, (H3) pre-Euro–American settlement CFIs are significantly different from estimated population MFIs, (H4) pre-Euro–American settlement ATFIs are not significantly different from estimated population MFIs, (H5) pre-Euro–American settlement CFIs at Grandview are significantly different from estimated population MFI and (H6) pre-Euro–American settlement ATFIs at Grandview are not significantly different from the estimated population MFI.
Methods
Study area
GCNP’s South Rim, in north-central Arizona, contains ponderosa pine forests and areas of two-needle piñon (Pinus edulis) and Utah juniper (Juniperus osteosperma). In 1880, Euro–American settlement initiated livestock grazing, mining, active fire suppression, tourism and minor logging (Hughes 1978; Anderson 1998). Fire suppression began in 1905 with Forest Service tenure (Anderson 2000; Vankat 2011), but declined in the late-1970s (USDI National Park Service 2012) with reintroduction of fire into forested landscapes (Baker 2009).
Field methods
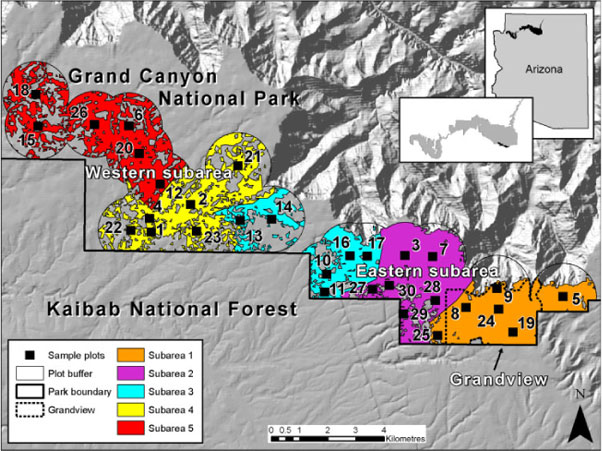
Some methods are reworded from Dugan (2012). We spatially reconstructed and cross-dated tree ages and fires in 30 plots across the South Rim, aligned with General-Land-Office (GLO) survey reconstruction polygons (Williams and Baker 2013), enabling objective sampling. Using ReGAP data (US Geological Survey, National Gap Analysis Program 2004), we limited sampling to pure ponderosa pine forests with ≥1 prescribed burn in the GCNP Fire Atlas, ≥50 m from piñon–juniper (PJ) woodlands, 100 m from main roads and near reconstruction polygon centroids. Following park sampling limitations, a plot was moved ~100 m if it contained a multi-scarred ponderosa >80 cm in diameter at breast height (DBH), but these were quite rare and thus had little influence on the study. We joined all plots with a minimum plot buffer (1175 m) resulting in a 4370-ha study area enclosed in two similar-sized polygons (hereafter referred to as eastern and western subareas), separated by more PJ-woodlands (Fig. 1).
|
We laid out rectangular plots with 50-m tapes and mapped plot corners with a professional-grade GPS. Park sampling limitations necessitated different samples of trees per plot. We enlarged 14 plots to contain ≥25 live trees of ≥30-cm DBH, and 16 to contain ≥40 live trees of ≥ 30-cm DBH. Both provide adequate samples based on a complementary study (Baker and Dugan 2013). Plot size varied from 0.3 to 1.1 ha. Each plot represents ~146 ha of the study area (4370 ha ÷ 30 plots). We set a minimum tree DBH of 30 cm, as all initially sampled, live, 30-cm trees were pre-Euro–American in origin (pre-1880) or younger, and we required samples of trees alive during both modern (post-1978) and historical (pre-1880) periods. We mapped each tree in ArcPad (ESRI, Inc.) with a professional-grade GPS and a laser rangefinder.
To obtain tree ages needed for ATFI estimates, we cored live trees using increment borers at <30 cm above the base, sloped towards the base and repeated until cores were <1 cm from pith. We replaced rotten trees with nearby trees outside plots. In addition to live tree-age sampling, we mapped and dated fire scars on both live and dead trees with ≥1 fire scar (post-1978 or pre-1880). We removed fire-scar samples from tree boles and roots with a chainsaw (Arno and Sneck 1977) or increment borer (Barrett and Arno 1988).
Laboratory and analysis methods
We mounted and finely sanded cores and cross-sections (Arno and Sneck 1977). We used local chronologies (Table S1) to visually crossdate tree-age and fire-scar samples using standard methods (Stokes and Smiley 1968). For cores missing the pith, we used: P = I – (r ÷ A) + 1, where P is estimated pith date, I is the cross-dated year of the innermost ring, r is the radius (mm) of a circle fitted to the innermost ring and A is average ring width (mm) of the 10 innermost rings, after Norton et al. (1987). We documented fire years on tree-age cores, identified by char at the point of injury. We used COFECHA (Holmes 1983) and Xmatch2002 (Fowler 2002) to crossdate fire-scar samples from dead trees, and validated COFECHA results visually using the local chronologies.
Modern calibration
We conducted modern calibration at four scales: (1) individual plot, (2) entire 30-plot study area, (3) eastern and western subareas and (4) five subareas, each containing six adjacent plots (Fig. 1). Subareas are analysis areas at all scales other than individual plots. Modern fire rotations provided modern population MFIs, as Baker and Ehle (2001) showed them to be identical across scales (see Introduction). To calculate modern fire rotations, we first clipped GCNP Fire-Atlas boundaries to the 4370-ha study area. We extended the modern calibration from 1979, when prescribed-burning began on the South Rim (Anderson 1998; GCNP Fire Atlas), to 2007, the most recent visually detectable fire-year. We estimated fire rotation as the analysis period (29 years) divided by the fraction of the area burned in each plot or subarea (Romme 1980). For plot-scale fire rotations, we assumed each fire burned the whole plot as Atlas fires were generally large relative to plots.
Adjustments of calibration fire records were necessary to focus on how well CFI and ATFI methods estimate population MFI, not how well fire scars detect Atlas fires. We found some fires not in the Atlas, whereas others in the Atlas were not detected in scars. For example, sometimes plots fell in unburned areas, later supported by Monitoring Trends in Burn Severity (MTBS) data (http://www.mtbs.gov, accessed 1 March 2012). Also, mapping inaccuracies are known, especially for pre-2000 fires that were hand-drawn on topographic maps (E. Gdula, Fire GIS manager, GCNP, pers. comm., 7 July 2012). Thus, for plot-scale fire rotations we excluded Atlas fires not found in plots, but added fires we found on >1 scar. These added fires were likely confined to single plots, as they were not found in adjacent plots (see Table 1 notes). For subarea-scale fire rotations, we assigned each added fire an area of 146 ha, the mean landscape area represented by each plot, and we excluded Atlas fires not overlapping a sampling plot.

|
To test H1, that modern CFIs are significantly different from population MFIs, we used full-period intervals that included 1979 to the first fire year and the last fire year to 2007 to ensure at least two intervals per plot. We also calculated fire-to-fire intervals in plots with >1 fire. Although this 29-year study period is fairly short, a limitation of any modern calibration, a truly successful fire-interval method should be able to accurately estimate the population MFI over any analysis period. The mean CFI is the analysis period divided by the number of fire intervals in a pool of fires from an area (Dieterich 1980). We calculated plot-level CFIs using all fire years (CFIall) within the study period then averaged these across plots within each subarea to yield mean-plot CFIs. Following common practice, we calculated filtered plot-level CFIs using modern fires found on ≥10% (CFI10%) and ≥25% (CFI25%) of recording samples in each plot (e.g. Grissino-Mayer 1995). We could not filter fire-to-fire intervals or test them at scales larger than plots due to small sample size. We calculated pooled CFIs by pooling all fire years in a plot or subarea, customary in fire-histories (e.g. Swetnam and Baisan 1996). We could not filter pooled CFIs as modern fires were restricted to specific burn units (USDI National Park Service 2012), a limitation of any calibration using burns restricted to units. We tested for normality, applied transformations if necessary and conducted one-sample t-tests (Ott 1988) in SAS (SAS Institute, 2008) to compare subarea mean-plot CFIs (CFIall, CFI10%, CFI25%) and pooled CFIall to estimated population MFIs (fire rotation) in each subarea.
To test H2, that modern ATFI estimates are not significantly different from population MFIs, we estimated individual-plot all-tree-fire-intervals as:
where ATFI is the all-tree-fire-interval estimate of population MFI, TAi is the number of years each tree i of m total trees in the sample was alive during the analysis period, SNj is the number of fire scars for SF class j of n scarring-fraction classes and SFj is the mean scarring fraction for SF class j (Kou and Baker 2006b). All trees used in modern calibration were alive so TA for each tree was the analysis period (29 years). We determined individual-plot SFs as observed fraction of trees receiving a scar from each fire-year, and averaged SFs among all fires in the plot. After calculating plot-level ATFIs we calculated mean-plot ATFIs for each subarea. We tested for normality, transformed if necessary and conducted one-sample t-tests (Ott 1988) to compare mean-plot ATFIs to estimated population MFIs by subarea. We also compared pooled ATFI to population MFI by subarea, but t-tests were not possible with one value per subarea.
Historical tests
Similarly, we used four scales and population MFIs from the spatially reconstructed fire rotation (Dugan 2012) as the reference for historical testing of CFI and ATFI accuracy. In each plot or subarea, analysis periods extended from the year when 20% of pre-1880 trees in the plot or subarea had established to 1879, just before Euro–American settlement (Anderson 1998). Thus, analysis periods varied from plot-to-plot (Table 2) and subarea-to-subarea (Tables S5, S6). To test H3, that pre-1880 CFI estimates are significantly different from estimated population MFIs, we calculated plot-level CFIs using fire-to-fire intervals averaged among plots in each subarea to obtain fire-to-fire mean-plot CFIall. We similarly calculated filtered mean-plot CFIs (CFI10%, CFI25%). We also estimated full-period mean-plot CFIall, CFI10% and CFI25% that included intervals before the first and after the last fires in the plot. We calculated pooled CFIs using fire-to-fire and full-period intervals for the pool of fires in each subarea. To test for significant differences between CFIs and population MFIs we tested for normality, applied transformations if needed and conducted one-group t-tests (Ott 1988).

|
To test H4, that pre-1880 ATFI estimates are not significantly different from estimated population MFIs, we estimated historical ATFIs for each plot and subarea. Each tree’s TA is the number of years the tree was alive during the analysis period. We estimated empirical mean SFs for each plot or subarea by dividing the number of trees recording each fire by the number of trees alive at that time. We calculated plot-level ATFIs using each plot’s SF (Eqn 1) and tested for significant differences between mean-plot ATFIs for each subarea and population MFI using one-group t-tests (Ott 1988). We also calculated pooled ATFI for each subarea to compare to the population MFI, but t-tests were not possible with one value per subarea.
At Grandview (Fig. 1), to test if pre-1880 CFI estimates are significantly different (H5) and if pre-1880 ATFI estimates are not significantly different (H6) from the estimated population MFI, we compared the pooled and mean-plot CFIs and ATFIs to the Grandview historical population MFI. We used one-group t-tests (Ott 1988) to test for significant differences between all parameter estimates and the population MFI.
Results
Modern calibration
Between 1979 and 2007 each plot experienced 1–3 fires producing individual-plot population MFIs (fire rotation) of 9.7–29.0 years (Table 1). In all 30 plots (Table 1), ATFIs equalled population MFIs (mean relative error = 0.0%) in spite of variation in SF (Table S2). Full-period CFIs equalled population MFIs in 8–14 plots (relative errors 28.6–45%; Table 1). Filtering improved their accuracy somewhat, but relative errors increased because CFIs sometimes exceeded population MFIs (Table 1). In the 21 plots with >1 fire, fire-to-fire CFIall performed poorer than full-period CFIall having a mean relative error of 34.0% (Table 1). Thus, at the plot scale ATFI was always accurate and CFI measures mostly failed so that H2 (modern ATFIs were not different from population MFI) and H1 (modern CFIs were significantly different from population MFI) were not rejected.
Across all subarea scales we generally could not reject H1 (Fig. 2). Pooled CFIall was most significantly different from population MFI (Fig. 2a–h) with the highest relative errors (Tables S3, S4). All full-period mean-plot CFIall and CFI10% were significantly shorter than population MFIs (Tables S3, S4) for the study-area (Fig. 2a), eastern and western subareas (Fig. 2b, c) and several six-plot subareas (Fig. 2d–h). Mean-plot CFI25% was only significantly longer than population MFIs for the study area (Fig. 2a), eastern subarea (Fig. 2b) and Subarea 2 (Fig. 2e). Thus, for most CFI variations we failed to reject H1 (modern CFIs are significantly different from population MFIs), particularly for the commonly reported pooled CFI.
|
Across all subarea scales we could not reject H2, that modern ATFI estimates are not significantly different from population MFIs (Fig. 2). Mean-plot ATFI was not different from population MFI at any scale (Fig. 2a–h). Pooled ATFIs were also similar to population MFI (Fig. 2). Both ATFIs had low relative errors (Tables S3, S4).
Overall, mean-plot ATFI was never significantly different from population MFI and along with pooled ATFI had the lowest mean relative errors (Table 3). In contrast, mean-plot CFIall and pooled CFIall were always significantly different from population MFI (Fig. 2) and had the highest mean relative errors of 33.1 and 80.7% (Table 3). Mean-plot CFI10% was significantly different from population MFI in 75% of subareas, whereas CFI25% was only significantly different from population MFIs in 37.5% of subareas (Table 3).
|
Historical tests
From 1684 to 1879 the estimated historical fire rotation (population MFI) was 33.2 years for the 4370-ha study area, ranging from 23.0–67.6 years in other subareas (Dugan 2012; Tables S5, S6). Prior to testing, we removed two plots (1, 26) with small sample sizes (1–2 fires) that had caused spatial FR to not equal mean individual-plot FR. They should be similar (Baker and Ehle 2001), and were similar in all subareas after removals.
In contrast to the modern calibration where most CFI measures failed, in historical testing some CFIs worked. Full-period CFIs (mean relative errors 15.1–20.6%) were more accurate than fire-to-fire CFIs (relative errors 27.4–35.3%) in individual plots (Table 2) and full-period CFIs (mean relative errors 11.9–15.2%) were also more accurate than fire-to-fire CFIs (mean relative errors 15.2–26.0%) in subareas (Table 3). Greater filtering worked best, as mean-plot CFI25% was not significantly different from population MFIs in 75% of subareas (full-period intervals) or 100% of subareas (fire-to-fire intervals). Thus, we reject H3 (historical CFIs are significantly different from estimated population MFI) for this measure. With less filtering (CFIall, CFI10%), using either full-period or fire-to-fire intervals, H3 was less often rejected and had higher relative errors (Table 3). Filtering produced more accurate plot CFIs, but relative errors increased because some exceeded population MFIs (Table 2) as in the modern calibration. Although filtering also improved pooled CFIs (full-period and fire-to-fire intervals), all but six of 48 pooled CFIs (filtered and unfiltered) were significantly shorter than population MFIs (Tables S5, S6). Thus, in historical testing mean-plot CFI25% often succeeded, but inconsistently, and traditional pooled CFI measures mostly failed.
As in the modern calibration ATFIs worked. In individual plots ATFIs on average came closer to population MFIs and had a much lower range in relative errors (0.8–26.6%) than did fire-to-fire CFIs (e.g. 1.7–156.5% for CFI25%; Table 2). Mean-plot ATFI had the lowest mean relative error across subareas (10.9%) of all parameters (Table 3) and was only significantly different from population MFI in Subarea 3 (Tables S5, S6). Pooled ATFIs had the third lowest mean relative error (13.8%). Thus, we almost always failed to reject H4 (pre-1880 ATFI estimates are not significantly different from population MFIs).
In Grandview, we cannot reject H5 (pre-1880 CFI estimates are significantly different from estimated population MFIs) for all pooled CFIs and fire-to-fire mean-plot CFIs (Table S7). We also cannot reject H6, that pre-1880 ATFI (pooled and mean plot) estimates are not significantly different from estimated population MFI.
Both means and ranges of relative errors declined for mean-plot measures as replicates (plots) and study-area size increased. For example, maximum relative errors for ATFI were ≤26.6% at the individual plot scale (Table 2), ≤29.6% at the five-subarea scale (Table S6), ≤12.3% at the two-subarea scale, and only 1.5% at the study-area scale (Table S5). Similarly, errors for CFI25% using fire-to-fire intervals were ≤156.5% in individual plots (Table 2), ≤31.4% at the five-subarea scale (Table S6), ≤13.1% at the two-subarea scale and 4.5% at the study-area scale (Table S5). Thus, users requiring <20% error need to sample across 600–1000-ha areas. Users able to accept up to 26.6% error can use ATFI in small areas. Because maximum relative errors are larger for CFI25% more replicates and larger areas are needed.
Overall, in historical testing three measures succeeded in producing low mean relative errors below 14% (Table 3), although maximum errors were lowest for ATFI. Successful measures included mean-plot CFI25% (full-period or fire-to-fire intervals), and mean-plot or pooled ATFI. Overall, mean-plot CFIs greatly outperformed pooled counterparts. For both fire-to-fire and full period CFIs, filtering to 25% is most accurate, but based on relative errors the full-period method is better (Table 3). Almost all pooled CFIs failed and had high relative errors (Table 3) as in the modern calibration.
Discussion
Modern calibration: ATFI
The modern calibration empirically validates the ATFI method previously only found robust using modelling (Kou and Baker 2006b). Each plot’s ATFI equalled its population MFI (Table 1). The ATFI was also reliable in larger areas if small-plot estimates were replicated and averaged (Table 3; Kou and Baker 2006b). Pooled ATFIs were slightly less accurate. Some relative errors may not be in ATFI, but instead mapping inaccuracies in Fire-Atlas data. As in most agency maps, the Fire Atlas omits mapping of unburned areas (~≤40 ha) inside fire boundaries (E. Gdula, Fire GIS Manager, GCNP, pers. comm., 7 July 2012). Our plots sometimes fell in unburned areas, substantiated by MTBS maps, shown as burned in the Fire Atlas. Also, we added area burned (146 ha) for single-plot fires only found using scars to Fire-Atlas data used to calculate fire rotations. Too much area burned would shorten fire rotations. Average mean-plot ATFI and mean-plot population MFI across the 30 plots were both 17.9 years (Table 1), whereas study-area population MFI from Fire-Atlas data was 17.1 years (Table 1). Thus, we suspect population MFIs from Fire-Atlas data are too short; inflating relative errors in ATFI. If so, ATFI may estimate population MFIs even more accurately across scales.
The ATFI is sensitive to number of scars (SN) and scarring fraction (SF), but appears to accommodate variation. SFs of prescribed fires (0.106–0.440; Table S2) were often lower than reported SFs (Baker 2009; Baker and Dugan 2013), likely due to burns during cooler, wetter seasons (GCNP Fire Atlas). Despite this, the ATFI using empirical SFs performed well across scales, and was remarkably successful in individual plots. Empirical SFs require cross-dating each scar to be included in the SF and SN needed in the ATFI equation (Eqn 1).
The ATFI was shown through modelling (Kou and Baker 2006b) and this modern calibration to overcome two limitations of CFIs. Because ATFI is based on scarring rates, not fire counts, the small-fire problem (Arno and Petersen 1983; Baker and Ehle 2001, Kou and Baker 2006a, 2006b) is eliminated. ATFI requires that all trees with and without scars be sampled; thus, biased, targeted sampling of multi-scarred trees (e.g. Baker and Ehle 2001) is avoided.
Modern calibration: CFI
The modern calibration highlights inaccuracies of CFIs. CFI failed in small plots for which it was designed (Dieterich 1980). Although insufficient modern fires prevented full analysis of fire-to-fire CFIs they failed in all 21 plots where estimated, and mean relative errors were higher than for full-period CFIs (Table 1). Although filtered CFIs more accurately estimated population MFIs mean relative errors actually increased with filtering, as CFIs often became longer than population MFIs (Table 1). The small-fire problem, or decline in CFI as study area increases (Arno and Petersen 1983; Baker and Ehle 2001, Kou and Baker 2006a), was evidenced in pooled CFIs significantly shorter and less accurate than un-pooled CFIs across all subareas. Even mean-plot CFIs, except with a 25% filter, were generally significantly shorter than population MFIs and had high mean relative errors (Tables 1, 3).
Modern calibrations have limitations for testing CFIs because of their sensitivity to number of fires and analysis period. Here, each plot had only 1–3 prescribed fires over a 29-year period; thus, each full-period CFI had only one of four values, and nine fire-to-fire-plot CFIs could not be calculated (Table 1). Thus, high relative errors of individual-plot CFIs (Table 1) may partly reflect small sample size and short analysis period, though not problematic for the ATFI. Again, Fire-Atlas maps may have caused inaccuracies in population MFIs, but if they are too short, as we suspect, then all pooled CFIs and most mean-plot CFIs would perform even more poorly.
Historical tests: ATFI
Historical tests showed ATFI was the most successful parameter in individual plots with mean relative error of 14.3% (Table 2). Mean-plot ATFI was also accurate in nearly all (87.5%) subareas and had the lowest mean relative error (10.9%) of all parameters (Table 3). In Subarea 3 (Table S6), mean-plot ATFI was significantly shorter than population MFI with high relative error. This is likely due to low SFs in plots 10 and 11 that had a higher-severity fire in 1690 that left scars only in plot 10 (Dugan 2012), highlighting the effect of missing observations or evidence. If this fire was larger fire rotation would be shorter reducing the difference between ATFI and population MFI. Low SFs may also reflect patchy fires, as plots 10 and 11 contained several widespread fires (Dugan 2012) only found on single trees in each plot. Thus, both higher-severity and patchier fires may present problems for ATFI.
Historical ATFIs in individual plots were variable (Table 2), also evidenced in high standard errors and ranges across subareas (Tables S5, S6). This variability is likely from intrinsic spatial variability in population MFI demonstrated by generally declining ATFI and CFI ranges as study area size increases (Tables S5, S6). Sampling adequacy, not analysed here, may also contribute. Plots have different lengths of pre-1880 records, reflected in varying total tree ages (TA) and numbers of scarred trees (SN), that indicate sampling adequacy. We partly accounted for this by using study periods unique to each plot and removing plots with inadequate records (Table 2). Also, longer time-since-fire could allow more scar healing, lowering SF, but empirical SF actually corrects for healing. Studies relying on fire evidence from remnant wood can still use the ATFI if the sample includes all remnant wood (not just scarred pieces) to provide unbiased estimates of total tree age (TA) and scarring fraction (SF), a study period common to the samples and an adequate sample is obtained.
As in the modern test, it is important to consider the accuracy of estimated historical fire rotations. Fire rotation is most determined by large, widespread fires scarring multiple trees. If scars from an older, widespread fire healed or were destroyed (e.g. 1690 fire in Subarea 3) its fire size could be too low possibly increasing fire rotation somewhat. Fortunately, sequential low-severity fires may keep scars from healing for long periods (McBride 1983; Baker and Dugan 2013). Also, fire-rotation errors should be minimal given accurate area-burned interpolation methods (Hessl et al. 2007) and a sufficient sample of trees; 15–25 trees were adequate in a study of scarring in northern Arizona (Baker and Dugan 2013).
Historical tests: CFI
Pooled CFIs, the traditional fire-history method (Dieterich 1980), generally failed. Both full-period and fire-to-fire pooled CFIall and CFI10% were always significantly shorter than population MFIs, whereas full-period and fire-to-fire pooled CFI25% had high mean relative errors of 43.3 and 37.5% and each worked in only 37.5% of subareas (Table 3). Filtering of pooled estimates rarely succeeded, likely because it does not account for clustering of scars and needed filtering varies with fire-size distributions (Kou and Baker 2006a). Failure of pooled CFIs suggests MFIs commonly reported in fire-histories are inaccurate. The small-fire problem is likely responsible for these inaccuracies as small, ecologically less significant fires are effectively treated as burning entire subareas. Even when reducing the size of subareas, as with the five (six-plot) subarea scale (624–1068 ha), pooled CFIs were significantly shorter than population MFIs.
Some mean-plot CFI versions were successful in historical testing despite failure in modern calibration. Mean-plot CFIs likely work better than pooled versions because fire-scar sampling is confined to small plots. These overcome the small-fire problem (Kou and Baker 2006a), and also biased, targeted sampling if plots are statistically unbiased samples across a landscape and scars are sampled without bias within plots. Consequently, the most reliable and unbiased way to use CFIs would be in plots ≤~1.0 ha, as originally intended (Dieterich 1980; Farris et al. 2010). However, of 101 past studies reporting CFIs 100% were from areas >1 ha, 95% from >10 ha and 52% from >100 ha (Kou and Baker 2006a). Thus, past inaccuracies are widespread and likely large, as in pooled CFI comparisons (Tables 3, S5, S6).
Success of full-period v. fire-to-fire-interval methods was inconsistent, varying from plot to plot (Table 2) and among subareas. Mean-plot CFIs using full periods outperformed fire-to-fire periods, likely because more plots had first or last full-period intervals that were long relative to population MFI. With 25% filters, mean-plot CFIs using full-period intervals were only significantly different from population MFIs in two subareas and using fire-to-fire intervals were never significantly different; thus, filtering reduced differences. However, based on relative errors, mean-plot CFI25% using full-period intervals was the best CFI in the historical test (Table 3).
Conclusions
Overall, mean-plot ATFI was most consistently successful in estimating population MFIs in both modern calibration and historical testing. Filtering of CFIs inconsistently produced accurate results, as also found in simulation modelling (Kou and Baker 2006a). Nonetheless, the mean-plot CFI25% was successful in most subareas in the historical tests, except in individual plots where it had the highest mean relative errors. It also performed poorly in the modern tests, suggesting it is less reliable than the ATFI. However, calculating only 25% filtered CFIs using full-period intervals in small plots (≤1 ha) could improve on some CFI limitations.
Pooled CFI was especially inaccurate, yet modern fire management has commonly been based on pooled CFIs using fire-to-fire intervals and extrapolation from small areas, likely causing detrimental ecosystem effects. For example, in the park’s 644-ha Grandview region (Fig. 1), similar to the area studied by Duhnkrack (1982) and Fulé et al. (2003), pooled CFIs were 8.5–17.1 years shorter (relative errors of 33–67%) than the historical population MFI of 25.7 years (Table S7). Moreover, these short, pooled CFIs from Grandview (Fulé et al. 2003) have been extended across this South Rim study area (USDI National Park Service 2009). Extrapolating even accurate mean-plot CFIs or ATFIs from Grandview to the rest of the study area could have adverse consequences, as population MFIs were much longer elsewhere on the South Rim. Too frequent burning may reduce species richness (Laughlin and Grace 2006), disrupt PJ woodlands that historically burned infrequently (Baker and Shinneman 2004), weaken soil nutrient cycling (Tiedemann et al. 2000) and increase invasive species (Odion and Tyler 2002).
In the historical test, the best fire-interval measures required calculating a mean across at least four plot estimates in 600–1000-ha landscapes to achieve only modest accuracy (i.e. ~20% maximum error). Users requiring small-area estimates can perhaps achieve relative errors <26.6% with the ATFI. Further testing of ATFI is warranted. However, it is unclear whether there is an advantage to generally using these small-area methods, as landscape-scale methods that reconstruct fire-year maps to estimate fire rotation (e.g. Farris et al. 2010) are reliable and spatially explicit (Hessl et al. 2007). Managers tasked with restoring fire across large, variable landscapes, such as the South Rim of GCNP (e.g. USDI National Park Service 2012), need to know how historical fires burned spatially at the large scale at which both fires and management activities operate.
Acknowledgements
We appreciate field assistance by Tom Weber, Amy Jacobs and Noah Berg-Mattson and laboratory support by Amy Jacobs, Lacey Johnsen, Kimberly Menke and Callie Holcomb. Thanks to Lori Daniels and reviewers for comments that significantly improved the manuscript. This study is based upon work supported by the National Science Foundation under grant number BCS-1059159.
References
Agee JK (1993) ‘Fire Ecology of Pacific Northwest Forests.’ (Island Press: Washington, DC)Anderson MF (1998) ‘Living at the Edge: Explorers, Exploiters and Settlers of the Grand Canyon Region.’ (Grand Canyon Association: Grand Canyon, AZ)
Anderson MF (2000) ‘Polishing the Jewel: an Administrative History of Grand Canyon National Park.' (Grand Canyon Association: Grand Canyon, AZ)
Arno SF, Petersen TD (1983) Variation in estimates of fire intervals: a closer look at fire history on the Bitterroot National Forest. USDA Forest Service, Intermountain Forest and Range Experiment Station, Research Paper INT-301. (Ogden, UT)
Arno SF, Sneck KM (1977) A method for determining fire history in coniferous forests of the mountain West. USDA Forest Service, Intermountain Forest and Range Experiment Station. General Technical Report INT-42. (Ogden, UT)
Baker WL (2009) ‘Fire Ecology in Rocky Mountain Landscapes’. (Island Press: Washington, DC)
Baker WL, Dugan AD (2013) Fire-history implications of fire-scarring. Canadian Journal of Forest Research 43, 951–962
Baker WL, Ehle DS (2001) Uncertainty in surface-fire history: the case of ponderosa pine forests in the western United States. Canadian Journal of Forest Research 31, 1205–1226.
| Uncertainty in surface-fire history: the case of ponderosa pine forests in the western United States.Crossref | GoogleScholarGoogle Scholar |
Baker WL, Shinneman DJ (2004) Fire and restoration of pinyon-juniper woodlands in the western United States: a review. Forest Ecology and Management 189, 1–21.
| Fire and restoration of pinyon-juniper woodlands in the western United States: a review.Crossref | GoogleScholarGoogle Scholar |
Barrett SW, Arno SF (1988) Increment-borer methods for determining fire history in coniferous forests. USDA Forest Service, Intermountain Research Station, General Technical Report INT-244. (Ogden, UT)
Dieterich JH (1980) The composite fire method – a tool for more accurate interpretation of fire history. In ‘Proceedings of the Fire History Workshop’, 20–24 October 1980, Tucson. AZ. (Eds MA Stokes, JH Dieterich) USDA Forest Service, Rocky Mountain Forest and Range Experiment Station, General Technical Report RM-81, pp. 8–14. (Fort Collins, CO)
Dugan AJ (2012) A landscape fire history and a modern calibration of fire-interval methods in a ponderosa pine forest across the South Rim of Grand Canyon National Park. MA Thesis, University of Wyoming. (Laramie, WY).
Duhnkrack JS (1982) Fire regime analysis of the ponderosa pine forest at the Grandview monocline on the South Rim of Grand Canyon National Park, Arizona. MSc Thesis, Western Washington University. (Bellingham, WA)
Farris CA, Baisan CH, Falk DA, Yool SR, Swetnam TW (2010) Spatial and temporal corroboration of a fire-scar-based fire history in a frequently burned ponderosa pine forest. Ecological Applications 20, 1598–1614.
| Spatial and temporal corroboration of a fire-scar-based fire history in a frequently burned ponderosa pine forest.Crossref | GoogleScholarGoogle Scholar | 20945762PubMed |
Fowler A (2002) XMATCH02: an interactive tree-ring crossdating program. Department of Geography, University of Auckland, Occasional Paper 38. (Auckland, New Zealand)
Fulé PZ, Heinlein TA, Covington WW, Moore MM (2003) Assessing fire regimes on Grand Canyon landscapes with fire-scar and fire-record data. International Journal of Wildland Fire 12, 129–145.
| Assessing fire regimes on Grand Canyon landscapes with fire-scar and fire-record data.Crossref | GoogleScholarGoogle Scholar |
Grissino-Mayer HD (1995) Tree-ring reconstructions of climate and fire history of El Malpais National Monument, New Mexico. PhD Thesis, The University of Arizona. (Tucson, AZ)
Gutsell SL, Johnson EA (1996) How fire scars are formed: coupling a disturbance process to its ecological effect. Canadian Journal of Forest Research 26, 166–174.
| How fire scars are formed: coupling a disturbance process to its ecological effect.Crossref | GoogleScholarGoogle Scholar |
Hessl A, Miller J, Kernan J, Keenum D, McKenzie D (2007) Mapping paleo-fire boundaries from binary point data: comparing interpolation methods. The Professional Geographer 59, 87–104.
| Mapping paleo-fire boundaries from binary point data: comparing interpolation methods.Crossref | GoogleScholarGoogle Scholar |
Holmes RL (1983) Computer-assisted quality control in tree-ring dating and measurement. Tree-Ring Bulletin 43, 69–75.
Hughes JD (1978) ‘In the House of Stone and Light: a Human History of the Grand Canyon.’ (Grand Canyon Natural History Association: Grand Canyon, AZ)
Kou X, Baker WL (2006a) A landscape model quantifies error in reconstructing fire history from scars. Landscape Ecology 21, 735–745.
| A landscape model quantifies error in reconstructing fire history from scars.Crossref | GoogleScholarGoogle Scholar |
Kou X, Baker WL (2006b) Accurate estimation of mean fire interval for managing fire. International Journal of Wildland Fire 15, 489–495.
| Accurate estimation of mean fire interval for managing fire.Crossref | GoogleScholarGoogle Scholar |
Laughlin DC, Grace JB (2006) A multivariate model of plant species richness in forested systems: old-growth montane forests with a long history of fire. Oikos 114, 60–70.
McBride JR (1983) Analysis of tree rings and fire scars to establish fire history. Tree-Ring Bulletin 43, 51–67.
Norton DA, Palmer JG, Ogden J (1987) Dendroecological studies in New Zealand; 1. An evaluation of tree age estimates based on increment cores. New Zealand Journal of Botany 25, 373–383.
| Dendroecological studies in New Zealand; 1. An evaluation of tree age estimates based on increment cores.Crossref | GoogleScholarGoogle Scholar |
Odion DC, Tyler C (2002) Are long fire-free periods needed to maintain the endangered fire-recruiting shrub Arctostaphylos morroensis (Ericaceae)? Conservation Ecology 6, 4
Ott L (1988) ‘An Introduction to Statistical Methods and Data Analysis’, 3rd edn. (PWS-Kent Publishing Company: Boston, MA)
Parsons RA, Heyerdahl EK, Keane RE, Dorner B, Fall J (2007) Assessing accuracy of point fire intervals across landscapes with simulation modeling. Canadian Journal of Forest Research 37, 1605–1614.
| Assessing accuracy of point fire intervals across landscapes with simulation modeling.Crossref | GoogleScholarGoogle Scholar |
Romme WH (1980) Fire history terminology: report of the ad hoc committee. In ‘Proceedings of the Fire History Workshop’ (Eds MA Stokes and JH Dierterich) USDA Forest Service, Rocky Mountain Forest and Range Experiment Station, General Technical Report RM-81, pp. 135–140. (Fort Collins, CO)
SAS Institute (2008) ‘SAS Procedures Guide Version 9’, 2nd edn. (SAS Institute Inc.: Cary, NC)
Shapiro-Miller LB, Heyerdahl EK, Morgan P (2007) Comparison of fire scars, fire atlases, and satellite data in the northwestern United States. Canadian Journal of Forest Research 37, 1933–1943.
| Comparison of fire scars, fire atlases, and satellite data in the northwestern United States.Crossref | GoogleScholarGoogle Scholar |
Stokes MA, Smiley TL (1968) ‘An Introduction to Tree-Ring Dating.’ (University of Chicago Press: Chicago, IL)
Swetnam TW, Baisan CH (1996) Historical fire regime patterns in the southwestern United States since 1700 AD. In ‘Fire Effects in Southwestern Forests: Proceedings of the Second La Mesa Fire Symposium’. (Ed CD Allen) USDA Forest Service, Rocky Mountain Research Station, General Technical Report RM-GTR-286, pp. 11–32. (Fort Collins, CO)
Tiedemann AR, Klemmedson JO, Bull EL (2000) Solution of forest health problems with prescribed fire: are forest productivity and wildlife at risk? Forest Ecology and Management 127, 1–18.
| Solution of forest health problems with prescribed fire: are forest productivity and wildlife at risk?Crossref | GoogleScholarGoogle Scholar |
US Geological Survey, National Gap Analysis Program (2004) Provisional Digital Land Cover Map for the Southwestern United States. Version 1.0. RS/GIS Laboratory, College of Natural Resources, Utah State University. (Logan, UT)
USDI National Park Service (2009) ‘Final environmental impact statement and assessment of effect: fire management plan, volume 1.’ (Grand Canyon National Park: Grand Canyon, AZ)
USDI National Park Service (2012) ‘Grand Canyon National Park Fire Management Plan.’ (Grand Canyon National Park: Grand Canyon, AZ)
Van Horne ML, Fulé PZ (2006) Comparing methods of reconstructing fire history using fire scars in a southwestern United States ponderosa pine forest. Canadian Journal of Forest Research 36, 855–867.
| Comparing methods of reconstructing fire history using fire scars in a southwestern United States ponderosa pine forest.Crossref | GoogleScholarGoogle Scholar |
Vankat JL (2011) Post-1935 changes in forest vegetation of Grand Canyon National Park, Arizona, USA. Part 1 – Ponderosa pine forests. Forest Ecology and Management 261, 326–341.
| Post-1935 changes in forest vegetation of Grand Canyon National Park, Arizona, USA. Part 1 – Ponderosa pine forests.Crossref | GoogleScholarGoogle Scholar |
Williams MA, Baker WL (2013) Variability of historical forest structure and fire across ponderosa pine landscapes of the Coconino Plateau and south rim of Grand Canyon National Park, Arizona, USA. Landscape Ecology 28, 297–310.
| Variability of historical forest structure and fire across ponderosa pine landscapes of the Coconino Plateau and south rim of Grand Canyon National Park, Arizona, USA.Crossref | GoogleScholarGoogle Scholar |