

Characterising vegetative biomass burning in China using MODIS data
Xianlin Qin A C , Hou Yan B , Zihui Zhan B and Zengyuan Li AA Research Institute of Forest Resource Information Technology, Chinese Academy of Forestry, PO Box 100091, Beijing, China.
B Information Center of Forest Fire Prediction and Monitoring, State Forestry Administration, PO Box 100714, Beijing, China.
C Corresponding author. Email: noaags@caf.ac.cn
International Journal of Wildland Fire 23(1) 69-77 https://doi.org/10.1071/WF12163
Submitted: 1 October 2012 Accepted: 6 June 2013 Published: 22 October 2013
Abstract
For Chinese fire cases, it was established that the active fire data obtained from the Moderate Resolution Imaging Spectroradiometer (MODIS) 1-km2 spatial resolution and their subsequent analysis are more accurate and spatially precise than those obtained from the statistical fire data collected by the State Forestry Administration (SFA) of P. R. China. Most (37.5%) of the biomass burning detections from 2000 to 2011 were found in croplands, followed by broadleaf forests (21.2%). Three high-density fire regions were found during the 12-year study period: (1) Heilongjiang Province, where many large forest fires occurred in April–May and September–October; (2) Yunnan Province, where many small forest fires occurred in December–May and (3) Guangdong Province and Guangxi Autonomous Regions, where most fires occurred in croplands in November–March. The largest percentage (10.72%) of the total active fire points was in Heilongjiang Province during 2000–2011, followed by Yunnan Province (10.14%), with several fires taking place in February, April and June.
Additional keywords: fires, geographic information system techniques, satellite techniques, vegetation biomass burning characteristics.
Introduction
Fires are a prominent global phenomenon that affect natural vegetation and pose enormous danger to wildlife as well as people’s life and property (Guild et al. 2004). In addition, biomass burning has been identified as a significant source of greenhouse gases, carbon fluxes and trace gases, which pollute the atmosphere and contribute to radiative forcing responsible for global climate change (Wallace and Crosthwaite 2005; Devineau et al. 2010).
Understanding the spatial and temporal distribution patterns of fire is very important for environmental protection. Several studies on spatial and temporal distribution patterns of forest fires have been previously conducted (Larsen 1997; Pew and Larsen 2001; Wittenberg and Malkinson 2009; Yang et al. 2009). Some scientists have studied or predicted the wildfire occurrence with the logistic regression or geographic information system (GIS) spatial analysis methods (Yang et al. 2007; Bartlein et al. 2008; Syphard et al. 2008; Vadrevu and Badarinath 2009; Grala and Cooke 2010; Zhang et al. 2010). In the past, Chinese researchers usually studied the patterns of forest or grass fires in one or several provinces under the basis of fire frequency, burned area and time of occurrence (Tian et al. 2007; Yang et al. 2009; Zhao et al. 2009). Most of these studies only took into account the spatial and temporal distribution patterns, or the reason and probability prediction of fires. The general characteristics of biomass burning have not been studied at a national scale in China. Several prescribed burnings, small forest fires less than 1 ha, grassland fires (managed by Chinese Agricultural Administration) and burning in croplands have not been included in the statistical fire data published by the State Forestry Administration (SFA) of P. R. China. Moreover, scientists usually could not get the specific information about fires, such as location and burned area of all provincial forest or grass fires from the Chinese forest fire control. Hence, their results do not reflect the actual spatial and temporal distribution patterns of these fires. A sensor that can provide these data with multiple daily overpasses is the Moderate Resolution Imaging Spectroradiometer (MODIS) carried on Terra and Aqua satellites, which has been in operation for more than 10 years. The University of Maryland has freely provided the daily MODIS active fire data from 24 February 2002 to 30 June 2012. The produced record generated by the MODIS active fire detection algorithm, which was developed by Giglio et al. (2003), includes diurnal as well as nocturnal images. In this paper, we provide an analysis of vegetation biomass burning characteristics within different land-cover categories and seasons across China using MODIS active fire data.
Materials and methods
Study area
The whole country of China was selected as the study area, which is located between 73°40′E to 135°2′30″E and 3°52′N to 53°33′N. The area includes cold-temperate, temperate, sub-tropical and tropical zones from the north-east to the south of China. The analysis was performed at different provincial levels to determine the burning vegetation types as well as the spatial and temporal distributions of fire.
Data description
The 1-km2 spatial resolution active fire Collection 5 MOD14A1 (from 24 February 2000 to 31 December 2011) and MYD14A1 (from 4 July 2002 to 31 December 2011) products covering China were downloaded daily from the FTP server (http://earthdata.nasa.gov/data/nrt-data/firms/, accessed 16 September 2013) of the University of Maryland. Because the downloaded MODIS active fire data did not include the information of land covers and county names, the 1 : 1 000 000 digital vegetation types map of China was used to assign the information of vegetation type to these active fire points. This map was generated by Chinese Academy of Science in 2001 based on the results of the nationwide vegetation surveys and the relevant data from the aerial remote sensing and satellite images as well as geology, pedology and climatology. It covers the entire Chinese territory and illustrates comprehensively the geographical distributions of 11 groups of vegetation types, 796 formations with their 54 vegetation sub-formations types and ~2000 dominants of communities, main agricultural crops and economic plants. In order to simplify the land-cover type in our study, we combined steppe, meadows and grass-dominated marshes to a general grassland group and integrated the tropical mangroves to broadleaf forests group and the deserts to non-vegetation land group (hereafter called ‘others’). Bamboo has been classified as a single forest type in the Chinese national forest map based on the 5th national forest resources inventory, surveyed during the period of 1994–1998. We listed bamboo as a vegetation type of the broadleaf forests group of the vegetation map. Considering the change of vegetation types from 2000 to 2011, we updated the vegetation map of needle-leaf forests, broadleaf forests, mixed forests and bamboo using the results (classified as needle-leaf forests, broadleaf forests, mixed forests, bamboo and others) of the 6th and the 7th national forest resources inventories, surveyed during the periods of 1999–2003 and 2004–2008 respectively. Therefore, the vegetation types used in this study include eight types: needle-leaf forests, broadleaf forests, mixed forests, shrubs, grass, crop, bamboo and others. In order to assign the information of active fire points to the county name and to satisfy the need of analysis, we used the 1 : 1 000 000 administrative boundary, roads and waterbody (rivers and lakes) digital maps published by the Chinese Academy of Surveying and Mapping.
During the same period, the ground observation information on the location, occurrence, duration and burned area of large forest or grass fires, as well as the provincial statistical fire data (except Taiwan, Hong Kong and Macao) in the corresponding period, were collected. We investigated many burned areas and acquired information regarding their location, burning duration, total burned area and economic loss expressed in monetary value between 2000 and 2011. The provincial statistical fire data were taken from the SFA of P. R. China.
Methodology
The methodology of this study is to determine the land-cover types where the majority of burnings were concentrated as well as the temporal and spatial distributions of fire in China. MODIS active fire data were used as primary data, which were processed using the statistical and geographical methodologies shown in Fig. 1.
|
Data preprocessing
The preprocessing included the creation of an active fire points feature layer of China from the coordinates of MODIS active fire points, the assignment of the vegetation type information and county name to all fire points, and the elimination of false alarms from the MODIS active fire points. The aim of this procedure was to prepare the fire detection data for further statistical analyses.
Attributive information on county names and land-cover types was added to each fire detection point through the ‘spatial join’ function with the digital administrative boundary map and vegetation type map using ArcGIS 9.3 software (ESRI China Information Technology Co. Ltd, Beijing). We used the vegetation type map of three periods of time to assign the land-cover type to the MODIS active fire points. The land-cover type of the MODIS active fire points before 2004 had been assigned with the reconsolidated vegetation type map of 2001. The updated vegetation type map with the results of the 6th and the 7th national forest resources inventories had been respectively used for the MODIS active fire points for the years 2004–2008 and later. Based on the processing, all fire points in the shape format layer were added to the attribute field with names of provinces and counties as well as vegetation types.
In many previous studies, the fire detection algorithm exploits the different responses of middle-infrared and long-wave-infrared bands of satellite to the thermal targets (Dozier 1981; Justice et al. 2002; Giglio et al. 2003). However, there are many abnormal thermal targets, which have been mistaken as fires (especially when identifying diurnal satellite images) by the detection algorithm. The detections are identified as hotspots by using satellite images. Currently, MODIS fire detections are approaching stage-4 validation (http://landval.gsfc.nasa.gov/, accessed 16 September 2013), but we found there is still some misinformation in the fire results. The false alarms of MODIS active fire points had been eliminated with our collected fire information and MODIS L1B images within the same period. We overlaid MODIS fire detection points with geometrically corrected MODIS images and GPS layers of burned area, collected during field survey, and eliminated those MODIS points that were not supported by visible burn scars in the images or field data. Then, MODIS active fire points located in waterbody layers were also removed. We found that 3906 full 1-km2 fire pixels were within waterbodies and 100 of them have 100% fire confidence level. The validation results, obtained from the field survey information by local officers, showed nearly 90% of the active fire points were real fire. However, ~15% of the fires were not monitored because of the presence of clouds during the fire occurrence and satellite orbit.
Analysis
Statistical and GIS spatial analyses were conducted using the validated active fire points detected in the period between 24 February 2000 and 31 December 2011 to determine the main burning vegetation type, the spatial and temporal distribution patterns of fire. The statistical analysis included the fire count according to the vegetation type and occurrence date using the ‘Summary Statistical’ function in ArcGIS 9.3 software. The GIS spatial analyses included: the density analysis; analysis by province; and buffer analysis proximity to roads, populated area and waterbody analyses. In order to determine the density of fire point distribution, the map of the study area was plotted as a grid of 1-km2 spatial resolution. The total count of fire points in each grid was calculated using IDL program (ESRI China Information Technology Co. Ltd).
Results and discussion
The total number of validated active fire points from 24 February 2000 to 31 December 2011 in China was 610 916 (Fig. 2).
|
Burning land-cover types
To identify the land cover types where the majority of fires were concentrated, analyses were conducted on fire count based on its annual, monthly and proportional changes of different land cover types during the 12-year period. The results of this analysis are shown in Figs 3–5.
|
|
|
First, the change in total active fire points of the different land-cover types from February 2000 to December 2011 was analysed on a yearly basis. The land-cover type with the majority of burning was croplands, and fire count increased annually because of the prescribed burning during harvest in China (Fig. 3). Broadleaf forests had the highest fire count among the forest types each year, probably because of the fact that these forests account for a larger area in China than any other forest. This result can also be attributed to the presence of numerous small fuel sources in broadleaf forests, such as plant litter and humus.
In addition, differences were found among the active fire counts proportion of the different land-cover types within the approximate 12-year study period. Fig. 4 demonstrates that crop was the vegetation type with the highest number of fire pixels, accounting for 37.5% of the total number of fires, followed by the broadleaf forest (21.2%). The percentage of the mixed forests was much lower than that of the needle-leaf or broadleaf forests, with only ~2.7%. The proportion for the bamboo was the lowest, with ~1.0%.
The average monthly fire percentage of fires recorded for the different land-cover types was also analysed. Seasonal differences were found among the different land-cover types (Table 1). For example, the number of broadleaf forest active fire points (Table 1, Fig. 5) showed that two burning periods with percentages higher than 10% occurred during the 12-year study period. The spring burn period occurred from February to April, occupying 13.42, 20.26 and 16.75% of all the number of broadleaf forests fires, respectively. The autumn burn period occurred in October, with 11.49%. However, the result (Table 1) shows that many croplands fires occurred in May (12.07% of the total number of croplands fires) and June (35.31%).

|
Spatial distribution pattern
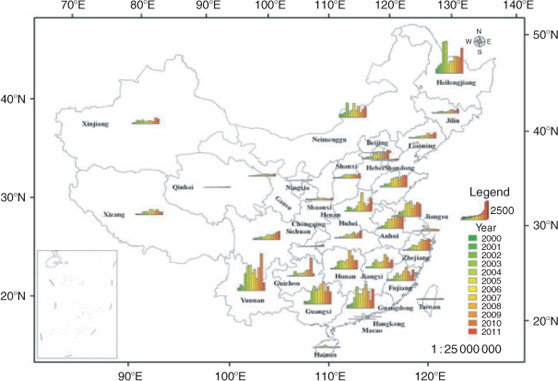
To identify the spatial distribution of biomass burning, the number of burning pixels in different provinces was determined with the validated burning detection data during the 12-year period. The results show that the burning pixels were mainly located in the provinces situated in the north-east, south-west and south of China, including Heilongjiang, Yunnan, Guangdong and Guangxi. Heilongjiang Province had the highest total number of fires among all the provinces during the 12 years, followed by Yunnan, Guangdong and Guangxi (Fig. 6). In contrast, fewer burning pixels occurred in the western provinces, such as Xinjiang, Ningxia and Qinghai.
|
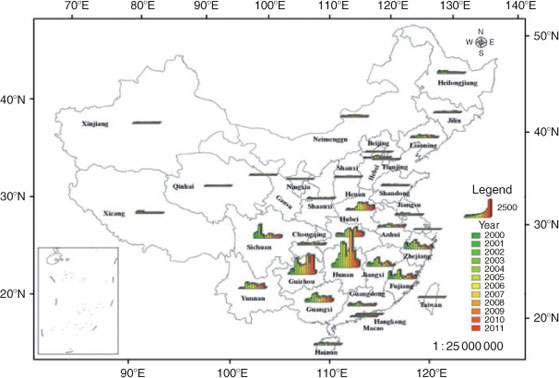
In addition, the forest fire occurrence was determined annually within the 12-year period with the national statistical forest fire data at the provincial level (Fig. 6). The spatial distribution characteristics were different with the result obtained using the MODIS active fire data (Fig. 6). Figs 6 and 7 provide different provincial results in terms of the province with the highest fire occurrence. Heilongjiang Province had the highest fire count from the validated MODIS active fire data during the 12-year study period (Fig. 6). In contrast, Fig. 7 shows that the Hunan Province had the highest forest fire occurrence, followed by Guizhou Province. Shanghai, Qinghai and Ningxia had the lowest forest fire occurrence. In fact, some provinces usually did not report the correct fire occurrence and burned area in the statistical data in China. At the same time, no forest fire information for Taiwan, Hong Kong or Macao were found in the national statistical forest fire data for the 12-year study period.
|
Obvious differences were found in the percentage calculated by using the MODIS active fire detections and the statistical fire data at province level within the 12-year study period (Table 2). Heilongjiang Province had the highest percentage in the study years, accounting for 10.72% of the total active fire points detected by the MODIS sensor, followed by Yunnan Province, with 10.14%. Xinjiang, Qinghai and Hong Kong had the lowest proportion (~0.1%). No fire activity information had been recorded by the MODIS active fire products within the 12-year period in Macao. However, based on the statistical forest fire data from 2000 to 2011, Hunan Province had the highest forest fire occurrence (21.84%) of all the provinces, followed by Guizhou Province (14.66%). Beijing, Tianjin, Ningxia, Gansu and Qinghai had the lowest proportion of forest fire occurrence (~0.1%). In addition, no forest fire information was available for Taiwan, Hong Kong or Macao in the Chinese statistical fire data. The discrepancy in the total amount of fire between the two data sources can be explained in part by the absence of an effective fire monitoring system at the national or provincial levels before the development of satellite-based algorithms for fire detection. As shown in the previous result (Fig. 2), the active fire counts do not directly translate into burned area, but are still indicative of the total level of fire activity. Therefore, we believe that the MODIS-based analysis provides a more complete quantification of fire occurrence in China.
|
The number of active fire pixels for every 1-km2 spatial resolution grid was calculated to determine the fire density in each 1-km2 spatial resolution area. The fire pixels were irregularly distributed in each district and county (Fig. 8). Most fire sites are located in the edge zone between grasslands and croplands. There were only 4.04% of land areas with active fire and 73.72% of those had only one fire in the 1-km2 spatial resolution area during the 12 years studied in China. The chance of recurred burning at the same location was shown to be very low during the period.
|
Temporal distribution pattern
The temporal distribution pattern of the active fire points was also analysed. The monthly counts of fire detections are shown in Fig. 9. It shows that the number of fire detections varied every month. However, the general trend was a gradual increase of count from February 2000 to December 2011. The number of fires in the spring of 2008 and 2009 increased significantly because a lot of live vegetation had been withered or killed during the 2008 spring frost disaster in the south of China. The months with the highest number of active fire points over the 12-year study period were March 2008 and February 2009. As shown in Fig. 9, the number of recorded fires before 2002 was lower because of the availability of Terra/MODIS fire products before 4 July 2002 and its operational gaps in 2000 and 2001.
|
Four fire seasons were found to have occurred within 1 year (Fig. 9). The first fire season was from January to June. The active fire detections showed an increasing trend, which is attributed to prescribed fires as well as the numerous forest fires that occurred in the south, south-west and north-east of China. The second fire season was from July to September and showed a decreasing amount of active fire detections because the vegetation turned green and precipitation was abundant. The third fire season was from September to November and showed an increase in active fire detections because of the senescent vegetation, harvest and lack of precipitation. The fourth fire season was from November to January of the following year and showed a decreasing amount of fires. Air temperatures were lowest during this period and combustion activities in China were reduced.
The MODIS active fire records showed that there were 4 months (June, April, March and February) that each made up more than 10% of the total percentage of fire records over the 12-year study period (Fig. 10). Their total proportion was 52.7%. The highest active fire proportion month was June (15.6%), followed by March (14.0%). The month with the lowest proportion was September (4.0%).
|
The annual forest fire occurrence by province was analysed with statistical data because monthly forest fire records of all Chinese provinces were not available. Parts of these results are shown in Figs 7 and 11. Different annual fire percentage results were obtained when using (1) the MODIS fire data and (2) the statistical fire data (Fig. 11), but the change trends when using these two datasets were very similar.
|
Conclusions
Characterising vegetative biomass burning in China at national scale has been studied based on the analyses of MODIS active fire product data, statistical fire data and vegetation type maps. First, the general characteristics of biomass burning have been studied at a national scale in China by using the long time series MODIS active fire data and background information, which have not been analysed in the past. The results show that the majority of vegetative biomass burning in China at a national scale during 2000–2011 took place in croplands (37.5%), which had not been considered as a source of atmospheric pollution in China in the past, and followed by broadleaf forests (21.2%). Second, our results show that satellite records of fire occurrence in China differ from the national statistics. Three high-density fire regions of China at a national scale were identified when we integrated the results of spatial and temporal analyses by using the MODIS active fire pixels from 2000 to 2011. The first region was Heilongjiang Province in north-east China, where many large forest fires had been detected during April–May and September–October. Another was Yunnan Province, which is located in south-west China, where several small forest fires occurred during December–May. The last region with high-density fires was Guangdong Province and Guangxi Autonomous Region in south China, where most fires were in cropland burning during November–March. The highest percentage of total fire pixels was observed in Heilongjiang Province (10.72%), followed by Yunnan (10.14%), Guangdong (8.36%) and Guangxi (7.97%). Several fires took place in February–April and June, all with percentages higher than 10% of the total percentage of fire records. The percentage during the other months was lower than 10%. These results highlight the value of satellite observations for scientific research and management purposes.
Acknowledgements
This study was financially supported by the 21-Y30B05-9001-13/15, E0305/1112/05 and the ‘863’ projects. The MODIS fire product data used in the study were obtained from the UMD FTP server (ftp://mapsftp.geog.umd.edu/). We express our sincere thanks to the reviewers and editors, who have given useful comments and detailed suggestions for the manuscript.
References
Bartlein PJ, Hostetler SW, Shafer SL, Holman JO, Solomon AM (2008) Temporal and spatial structure in a daily wildfire-start data set from the western United States (1986–96). International Journal of Wildland Fire 17, 8–17.| Temporal and spatial structure in a daily wildfire-start data set from the western United States (1986–96).Crossref | GoogleScholarGoogle Scholar |
Devineau JL, Fournier A, Nignan S (2010) Savanna fire regimes assessment with MODIS fire data: their relationship to land cover and plant species distribution in western Burkina Faso (West Africa). Journal of Arid Environments 74, 1092–1101.
| Savanna fire regimes assessment with MODIS fire data: their relationship to land cover and plant species distribution in western Burkina Faso (West Africa).Crossref | GoogleScholarGoogle Scholar |
Dozier J (1981) A method for satellite identification of surface temperature fields of subpixel resolution Remote Sensing of Environment 11, 221–229.
| A method for satellite identification of surface temperature fields of subpixel resolutionCrossref | GoogleScholarGoogle Scholar |
Giglio L, Descloitres J, Justice CO, Kaufman Y (2003) An enhanced contextual fire detection algorithm for MODIS. Remote Sensing of Environment 87, 273–282.
| An enhanced contextual fire detection algorithm for MODIS.Crossref | GoogleScholarGoogle Scholar |
Grala K, Cooke WH (2010) Spatial and temporal characteristics of wildfires in Mississippi, USA. International Journal of Wildland Fire 19, 14–28.
| Spatial and temporal characteristics of wildfires in Mississippi, USA.Crossref | GoogleScholarGoogle Scholar |
Guild LS, Kauffman JB, Cohen WB, Hlavka CA, Ward DE (2004) Modeling biomass burning emissions for Amazon forest and pastures in RondÔnia, Brazil. Ecological Applications 14, 232–246.
| Modeling biomass burning emissions for Amazon forest and pastures in RondÔnia, Brazil.Crossref | GoogleScholarGoogle Scholar |
Justice CO, Giglio L, Korontzi S, Owen J, Morisette JT, Roy D, Descloitres J, Alleaume S, Petitcolin F, Kaufman Y (2002) The MODIS fire products. Remote Sensing of Environment 83, 244–262.
| The MODIS fire products.Crossref | GoogleScholarGoogle Scholar |
Larsen CPS (1997) Spatial and temporal variations in boreal forest fire frequency in Alberta. Journal of Biogeography 24, 663–673.
| Spatial and temporal variations in boreal forest fire frequency in Alberta.Crossref | GoogleScholarGoogle Scholar |
Pew KL, Larsen CPS (2001) GIS analysis of spatial and temporal patterns of human caused wildfires in the temperate rain forest of Vancouver Island, Canada. Forest Ecology and Management 140, 1–18.
| GIS analysis of spatial and temporal patterns of human caused wildfires in the temperate rain forest of Vancouver Island, Canada.Crossref | GoogleScholarGoogle Scholar |
Syphard AD, Radeloff VC, Keuler NS, Taylor RS, Hawbaker TJ, Stewart SI, Clayton MK (2008) Predicting spatial patterns of fire in a southern California landscape. International Journal of Wildland Fire 17, 602–613.
| Predicting spatial patterns of fire in a southern California landscape.Crossref | GoogleScholarGoogle Scholar |
Tian XR, Shu LF, Wang MY, Zhao FJ (2007) Study on the spatial and temporal distribution of forest fire in Tibet. Fire Safety Science 16, 10–14.
Vadrevu KP, Badarinath KVS (2009) Spatial pattern analysis of fire events in central India – a case study. Geocarto International 24, 115–131.
| Spatial pattern analysis of fire events in central India – a case study.Crossref | GoogleScholarGoogle Scholar |
Wallace LL, Crosthwaite KA (2005) The effect of fire spatial scale on bison grazing intensity. Landscape Ecology 20, 337–349.
| The effect of fire spatial scale on bison grazing intensity.Crossref | GoogleScholarGoogle Scholar |
Wittenberg L, Malkinson D (2009) Spatio-temporal perspectives of forest fires regimes in a maturing Mediterranean mixed pine landscape. European Journal Forest Research 128, 297–304.
| Spatio-temporal perspectives of forest fires regimes in a maturing Mediterranean mixed pine landscape.Crossref | GoogleScholarGoogle Scholar |
Yang J, He HS, Shifley SR, Gustafson EJ (2007) Spatial patterns of modern period human-caused fire occurrence in Missouri Ozark Highlands. Forest Science 53, 1–15.
Yang GB, Tang XM, Ning JJ, Yu DY (2009) Spatial and temporal distribution pattern of forest fire occurred in Beijing from 1986 to 2006. Scientia Silvae Sinicae 45, 90–95.
Zhang ZX, Zhang HY, Zhou DW (2010) Using GIS spatial analysis and logistic regression to predict the probabilities of human-caused grassland fires. Journal of Arid Environments 74, 386–393.
| Using GIS spatial analysis and logistic regression to predict the probabilities of human-caused grassland fires.Crossref | GoogleScholarGoogle Scholar |
Zhao FJ, Shu LF, Di XY, Tian XR, Wang MY (2009) Changes in the occurring date of forest fires in the Inner Mongolia Daxing’anling forest region under global warming. Scientia Silvae Sinicae 45, 166–172.