

Environmental assessment of erosion following prescribed burning in the Mount Lofty Ranges, Australia
Rowena H. Morris A B C F , Ross A. Bradstock B C , Deirdre Dragovich D , Meredith K. Henderson B E , Trent D. Penman C and Bertram Ostendorf AA Landscape Sciences, School of Earth and Environmental Sciences, The University of Adelaide, Adelaide, SA 5005, Australia.
B Bushfire Cooperative Research Centre, Level 5, 340 Albert Street, East Melbourne, Vic. 3002, Australia.
C Centre for Environmental Risk Management of Bushfires, Institute for Conservation Biology and Environmental Management, University of Wollongong, NSW 2522, Australia.
D School of Geosciences, The University of Sydney, Sydney, NSW 2006, Australia.
E Science, Monitoring and Knowledge Branch, Department of Environment, Water and Natural Resources, GPO Box 1047, Adelaide, SA 5000, Australia.
F Corresponding author. Email: rowena.morris@adelaide.edu.au
International Journal of Wildland Fire 23(1) 104-116 https://doi.org/10.1071/WF13011
Submitted: 19 January 2013 Accepted: 15 June 2013 Published: 22 October 2013
Abstract
Erosion following fire has the potential to affect water quality, alter soil profiles and detrimentally affect human infrastructure. There is a clear need for environmental assessments to have regard for erosion concerns from prescribed burning. This study focussed on 10 prescribed burns conducted in the Southern Mount Lofty Ranges. Generalised additive modelling was used to determine the main significant environmental variables influencing the presence of sediment movement at 505 field-assessed sites. Sediment movement after the 10 prescribed burns was minor. Fire severity was a highly significant environmental determinant for the presence of sediment movement after prescribed burning. To predict erosion concerns, a suite of environmental variables is more reliable than focusing solely on slope steepness, as occurred before this study. These results indicate that erosion assessments need to consider a range of environmental variables to assess potential erosion and that land managers and scientists need to incorporate spatial sampling designs into erosion assessments.
Additional keywords: bioturbation, erosion assessment, fire severity, rainfall, sediment movement, slope, topography.
Introduction
Post-fire soil erosion is a concern due to its potential adverse effects on water quality, the alteration to soil profiles and detrimental effects on human communities. Water reservoirs have been decommissioned due to poor water quality following major wildfires (White et al. 2006; Smith et al. 2011). Fire can alter soil properties and cause redistribution of sediment within the hillslope, resulting in changes to the existing soil profile (Certini 2005; Shakesby and Doerr 2006). Post-fire soil erosion, especially debris flows, create a risk to human life and infrastructure (Cannon and Reneau 2000; Nyman et al. 2011). Erosion problems following prescribed fire (the intentional use of fire to achieve specific objectives) are less common than those studied following wildfire; however the risk is still present, as evident by the debris flow example provided by Cawson et al. (2012).
A wide variety of environmental variables influences the rates and extent of post-fire erosion (Shakesby and Doerr 2006; Shakesby et al. 2007; Shakesby 2011; Bento-Gonçalves et al. 2012). Fires of high severity remove substantial vegetation cover, exposing soil to rainfall and overland flow (Robichaud and Waldrop 1994; Cerdá and Doerr 2005). The duration and intensity of rainfall after fire influences the amount of water and its associated erosive processes (Inbar et al. 1998; Prosser and Williams 1998; Moody and Martin 2001a). Steeper slope gradients and longer slope lengths increase sediment movement (Wright et al. 1976; Smith and Dragovich 2008). Drainage patterns and connectivity (Kirkby et al. 2005; Moody et al. 2008) govern water flow characteristics that subsequently transport the eroded material from the burnt sites. Soil properties alter the sediment grain dispersal characteristics (Certini 2005). Bioturbation influences infiltration (Shakesby et al. 2006) and bio-transfer (Dragovich and Morris 2002a; Cerdá and Doerr 2010; Richards et al. 2011). Restoration strategies and mitigation also have the ability to influence post-fire erosion (Cerdá and Robichaud 2009).
Predicting post-fire erosion effects is difficult due to the wide variety of variables and the complex interactions that result in differing magnitudes of soil erosion (Benavides-Solorio and MacDonald 2005). Work in the US has developed a suite of management ‘tools’ designed to assist land managers with work in the post-wildfire environment (Robichaud and Ashmun 2013). Assessing post-fire erosion concerns in Australia could be enhanced by trialling and adopting similar methods.
Within Australia each state has its own system for assessment of erosion potential. For example, in New South Wales (NSW) a code has been developed to streamline environmental approval for hazard reduction works (Brompton et al. 2006). In NSW, if a soil erosion risk map does not exist, moderate or higher intensity prescribed fires are not to be applied to slopes steeper than 18°. In South Australia, managers use conceptual models in relation to predicting potential erosion and are currently in the process of developing various new written guidelines in relation to predicting environmental effects from prescribed burning. Previous environmental reviews (Table 1) have mainly focussed on slope steepness in relation to erosion concerns after prescribed burning.

|
Given that many variables may influence post-fire erosion, it is questionable whether a threshold slope of 18° (slope gradient 1 : 3) is the only variable that needs to be considered for assessments. In order for land managers to successfully assess and predict erosion potential there is a need for an environmental assessment that encompasses the main variables that influence post-fire erosion. In this study, erosion following prescribed burning was assessed in managed reserves in South Australia. The objectives of this study were to (1) test if prescribed burning in the Southern Mount Lofty Ranges increased the amount of sediment movement; (2) model the probability of sediment movement occurring following prescribed fire in the Southern Mount Lofty Ranges and (3) to determine the influence of slope on post-fire erosion.
Study area
The study area (Fig. 1) is located in the Southern Mount Lofty Ranges to the east of Adelaide (35°07′S,138°41′E) in a temperate Mediterranean climate zone, with warm to hot, dry summers and mild to cool, wet winters. The Southern Mount Lofty Ranges are composed of deformed Proterozoic and Cambrian sedimentary rocks of the Adelaide Fold Belt which include quartzite, shale, dolomite, sandstone and conglomerate lithologies (GSAA 1962; Daily et al. 1976). Soils formed from these rocks are mainly shallow to moderately deep acidic soils (Soil and Land Program 2007). Soils in the study region are susceptible to erosion with a total of ~40% of the area having erosion rates of above 1 t ha–1 per year in unburnt conditions (Wilkinson et al. 2005). The topography is dissected by small tributaries that feed into the Gawler, Torrens and Onkaparinga Rivers (Fig. 1) and >10% of the study area has slope angles greater than 18°. Native vegetation consists predominantly of dry eucalypt forests and woodlands with either grassy or shrubby understoreys (Armstrong et al. 2003).
|
Annual rainfall during the study period at Mount Lofty Botanic Gardens (Australian Bureau of Meteorology (BOM) station ID 023788: 34°58′57″S, 138°43′11″E; elevation 510 m) was 1112 mm in 2007, 1016 mm in 2008 and 1280 mm in 2009. Between 2007 and 2009, 78% of the combined monthly rainfall was recorded from April to September.
Wildfires have influenced land formation in the study area over thousands of years (Bickford and Gell 2005; Buckman et al. 2009). Wildfires such as ‘Ash Wednesday’ 1983 burnt between 158 000 to 208 000 ha in South Australia (Healey et al. 1985). In the study area 186 wildfires burning 10 500 ha were recorded between July 2001 and June 2010 (Department of Environment, Water and Natural Resources (DEWNR) Fire History database). Local fire authorities have increasingly been using prescribed burning to reduce fuel loads in order to minimise the intensity and rate of spread of wildfires.
Methods
Spatial field sampling design
The study uses 10 prescribed burns located within the Southern Mount Lofty Ranges (Fig. 1, Table 1) that were part of the annual fuel reduction program from 2007 to 2009. Prescribed burns ranged in size from 1 to 58 ha with an average area of 14 ha. Fire severity varied both within and between the burns ranging from low (ground fuels and low shrubs burnt) to very high (ground fuels and lower shrubs burnt; upper canopy consumed). Four of the burns contained patchy unburnt sections within the burn perimeter.
Erosion assessments were made for 505 sites at regular intervals along linear transects within the 10 burns. Transects were selected to run parallel and perpendicular to the hillslope in order to include samples from ridgetop to drainage lines as well as to include variability within hillslope positions such as wash deposits and surface bioturbation. The interval between transect lines and points on most lines was 10 or 20 m depending on the size of the prescribed burns. Only one burn (‘Wildlife’, Fig. 1) was sampled at a larger spacing with 500-m distances between transect lines and 50-m distances between points. Where possible, transects cover both unburnt and burnt areas. Of the 505 sites assessed, 342 were within the prescribed burns and 163 control sites adjoined the burns.
Erosion assessment and environmental variables
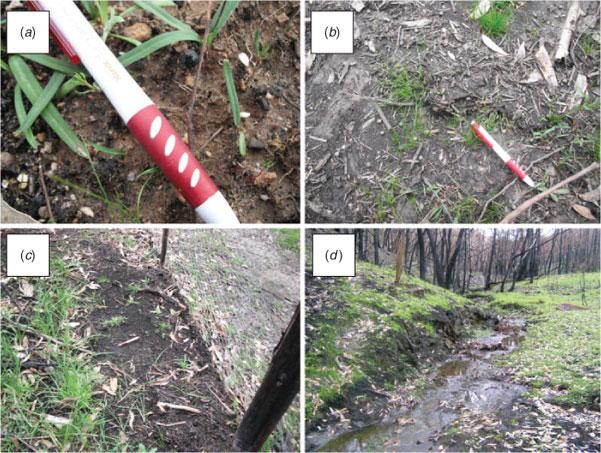
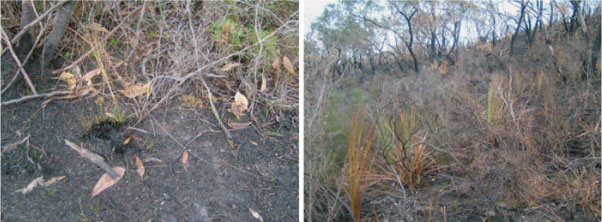
Erosion assessment was based on a framework of sediment movement classes described by Morris et al. (2011) (Table 2). At each of the 505 sites, a circular area with a 1.5-m diameter was classified into one of six erosion categories ranging from 0 to 5. At each assessment site any erosion or deposition was recorded, noting the type of erosion features (Fig. 2). Any obvious erosion or deposition depths were measured. A perimeter inspection was conducted at each burn to determine if any sediment had left the burn boundary.
|
|
Fire severity, rainfall, vegetation, soil properties, bioturbation and topographic data were collected for all sites using field observations or state-wide databases (Table 3). We adopted the fire severity classification of Chafer et al. (2004) for eucalypt forests and woodlands ranging from extreme (all green vegetation burnt and stems <10 mm thick incinerated) to low (ground fuels and low shrubs burnt). Daily rainfall data were sourced from the nearest operational BOM Automatic Weather Station or from the local rainfall data recorded at Mount Bold. Rainfall intensity average recurrence intervals were interpolated by the BOM. Total rainfall and days of rainfall greater than 5 mm were also considered.

|
Vegetation types were derived using the DEWNR floristic database (Armstrong et al. 2003). Field assessment of vegetation cover included ground, near surface, understorey and crown. Soil types and water erosion potential were derived using the land and soil spatial data for southern South Australia (Soil and Land Program 2007). The water erosion potential is a combination of slope and erodibility of soil landscape map units. Wet conditions precluded hydrophobicity testing. The presence of bioturbation in the surface soil layers was recorded, including the type and percentage cover. Topographic features were recorded in the field for most assessments. Slope angles were surveyed using a clinometer. Cross-slope curvatures were classified into convex, concave and planar. Slope lengths were measured using a 1 : 50 000 contour map (Country Fire Service 2000). Two measurements of slope length were made, the first to the burn perimeter and the second to the top of the water divide. Slope aspect was recorded using a magnetic compass.
Statistical modelling
Several variables were removed to avoid the effects of multi-collinearity. Correlations between all numerical predictor variables were compared using a Spearman rank correlation. Correlations >0.5 were removed to avoid the effects of multi-collinearity (Chatterjee et al. 2000). These variables included vegetation assessments that correlated with fire severity, rainfall variables that correlated with total rainfall and water erosion potential that correlated with slope degree (Table 4). Consequently the analysis was reduced to a maximum of nine variables: fire severity, rainfall, slope degree, slope length, aspect, bioturbation cover, canopy cover, cross-slope curvature and hillslope position (Tables 4, 5).
|
|
To fulfil the assumptions of the statistical methods, data were transformed before analysis. The dependant variables were transformed to a binary classification (i.e. presence or absence of sediment movement). A binary classification was used due to the minimal count of data in the sediment classes (Table 2) that were higher than category 2. Slope length, total rainfall and bioturbation cover were log-transformed before modelling to approximate a normal distribution. Aspects were transformed into degrees relative to north-west because these aspects receive the highest amount of radiation during the hottest part of the day.
Generalised additive models (GAM) were generated to examine different possible combinations of the selected predictor variables using the mgcv package in R (Wood 2006). We used GAMs as they allow for non-linear relationships by generating a smoothing function through the data (Zuur et al. 2009). All smoothing functions were limited to three knots, i.e. effective degrees of freedom, to avoid over-fitting of the data. Variables included in the model were classified as highly significant if P < 0.001, significant 0.01 < P < 0.05, marginal 0.05 < P < 0.1 and not significant if P > 0.1. Marginal effects represent the situation where the variable is not classically significant (P < 0.05) but there is a statistically meaningful trend that warrants inclusion in the model.
An information theoretic approach was adopted whereby we evaluated all permutations of the nine independent variables (511 models). The best set of models was identified using Akaike’s Information Criterion (AIC) (Akaike 1973) selecting only those models with 2 AIC points off the best model. Model fit was measured using the area under the curve (AUC) of the receiver operating characteristic (ROC) curve, where a measure of 0.5 represents an entirely random model, 0.7–0.8 fair, 0.8–0.9 good and >0.9, excellent (Thuiller et al. 2003). AUC was calculated using the pROC package (Robin et al. 2011). A further management model was tested that is based on the variables of the existing environmental assessments: slope degree, fire severity, total rainfall, fire perimeter and slope length (Table 1).
Results
Erosion assessment of the prescribed burns
Sediment movement classes (Table 2, Fig. 2) were easily distinguished in the field, with the most common observation being splash pedestals (Class 1). No visible sediment movement (Class 0) was observed at 48% of the burnt sites. Sediment movement occurred at over half the prescribed burn sites, with 40% of the sample being classified into Class 1 (Fig. 3). Class 1 features consisted mostly of splash pedestals, small areas of wash deposits and one observation of armouring. Class 2 features were comprised of depositional steps, wash deposits, litter dams and micro-terraces. Only 3% was classified into Class 3. Class 3 features observed included concentrated flows, rills, deposition greater than 10 mm and drainage scouring. No Class 4 events were present. At the unburnt control sites sediment movement occurred at only 4% of the sites, compared with the prescribed burnt sites where 52% of the sites had visible movement (Fig. 3). At the control sites only 1% of the samples assessed were equal or higher than Class 2 whereas the burnt sites had 11%.
|
Field observations at all prescribed burns recorded small sediment movement (Fig. 4). Where sediment movements were recorded it involved small distances, generally estimated to be less than 100 mm. The most frequent class for all but four of the burns was Class 0 (no movement). At Cleland S09b, Gate 17, Kangaroo and Mylor, Class 1 was the most frequent sediment movement class. No Class 4 or 5 movements were observed. Class 3 only occurred in minor amounts (<12%) at three of the burns: Gate 17, Kangaroo and Warren. Two of the nine Class 3 records were opportunistic observations from within obvious drainage locations.
|
Perimeter inspections identified sediment washes leaving two prescribed burn boundaries (Gate 17 and Kangaroo). A further two prescribed burns located at Mylor and Wotton had minor amounts of sediment leaving the burn perimeter. The sediment did not appear to travel further than 5 m from the burn sites and any visible evidence of water turbidity downstream from all burns was negligible.
Environmental variables and statistical models
Nine environmental variables were included in the best set of models that predicted the presence of sediment movement (Table 6). Seven alternative models were selected in the best set based on a difference in AIC of 2 (Burnham and Anderson 2002). The best model (Model 1) of the supported set had a good fit and explained 37.3% of the model deviance (Table 6). The detailed response of the critical variables is described below.

|
Total rainfall was a significant predictor variable in all models (P < 0.01). Rainfall has a positive influence on sediment movement if it is higher than ~150 mm (Fig. 5a). Confidence bands are relatively narrow over the entire rainfall range. At Cleland S09b the highest total rainfall of 689 mm was recorded between when the fire occurred and the field inspection was conducted. Five burn sites experienced rainfall that was greater than 30 mm over a 24-h period. Mylor had the lowest recorded rainfall totalling 32 mm over 48 days. Class 3 sediment movement only occurred at sites that had been subjected to rainfall that was >20 mm in a 24-h period. Observations of Class 1 movement were higher than for Class 0 for areas subjected to daily rainfall of 30 mm or greater. The highest rainfall intensity during the study in 2007 had an average recurrence interval of 1 in 5 years, with a total of 112 mm falling over a 72-h period (BOM station ID 023913: 35°4′47″S, 138°43′11″E; elevation 250 m).
|
Fire severity within the 10 prescribed burns ranged from unburnt to very high. In relation to unburnt sites fire severity was a highly significant predictor variable (P < 0.001) (Table 6). The probability of sediment movement occurring was more likely in burnt conditions than in unburnt conditions (Fig. 6). This probability increased by 20% between low to high fire severities depending on the variables included in the model (Fig. 6). There was not a large difference in the probability of sediment movement occurring between high and very high severities.

|
Class 3 sediment movements were not recorded in unburnt or low severity sites (Fig. 7). When the fire severities were high or very high, sediment movement in Class 1 was most likely (Fig. 7). By contrast, when fire severities were moderate or lower, sediment movement was minimal (i.e. mainly Class 0 and some Class 1, Fig. 7). Of the 342 sites within the burn perimeters, 22 were considered unburnt. Unburnt sites created patchy fire-severity mosaics within the prescribed burns (Fig. 8). At Wotton, Belair S09, Warren and Kangaroo patchy unburnt sites were recorded. Sediment movement at all patchy severity sites (except for two at Kangaroo) were classed as 0.
|
|
Within the preferred set of models the topographic properties including aspect relative to north-west, slope length, slope degree, hillslope position and cross-slope curvature all contributed to the prediction of sediment movement occurring. South-eastern aspects increased the probability of sediment movement occurring (Fig. 5b). Aspect relative to north-west was included in all of the best set of probability models as either a significant relationship (P < 0.05, six of seven models) or a marginal effect (P < 0.1, one of seven models) (Table 6, Fig. 5b). Slope length (Fig. 5c) was included in all of the best set of probability models as either a significant effect (P < 0.05, five of seven models), marginal effect (P < 0.1, one of seven models) or a non-significant relationship (P = 0.15, one of seven models) (Table 6). Above 50 m the effect of slope increased in a linear manner (Fig. 5c).
Slope steepness within the 10 prescribed burns varied from 0 to 35° (Fig. 5d). Slope degree was included in five of the best set of seven probability models as a non-significant relationship (P > 0.13) (Table 6). Slope degree was not a significant predictor in any of the best models. Above 18° the effect of slope increased in a linear manner (Fig. 5d).
In two of the best fitting models slope position was included. Lower slopes were significant (P < 0.05) in relation to drainage lines for two of the seven models. The presence of sediment movement was less likely on lower slopes than along drainage lines. Upper slopes were not significant (P > 0.1) in relation to drainage lines for two of the seven models. Both mid-slope and ridge positions contributed a marginal effect (P < 0.1) in relation to drainage lines for two of the seven models. Planar cross-slope curvatures were significant in relation to concave in six of the seven models (P < 0.05) whereas convex slopes were not significant (P > 0.1) compared with concave slopes in all models. Concave cross-slope curvatures were more likely to experience sediment movement than were planar cross-slope curvatures.
Bioturbation cover had a significant effect (P < 0.05) in all best-fitting models (Table 6). Increased bioturbation cover increased the probability of sediment movement occurring (Fig. 5e); however the 95% confidence intervals also increased as the cover increased. Bioturbation was visible on 129 of the 505 sites. The types of bioturbation observed included diggings, scratchings, burrows, tracks, mounds, holes and worm castings. When bioturbation was present the average surface cover was 6.5%; if diggings and scratchings were involved the average surface cover was 13.0%. The mean cover of bioturbation at all sites was 1.7%.
An alternative regression model incorporating the four variables used in the existing pre-burn environmental assessments (Table 6) had a good fit with an AUC of 0.86 and explained 32.0% of the model deviance. The AIC point rose by 16.23 when only the management variables were considered, suggesting no support (Burnham and Anderson 2002) (Table 6).
Discussion
Prescribed burn erosion assessment
The presence of erosion after prescribed burning in the study area was extensive in area but small in magnitude. Sediment movement was minor as evident by the clear lack of major erosion features such as erosion gullies, debris flows or numerous rills. The main types of features observed were splash pedestals and small wash deposits, indicating only localised sediment movement (Fig. 2, 3).
Our results support other studies from different locations (Coelho et al. 2004; Benavides-Solorio and MacDonald 2005) that reported minimal erosion following prescribed fire. These results are not consistent with those reported by Moffet et al. (2007) or the debris flow case study provided by Cawson et al. (2012). Moffet et al. (2007) found that rill erosion was the dominant erosion process following fire and that soil erosion increased 100 times following prescribed fire. Our different result may be attributed to the other studies having higher fire severities, less spatial coverage in their experimental designs, larger fire sizes and the use of simulated rainfall rather than observing natural rainfall conditions.
The types of movement, such as splash pedestals, observed in the study area were likely to contribute to the redistribution of nutrients and seeds within the soil profile but were unlikely to be responsible for substantial removal of the surface soils. Although this study did not observe any high magnitude events such as the debris flow described by Cawson et al. (2012), the potential for high magnitude events in the Mount Lofty Ranges is possible. Landslides and bog failures have been reported in the local area (Middelmann 2007; Buckman et al. 2009); however at this stage none has been reported in relation to prescribed burning.
Determinants of erosion
Based on the preferred model (Table 6) the main variables that could be used to predict potential erosion for pre-burn environmental assessment include fire severity, rainfall, aspect relative to north-west, bioturbation, slope length and slope degree. In the study area the presence of Class 3 sediment movement only occurred where the fire severities were moderate or higher (Fig. 7). A switch in fire severity from high to low reduced the likelihood of sediment movement occurring by 0.2 (Fig. 6). These results are in contrast to the outcomes of Cawson et al. (2011) who found on planar slopes little difference in sediment yields between high and low fire severities. Our results support the finding by Dragovich and Morris (2002b) and Benavides-Solorio and MacDonald (2005) that fire severity is one of the most important factors controlling post-fire erosion rates.
Fire severities varied from low to high within the 10 prescribed burns. Six percent of the burnt dataset comprised unburnt patches (Fig. 8). In relation to unburnt patches reducing sediment loads, our results support the finding by Cawson et al. (2011) that unburnt patches on a burnt hillslope are highly effective at reducing runoff and sediment from burnt areas above. There were no recorded unburnt patches within the Gate 17 burn, where over two-thirds of the burn showed evidence of sediment movement and in some areas the sediment left the burn perimeter. All patchy severity sites apart from two at the Kangaroo burn were classed as 0, indicating no evidence of sediment movement occurring. Prescribed burns that are patchy (i.e. with unburnt areas) may result in minimal erosion potential.
Rainfall characteristics influence post-fire erosion by altering the hydrological processes that control the transport of sediment (Inbar et al. 1998; Prosser and Williams 1998; Moody and Martin 2001b; Shakesby and Doerr 2006). Class 3 sediment movement only occurred at sites with a total rainfall >108 mm. The prescribed burn with the most sediment movement experienced a 1 in 5 year rainfall event totalling 112 mm of rain in 72 h. The maximum rainfall intensity for 30 min was 12 mm, which has an average return interval of 1–2 years (BOM station ID 023913). Daily rainfall needed to be 20 mm or more for records of Class 3 sediment movement to occur. As rainfall increased, the trend for sediment movement to occur also increased (Fig. 5a). Although the probability model in this study used total rainfall, additional investigation to incorporate rainfall intensities may allow for refinement of the model. Based on research by Inbar et al. (1998) and Moody and Martin (2001a) we consider that differing rainfall intensities could alter the potential magnitude of erosion. Probability modelling of differing magnitudes of soil erosion following prescribed burning from differing rainfall intensities is required to test this hypothesis.
Aspects relative to north-west were also incorporated into the supported set of seven models as either a significant (P < 0.05) or marginal effect (P < 0.1) (Table 6). The presence of sediment movement tended to increase away from north-west aspects. This may be due to the indirect influence of wind. During winter, westerly winds bring moisture to the Mount Lofty Ranges and in summer northerly winds originating from central Australia bring dry conditions (DEH 2009). These moisture gradients may have influenced the associated vegetation regrowth that subsequently provided stability to the recently exposed surface soils. Inbar et al. (1998) recorded a larger amount of sediment yield for southerly aspects in Israel during the first year after fire, then little difference in subsequent years. In California, United States, Kinoshita and Hogue (2011) found that vegetation on the north and east aspect recovered more quickly than that on south and west aspects, due to retained soil moisture.
Topography influences soil erosion by varying a site’s slope characteristics and drainage connectivity. Slope length was included in all of the supported set of models (Table 6). Areas with short slope lengths reduce the runoff potential (Kirkby et al. 2005), which in turn reduces the likelihood of runoff velocities capable of entraining and transporting sediment. To generate Class 3 sediment movement the minimal slope length recorded at Mount Lofty was 40 m. Slope degree was included in five of the supported set of models as a non-significant relationship (Table 6). The non-significance outcome attributed to slope steepness may be explained by the suite of variables used in the modelling process, the low magnitude fire and rainfall events covered by the study, and the spatial field sampling design that assessed the variability within the hillslope. Sediment movements were less likely on planar than on concave cross-slope curvatures. These results support those of Benavides-Solorio and MacDonald (2005) who found that swales generally produced more sediment per unit area than did planar hillslopes. Terrestrial laser scanned models from the Southern Mount Lofty (Morris et al. 2012) also highlighted that larger amounts of sediment movement occurred on concave cross-slope curvatures. It is interesting to note that the 18° slope threshold, above which we observed an increased probability in sediment movement, is also the geotechnical engineering threshold used in the prescribed burning review of the environmental assessments (Table 1).
Bioturbation was a significant (P < 0.05) predictor variable in all of the supported seven models (Table 6). The influence of bioturbation on post-fire erosion depends on the location and associated fauna. At the study area the degree to which bioturbation influenced the sites depended on the presence of burrowing or digging fauna species. Mound-building ants and surface-digging Superb Lyrebirds (Menura novaehollandiae) observed in the Blue Mountains (Dragovich and Morris 2002a; Richards et al. 2011) were either limited (ants) or non-existent (lyrebirds) in the study area. The types of species moving surface material in the study area were Southern brown bandicoot (Isoodon obesulus), Short-beaked echidna (Tachyglossus aculeatus), worms and limited mound-building ant species.
Implications for environmental assessment of burning operations
Environmental assessment in relation to erosion from prescribed burning relies on using environmental variables to predict the occurrence and magnitude of sediment movement. In total nine out of 10 pre-burn environmental reviews focussed on the slope steepness of >18° (Table 1). The threshold value of 18° is derived from a 1 : 3 slope gradient (1 : 3 gradient equals 18.43°). In this study the probability of sediment movement occurring increased from 18° onwards (Fig. 5d). Gyasi-Agyei (2006) considered that prescribed burning on slopes steeper than 20° may not be appropriate, emphasising the need for reliable data.
Based on our results, sediment movement after burning on slopes steeper than 20° depends on all the variables identified in our modelling. For example, based on the best model (Table 6) the probability of sediment movement occurring on a 20° slope can vary from 0.20 to 0.63 for low fire severity and 0.38 to 0.81 for high severity fire, when the numerical predictor variables are altered from the lower to the upper quartile. To reject burning based solely on the slope angle is not supported by our probability model. Given the need to incorporate more environmental variables, there is a clear need to develop more robust post-fire erosion models for South Australia such as those described by Robichaud and Ashmun (2013) to assist land managers working in the post-fire environment.
Further research is needed in order to predict sediment movement within differing landscapes containing varied vegetation types and climates. The magnitude of post-fire erosion is also a significant management issue (Cawson et al. 2012). Although this study modelled the probability of sediment movement occurring, the limited data on high magnitude events such as Class 3 and above precluded the reliable modelling of differing magnitudes. Given the limited data available on high magnitude events there is a clear need to collect more information of this kind.
Conclusion
Following the 10 prescribed burns in the Southern Mount Lofty Ranges sediment movement was minimal as evident in the types of erosion features observed such as splash pedestals and small wash deposits. Sediment movement occurred at 52% of the prescribed burn sites compared with only 4% at the unburnt control sites. Unburnt patches within the 10 prescribed burns reduced the erosion potential. Evidence of sediment washes leaving the burn perimeters was negligible in six of the burns and minor in the other four. No debris flows, gullies or concentrated rills were evident following the 10 prescribed burns.
Based on generalised additive modelling this study concluded that a suite of environmental variables is more reliable to determine the occurrence of sediment movement than focusing only on slope steepness. Although slope steepness was a contributing variable in the best models it was not considered significant. Alternative slope properties including cross-slope curvature, slope length and hillslope position were found to be significant variables. Fire severity was a highly significant environmental determinant for the presence of sediment movement after prescribed burning. The main determinants of sediment movement derived from the best set of models included nine variables: fire severity, rainfall, slope degree, slope length, aspect relative to north-west, bioturbation cover, canopy cover, cross-slope curvature and hillslope position.
Management implications from this study relate to environmental assessments, operational burning and future research. Environmental assessments need to consider a range of environmental variables rather than relying on slope steepness to predict potential erosion from prescribed burning. Burning operations need to appreciate the significant influence that fire severity has on sediment movement. Reducing fire severity from high to low reduces the potential for erosion issues. Providing patchy fire severities also reduces the likelihood of erosion occurring. The influence of concave cross-slope curvatures and slope length highlights the clear need for adequate spatial sampling to be incorporated into experimental designs for both environmental assessment of erosion and future post-fire erosion studies.
Acknowledgements
Thanks are extended to staff from Department of Environment, Water and Natural Resources (formerly known as Department of Environment and Heritage) and SA Water. Project operational advice was provided by Ian Tanner and Danni Boddington, local burn details were given by DEWNR staff including Tammy Leggett, Richards Coombs, Anne McLean and Tim Groves. Peter Clinton and Linton Johnson from the Bureau of Meteorology analysed the rainfall–intensity–frequency duration data. We thank Anne Porter, Wollongong University for her assistance with statistics. Funding from the Bushfire Cooperative Research Centre is acknowledged. Thanks are also extended to the anonymous reviewers for their helpful suggestions.
References
Akaike H (1973) Information theory as an extension of the maximum likelihood principle. In ‘Second International Symposium on Information Theory’, 2–8 September 1971, Tsahkadsor, Armenia. (Eds BN Petrov, F Csádki) pp. 267–281. (Akademiai Kiado: Budapest, Hungary)Armstrong DM, Croft SJ, Foulkes JN (2003) ‘A Biological Survey of the Southern Mount Lofty Ranges, South Australia, 2000–2001.’ (Government of South Australia, Department for Environment and Heritage, South Australia: Adelaide)
Benavides-Solorio JDD, MacDonald LH (2005) Measurement and prediction of post-fire erosion at the hillslope scale, Colorado Front Range. International Journal of Wildland Fire 14, 457–474.
| Measurement and prediction of post-fire erosion at the hillslope scale, Colorado Front Range.Crossref | GoogleScholarGoogle Scholar |
Bento-Gonçalves A, Vieira A, Úbeda X, Martin D (2012) Fire and soils: key concepts and recent advances. Geoderma 191, 3–13.
| Fire and soils: key concepts and recent advances.Crossref | GoogleScholarGoogle Scholar |
Bickford S, Gell P (2005) Holocene vegetation change, Aboriginal wetland use and the impact of European settlement on the Fleurieu Peninsula, South Australia. The Holocene 15, 200–215.
| Holocene vegetation change, Aboriginal wetland use and the impact of European settlement on the Fleurieu Peninsula, South Australia.Crossref | GoogleScholarGoogle Scholar |
Bracken LJ, Kirkby MJ (2005) Differences in hillslope runoff and sediment transport rates within two semi-arid catchments in southeast Spain. Geomorphology 68, 183–200.
| Differences in hillslope runoff and sediment transport rates within two semi-arid catchments in southeast Spain.Crossref | GoogleScholarGoogle Scholar |
Brompton B, Kenny BJ, Heemstra S (2006) Streamlined environmental assessment or bush fire hazard reduction work in NSW. In ‘Proceedings of the 10th Biennial Australasian Bushfire Conference Series, Bushfire2006: Life in a Fire Prone Environment-Translating Science into Practice’, 6–9 June 2006, Brisbane, Australia. (Ed. C Tran). Paper number 52. Available at http://www.fireandbiodiversity.org.au/_literature_48235/Streamlined_environmental_assessment_for_bushfire_hazard_reduction_work_in_NSW [Verified]
Buckman S, Brownlie KC, Bourman RP, Murray-Wallace CV, Morris RH, Lachlan TJ, Roberts RG, Arnold LJ, Cann JH (2009) Holocene palaeofire records in a high-level, proximal valley-fill (Wilson Bog), Mount Lofty Ranges, South Australia. The Holocene 19, 1017–1029.
| Holocene palaeofire records in a high-level, proximal valley-fill (Wilson Bog), Mount Lofty Ranges, South Australia.Crossref | GoogleScholarGoogle Scholar |
Burnham KP, Anderson DR (2002) ‘Model Selection and Multimodel Inference: A Practical Information–Theoretic Approach.’ (Springer: New York)
Cannon SH, Reneau SL (2000) Conditions for generation of fire-related debris flows, Capulin Canyon, New Mexico. Earth Surface Processes and Landforms 25, 1103–1121.
| Conditions for generation of fire-related debris flows, Capulin Canyon, New Mexico.Crossref | GoogleScholarGoogle Scholar |
Cawson JG, Sheridan G, Smith HG, Lane PNJ (2011) The effect of prescribed fire severity and burn patchiness on runoff and erosion. In ‘Proceedings of Bushfire CRC & AFAC 2011 Conference Science Day’, 1 September 2011, Sydney, NSW. (Ed. RP Thornton) pp. 105–119. (Bushfire CRC: Melbourne)
Cawson JG, Sheridan GJ, Smith HG, Lane PNJ (2012) Surface runoff and erosion after prescribed burning and the effect of different fire regimes in forests and shrublands: a review. International Journal of Wildland Fire 21, 857–872.
| Surface runoff and erosion after prescribed burning and the effect of different fire regimes in forests and shrublands: a review.Crossref | GoogleScholarGoogle Scholar |
Cerdá A, Doerr SH (2005) Influence of vegetation recovery on soil hydrology and erodibility following fire: an 11-year investigation. International Journal of Wildland Fire 14, 423–437.
| Influence of vegetation recovery on soil hydrology and erodibility following fire: an 11-year investigation.Crossref | GoogleScholarGoogle Scholar |
Cerdá A, Doerr SH (2010) The effect of ant mounds on overland flow and soil erodibility following a wildfire in eastern Spain. Ecohydrology 3, 392–401.
| The effect of ant mounds on overland flow and soil erodibility following a wildfire in eastern Spain.Crossref | GoogleScholarGoogle Scholar |
Cerdá A, Robichaud PR (Eds) (2009) ‘Fire Effects on Soils and Restoration Strategies.’ (Science Publishers: Enfield, NH)
Certini G (2005) Effects of fire on properties of forest soils: a review. Oecologia 143, 1–10.
| Effects of fire on properties of forest soils: a review.Crossref | GoogleScholarGoogle Scholar | 15688212PubMed |
Chafer CJ, Noonan M, Macnaught E (2004) The post-fire measurement of fire severity and intensity in the Christmas 2001 Sydney wildfires. International Journal of Wildland Fire 13, 227–240.
| The post-fire measurement of fire severity and intensity in the Christmas 2001 Sydney wildfires.Crossref | GoogleScholarGoogle Scholar |
Chatterjee S, Hadi AS, Price B (2000) ‘Regression Analysis by Example.’ (Wiley: New York)
Coelho C, Ferreira A, Boulet A-K, Keizer J (2004) Overland flow generation processes, erosion yields and solute loss following different intensity fires. Quarterly Journal of Engineering Geology and Hydrogeology 37, 233–240.
| Overland flow generation processes, erosion yields and solute loss following different intensity fires.Crossref | GoogleScholarGoogle Scholar |
Country Fire Service (2000) ‘CFS Map Book Mt Lofty Ranges South Australia Part 1, 2, 3, Edition 1.’ (Government of South Australia: Adelaide)
Daily B, Firman JB, Forbes BG, Lindsay JM (1976) Geology. In ‘Natural History of the Adelaide Region’. (Eds CR Twidale, MJ Tyler, BP Webb) pp. 5–42. (Royal Society of South Australia Inc.: Adelaide)
DEH (2009) Fire Management Plan, Reserves of the Hills Face Zone, Mount Lofty Ranges, 2009–2019. (Government of South Australia, Department for Environment and Heritage: Adelaide)
Dragovich D, Morris R (2002a) Fire intensity, slopewash and bio-transfer of sediment in eucalypt forest, Australia. Earth Surface Processes and Landforms 27, 1309–1319.
| Fire intensity, slopewash and bio-transfer of sediment in eucalypt forest, Australia.Crossref | GoogleScholarGoogle Scholar |
Dragovich D, Morris R (2002b) Fire intensity, run-off and sediment movement in eucalypt forest near Sydney, Australia. In ‘Applied Geomorphology: Theory and Practice’. (Ed. RJ Allison) pp. 145–162. (Wiley: Chichester, UK)
GSAA (1962) ‘Barker 1 : 250 000 Mapsheet. S.A. Geological Atlas Sheet 1 54–13 Zones 5 & 6.’ (Geological Survey of South Australia: Adelaide)
Gyasi-Agyei Y (2006) Erosion risk assessment of controlled burning of grasses established on steep slopes. Journal of Hydrology 317, 276–290.
| Erosion risk assessment of controlled burning of grasses established on steep slopes.Crossref | GoogleScholarGoogle Scholar |
Healey FG, Jarrett FG, McKay JM (1985) ‘The Economics of Bushfires: the South Australian Experience.’ (Oxford Press: Melbourne)
Inbar M, Tamir M, Wittenberg L (1998) Runoff and erosion processes after a forest fire in Mount Carmel, a Mediterranean area. Geomorphology 24, 17–33.
| Runoff and erosion processes after a forest fire in Mount Carmel, a Mediterranean area.Crossref | GoogleScholarGoogle Scholar |
Kinoshita AM, Hogue TS (2011) Spatial and temporal controls on post-fire hydrologic recovery in Southern California watersheds. Catena 87, 240–252.
| Spatial and temporal controls on post-fire hydrologic recovery in Southern California watersheds.Crossref | GoogleScholarGoogle Scholar |
Kirkby MJ, Bracken LJ, Shannon J (2005) The influence of rainfall distribution and morphological factors on runoff delivery from dryland catchments in SE Spain. Catena 62, 136–156.
| The influence of rainfall distribution and morphological factors on runoff delivery from dryland catchments in SE Spain.Crossref | GoogleScholarGoogle Scholar |
Middelmann MH (2007) ‘Natural Hazards in Australia: Identifying Risk Analysis Requirements.’ (Geoscience Australia: Canberra)
Moffet CA, Pierson FB, Robichaud PR, Spaeth KE, Hardegree SP (2007) Modeling soil erosion on steep sagebrush rangeland before and after prescribed fire. Catena 71, 218–228.
| Modeling soil erosion on steep sagebrush rangeland before and after prescribed fire.Crossref | GoogleScholarGoogle Scholar |
Moody JA, Martin DA (2001a) Initial hydrologic and geomorphic response following a wildfire in the Colorado Front Range. Earth Surface Processes and Landforms 26, 1049–1070.
| Initial hydrologic and geomorphic response following a wildfire in the Colorado Front Range.Crossref | GoogleScholarGoogle Scholar |
Moody JA, Martin DA (2001b) Post-fire, rainfall intensity-peak discharge relations for three mountainous watersheds in the western USA. Hydrological Processes 15, 2981–2993.
| Post-fire, rainfall intensity-peak discharge relations for three mountainous watersheds in the western USA.Crossref | GoogleScholarGoogle Scholar |
Moody JA, Martin DA, Haire SL, Kinner DA (2008) Linking runoff response to burn severity after a wildfire. Hydrological Processes 22, 2063–2074.
| Linking runoff response to burn severity after a wildfire.Crossref | GoogleScholarGoogle Scholar |
Morris R, Buckman S, Connelly P, Dragovich D, Ostendorf B, Bradstock R (2011) The dirt on assessing post-fire erosion in the Mount Lofty Ranges: comparing methods. In ‘Proceedings of Bushfire CRC & AFAC 2011 Conference Science Day’, 1 September 2011, Sydney, NSW. (Ed. RP Thornton) pp. 152–169. (Bushfire CRC: Melbourne)
Morris R, Dragovich D, Ostendorf B (2012) Hillslope erosion and post-fire sediment trapping at Mount Bold, South Australia. In ‘Wildfire and Water Quality: Processes, Impacts and Challenges’, 11–14 June 2012, Banff, AB, Canada (Eds M Stone, A Collins, T Martin) IAHS Publication vol. 354, 42–50. (IAHS Publication: Oxfordshire).
Nyman P, Sheridan GJ, Smith HG, Lane PNJ (2011) Evidence of debris flow occurrence after wildfire in upland catchments of south-east Australia. Geomorphology 125, 383–401.
| Evidence of debris flow occurrence after wildfire in upland catchments of south-east Australia.Crossref | GoogleScholarGoogle Scholar |
Prosser IP, Williams L (1998) The effect of wildfire on runoff and erosion in native Eucalyptus forest. Hydrological Processes 12, 251–265.
| The effect of wildfire on runoff and erosion in native Eucalyptus forest.Crossref | GoogleScholarGoogle Scholar |
Richards PJ, Humphreys GS, Tomkins KM, Shakesby RA, Doerr SH (2011) Bioturbation on wildfire-affected southeast Australian hillslopes: spatial and temporal variation. Catena 87, 20–30.
| Bioturbation on wildfire-affected southeast Australian hillslopes: spatial and temporal variation.Crossref | GoogleScholarGoogle Scholar |
Robichaud PR, Ashmun LE (2013) Tools to aid post-wildfire assessment and erosion-mitigation treatment decisions. International Journal of Wildland Fire 22, 95–105.
| Tools to aid post-wildfire assessment and erosion-mitigation treatment decisions.Crossref | GoogleScholarGoogle Scholar | [Published online early print 2 August 2012]
Robichaud PR, Waldrop TA (1994) A comparison of surface runoff and sediment yields from low-severity and high-severity site preparation burns. Water Resources Bulletin 30, 27–34.
| A comparison of surface runoff and sediment yields from low-severity and high-severity site preparation burns.Crossref | GoogleScholarGoogle Scholar |
Robin X, Turck N, Hainard A, Tiberti N, Lisacek F, Sanchez JC, Müller M (2011) pROC: an open-source package for R and S+ to analyze and compare ROC curves. BMC Bioinformatics 12, 77
| pROC: an open-source package for R and S+ to analyze and compare ROC curves.Crossref | GoogleScholarGoogle Scholar | 21414208PubMed |
Shakesby RA (2011) Post-wildfire soil erosion in the Mediterranean: review and future research directions. Earth-Science Reviews 105, 71–100.
| Post-wildfire soil erosion in the Mediterranean: review and future research directions.Crossref | GoogleScholarGoogle Scholar |
Shakesby RA, Doerr SH (2006) Wildfire as a hydrological and geomorphological agent. Earth-Science Reviews 74, 269–307.
| Wildfire as a hydrological and geomorphological agent.Crossref | GoogleScholarGoogle Scholar |
Shakesby RA, Blake WH, Doerr SH, Humphreys GS, Wallbrink PJ, Chafer CJ (2006) Hillslope soil erosion and bioturbation after the Christmas 2001 Forest Fires near Sydney, Australia. In ‘Soil Erosion and Sediment Redistribution in River Catchments: Measurement, Modelling and Management in the 21st Century’. (Eds PN Owens, AJ Collins) pp. 51–61. (CAB International: Wallingford, UK)
Shakesby RA, Wallbrink PJ, Doerr SH, English PM, Chafer CJ, Humphreys GS, Blake WH, Tomkins KM (2007) Distinctiveness of wildfire effects on soil erosion in south-east Australian eucalypt forests assessed in a global context. Forest Ecology and Management 238, 347–364.
| Distinctiveness of wildfire effects on soil erosion in south-east Australian eucalypt forests assessed in a global context.Crossref | GoogleScholarGoogle Scholar |
Smith HG, Dragovich D (2008) Post-fire hillslope erosion response in a sub-alpine environment, south-eastern Australia. Catena 73, 274–285.
| Post-fire hillslope erosion response in a sub-alpine environment, south-eastern Australia.Crossref | GoogleScholarGoogle Scholar |
Smith HG, Sheridan GJ, Lane PNJ, Nyman P, Haydon S (2011) Wildfire effects on water quality in forest catchments: a review with implications for water supply. Journal of Hydrology 396, 170–192.
| Wildfire effects on water quality in forest catchments: a review with implications for water supply.Crossref | GoogleScholarGoogle Scholar | 1:CAS:528:DC%2BC3cXhsF2htbnK&md5=5303a6a88a0f64f5c0c461f9b1737808CAS |
Soil and Land Program (2007) Land and soil spatial data for southern South Australia – GIS format. (CD-ROM) (Government of South Australia, Department of Water, Land and Biodiversity Conservation: Adelaide)
Thuiller W, Araujo MB, Lavorel S (2003) Generalized models vs. classification tree analysis: predicting spatial distributions of plant species at different scales. Journal of Vegetation Science 14, 669–680.
| Generalized models vs. classification tree analysis: predicting spatial distributions of plant species at different scales.Crossref | GoogleScholarGoogle Scholar |
White I, Wade A, Worthy M, Mueller N, Trevor D, Wasson R (2006) The vulnerability of water supply catchments to bushfires: impacts of the January 2003 wildfires on the Australian Capital Territory. Australian Journal of Water Resources 10, 170–193.
Wilkinson S, Jansen A, Watts R, Read A, Davey B (2005) Techniques for targeting erosion control and riparian rehabilitation in the Mount Lofty Ranges. CSIRO Land and Water Client Report. (Canberra, ACT)
Wood SN (2006) ‘Generalized Additive Models: An Introduction with R.’ (Chapman and Hall/CRC: Boca Raton, FL)
Wright HA, Churchill FM, Stevens WC (1976) Effect of prescribed burning on sediment, water yield, and water quality from juniper lands in central Texas. Journal of Range Management 29, 294–298.
| Effect of prescribed burning on sediment, water yield, and water quality from juniper lands in central Texas.Crossref | GoogleScholarGoogle Scholar |
Zuur AF, Ieno EN, Walker NJ, Saveliev AA, Smith GM (2009) ‘Mixed Effects Models and Extensions in Ecology with R.’ (Springer: New York)