

Differences in land ownership, fire management objectives and source data matter: a reply to Hanson and Odion (2014)
Hugh D. Safford A B F , Jay D. Miller C and Brandon M. Collins D EA USDA Forest Service, Pacific Southwest Region, Vallejo, CA 94592, USA.
B Department of Environmental Science and Policy, University of California, Davis, CA 95616, USA.
C USDA Forest Service, Pacific Southwest Region, Fire and Aviation Management, McClellan, CA 95652, USA.
D USDA Forest Service, Pacific Southwest Research Station, Davis, CA 95618, USA.
E Center for Fire Research and Outreach, College of Natural Resources, University of California, Berkeley, CA 94720, USA.
F Corresponding author. Email: hughsafford@fs.fed.us
International Journal of Wildland Fire 24(2) 286-293 https://doi.org/10.1071/WF14013
Submitted: 14 November 2013 Accepted: 21 August 2014 Published: 10 March 2015
Abstract
We respond to Hanson and Odion (2014), who claim in this journal (vol. 23, no. 1, pp. 1–8) that their reanalysis of fire severity patterns in and around the Sierra Nevada refutes earlier work showing increases in fire severity in certain forest types over the last 3 decades. Hanson and Odion base their reanalysis on a highly inaccurate, very coarse-scale, and geographically misregistered vegetation map. Also, in contrast to the previous work, which was restricted to wildfires on Forest Service lands in forest types differentiated by their fire regimes, Hanson and Odion combine all types of fires on lands of all jurisdictions and stratify by very broad, unorthodox vegetation types that conjoin very different fire regimes. As such, their work does not constitute a test of the previous work. We present analyses that demonstrate sources of error associated with Hanson and Odion’s data and the analyses they perform, and explore how that error might confound their results. Fundamental and compounded problems in Hanson and Odion (2014) cast strong doubt on their conclusions.
Introduction
Hanson and Odion (2014; hereafter ‘H&O’) claim to have refuted two earlier studies (Miller et al. 2009a; Miller and Safford 2012) that showed statistically significant increases in fire severity in certain forest types on Forest Service (FS)-managed lands in the Sierra Nevada Forest Plan Amendment (SNFPA) area. However, there are myriad methodological issues with H&O that introduce compounding errors into both their results and interpretations (Table 1). As background for our analyses, we use the Introduction to draw attention to three of the most serious methodological problems in H&O’s study: (1) choice of study area, (2) choice of vegetation data, and (3) statistical analyses performed.

|
Study area
H&O do not reanalyse the fire severity data of Miller and colleagues, but rather analyse a different dataset from an expanded study area that includes more fires and different jurisdictions. The expanded study area (referred to as the ‘SNEP’ area, from the Sierra Nevada Ecosystem Project (CWWR 1996)), includes private lands and National Park Service (NPS) lands, in addition to FS lands. By including these different ownerships, the authors combine areas supporting very different fire and forest management practices. Furthermore, by using all fires mapped by the Monitoring Trends in Burn Severity (MTBS) project, they include prescribed fires.
Most fires on NPS lands in the SNEP area are managed very differently than on most FS lands. The National Parks for many decades have allowed lightning-ignited fires to burn under specified conditions to meet resource-management objectives. Although some National Forests allow ‘resource benefit’ fires in more remote, higher-elevation areas, the Parks have a longer history of wildland fire use on much more of their landbase (van Wagtendonk 2007). As a result, the proportion of high severity in wildland fires has been lower in the Parks relative to the National Forests (Miller et al. 2012).
Private lands pose yet another challenge for analysing fire severity in California. These lands are typically salvage-harvested within a month or two of fire containment (Zhang et al. 2008), which creates a dilemma because the MTBS data are derived from post-fire satellite images acquired the year after the fire (so-called ‘extended assessments’; Eidenshink et al. 2007). Such data are severely compromised when trees have been harvested between fire containment and the post-fire image. If the proportion of area burned on private lands was greater in the early portion of the time series, then any trend of increasing severity or area burned at high severity on FS lands could have been masked by combining private and FS lands in the same trend analysis. In a recent study of fire severity in the Sierra Nevada, Mallek et al. (2013) included private portions of some fires that also burned FS lands using fire severity data estimated primarily from immediate post-fire images so as to avoid salvage logging ‘pollution’ of the data. Using Bayesian regression techniques, they found there was a >99 and 96% probability of an increasing trend in proportion of area burned at high severity in dry and moist mixed-conifer forests, respectively, and 82–99% probability of increasing area burned at high severity in all conifer forests.
Vegetation data
H&O claim that the vegetation data used by Miller et al. (2009a) and Miller and Safford (2012) lead to an underestimation of high-severity fire early in the time series. H&O base this claim on significant negative coefficients from a Mann–Kendall comparison of their fire severity data stratified by forest type as delineated by ‘prefire’ vegetation data (hereafter ‘CALVEG77’), versus vegetation data used by Miller et al. (2009a) and Miller and Safford (2012), who used a more recent version of CALVEG and Landfire Biophysical Settings (BpS) respectively. Because there was a negative association between their data stratified by CALVEG77 and the other two vegetation datasets, H&O proclaim that the more recent versions of CALVEG and Landfire BpS underrepresent the high-severity area mapped as conifer forest in the early dataset. This claim, however, is confounded by both the effects of salvage-harvesting on remotely sensed fire severity estimates and the inaccuracy in H&O’s base vegetation map (CALVEG77).
H&O provide no details concerning CALVEG77 or its provenance, other than to report partial results of an unorthodox accuracy assessment. However, as H&O’s basic premise is that CALVEG77 is a more accurate representation of prefire forest conditions than vegetation maps used by Miller and colleagues, readers should be provided with sufficient information to determine if that is indeed the case. CALVEG77 polygons were hand-delineated on hard-copy prints of 1977–79 Landsat Multi-spectral Scanner (MSS) images (Matyas and Parker 1980). The metadata indicate a scale of 1 : 250 000, but CALVEG77 did not utilise the full resolution of the MSS 69-m pixels. Instead, polygons were drawn with a 160–640-ha minimum mapping unit, resulting in an actual scale coarser than 1 : 1 270 000 (Goodchild et al. 1991; Goodchild 1993); the average size of vegetation polygons in the CALVEG77 map is over 15 000 ha (Keeler-Wolf 2007). In addition, the source Landsat data used to delineate polygons in CALVEG77 were misregistered by over 1 km in some locations (see Fig. S1 available as Supplementary Material to this paper). Presumably, H&O did not correct the misregistration of CALVEG77 polygons as they did not specifically indicate they did so. An independent accuracy analysis of CALVEG77 using forest inventory and analysis (FIA) data from the 1980s found that statewide commission and omission errors for the seven CALVEG forest types analysed by H&O averaged a very poor 72 and 66% respectively (Goodchild et al. 1991); shrub and herbaceous plots were mapped 2.8 times more often as conifer than as shrub or herb by CALVEG77. Goodchild et al. indicated that the poor accuracy was a result of the coarse scale and mislabelling of polygons. This notwithstanding, using FIA data postdating the CALVEG77 map by several decades, H&O report 85–88% ‘accuracy’ for their conifer polygons, which suggests that they only carried out an evaluation of producer’s accuracy (i.e. 1 – omission error). It is well known that omission errors are reduced by homogenising the analysis area (e.g. by using very-coarse-scale data or aggregating classes, as H&O did by reducing the CALVEG types to three forest classes), but commission errors inevitably increase (Smith et al. 2002). Reporting only omission errors and ignoring errors of commission is incomplete and potentially misleading. For example, using FIA data from the 1980s (in Goodchild et al. 1991), we found a commission error of 63% (user’s accuracy = 37%) for H&O’s ‘western lower montane’ group.
Note that, in contrast to CALVEG77, the more modern CALVEG product used by Miller et al. (2009a), which is based on a merging between the 30-m Landsat images and higher-resolution images (such as India Remote Sensing (IRS) satellite or Satellite Pour l’Observation de la Terre (SPOT)), is much more accurate: for the 2009-vintage CALVEG, the overall commission error for the study area was ~26% (37% when weighted by the number of FIA plots in the different map tiles), the omission error was ~25% (39% weighted) (confusion matrices from 2009 and earlier found at: http://www.fs.fed.us/r5/rsl/projects/AAbu/, verified 1 January 2014). The scale of these maps is also 100 000 or finer, which matches the published scale of the fire severity data.
In addition, H&O incorrectly claim that the more recent CALVEG data used by Miller et al. (2009a) and Landfire BpS data used by Miller and Safford (2012) represent post-fire conditions in the early years of the time series. With regard to Miller et al. (2009a), the mapping methodology used to produce CALVEG since the early 1990s does not strictly follow an existing vegetation mapping methodology. The CALVEG maps are used by the FS to comply with the National Forest Management Act of 1976, which requires the FS to track all potential productive forest lands. As a consequence, any areas capable of producing productive forests are retained in the map. When stand-replacing events occur in productive forested areas, tree density is set to zero and size to non-stocked, but the primary vegetation type is not changed from a forest type. Miller and Safford (2012) used Landfire BpS, which is a potential vegetation map and therefore does not reflect any particular post-fire condition (Rollins 2009).
Statistical analysis
H&O assert that there are no trends in percentage of area burned at high severity or annual area burned at high severity because they did not find a statistically significant correlation between year and severity using the Mann–Kendall rank correlation test. However, rank correlation has very low statistical power in small datasets, increasing chances of making a Type II error (Yue et al. 2002), and correlations in general are mainly investigative tools and not well appointed for rigorously testing hypotheses (Altman 1980; Sokal and Rohlf 1995). Textbooks that describe statistical methods for monitoring natural resources emphasise that failing to reject the null hypothesis when using Mann–Kendall does not constitute proof that a trend does not exist. Instead, it is usually a statement that the available data are not sufficient to discern a trend (Helsel and Hirsch 2002; Dickson et al. 2005). Yue et al. (2002) found the power of the Mann–Kendall test increases with increasing sample size. Power was lowest for normally and log-normally distributed data, which are typical distributions for percentage and area of high-severity fire.
The potential bias introduced by using inaccurate vegetation maps and the inferior statistical methods employed are not the only problems with the H&O analysis. There are additional potential sources of error (see Table 1), which interact and ultimately make discrete identification of a single central problem impossible. As a result, we see no value in performing a re-analysis of their data. Rather, we devote our analysis to an investigation of the likelihood that H&O biased their analyses by including prescribed fires, and fires that occurred on private lands mapped with satellite data acquired after salvage logging occurred. Specifically, we ask: (1) whether the amount of high-severity fire was different on private lands v. FS lands and, if so, if this difference was dependent on whether the fires were mapped with extended assessments or with immediate post-fire images that do not reflect salvaging logging; and (2) whether area burned in prescribed fires or in different ownerships was uniformly distributed throughout the time series.
Methods
Vegetation data
In our analyses, we use the same CALVEG77 data as H&O, but only to permit investigation of H&O’s methods. We restrict our analyses to fires that occurred within forested types: big tree (giant sequoia), Jeffrey pine, lodgepole pine, mixed conifer–fir, mixed conifer–pine, mountain hemlock, ponderosa pine, red fir and white fir.
Fire and severity data
The FS’s Pacific Southwest Region maintains a database of fire severity data for most large wildfires since 1984 that have occurred at least partially on FS lands in California (http://www.fs.usda.gov/detail/r5/landmanagement/gis/?cid=STELPRDB5327833, verified 1 December 2013). Our database does not include fires that occur exclusively on private lands as we are not responsible for their management. A majority of the data used to produce our severity database were obtained from MTBS and the Rapid Assessment of VeGetation condition (RAVG) project, which maps fires using immediate post-fire satellite images (so-called ‘initial assessments’; http://www.fs.fed.us/postfirevegcondition/index.shtml). Therefore, unlike the MTBS database, our database includes assessments for some fires derived from post-fire images that do not reflect effects from salvage logging. Our database also contains many 80–400-ha wildfires that MTBS or RAVG did not map. For this manuscript, we use our fire severity data for fires that occurred on FS and private lands within the SNEP area 1984–2010. As in the Miller and colleagues studies, we used data calibrated to the Composite Burn Index, where the high-severity category is equivalent to ~95% change in canopy cover (Key and Benson 2006; Miller et al. 2009b). We also used perimeters mapped by MTBS for all fires (wildfires and prescribed fires) that occurred in the SNEP area between 1984 and 2010. We corrected two fires that MTBS mapped in the wrong years (1985 Briceburg and 1999 Lake), and we reattributed three fires as fire-use fires (commonly known as Wildland Fire Use (WFU), where naturally ignited fires are allowed to burn under management rather than being immediately suppressed) that MTBS had misidentified as prescribed fires (1987 Campbell, 2006 Frog and 2010 Sheep).
Ownership data
We stratified severity data by ownership with FS ownership data for fires that occurred within National Forest boundaries. For areas outside National Forests, we used data from the California Department of Forestry and Fire Protection and Resource Assessment Program (http://frap.fire.ca.gov/index.php).
Analyses
Severity in initial and extended assessments
To determine whether extended assessments overestimate severity on private lands, we ran four paired t-tests. We compared percentage high severity on private lands v. FS lands (one t-test using extended and the other initial assessments), and initial v. extended assessments on private lands or FS alone. We only included fires that occurred on both private and public lands. We did not analyse fires that had less than 10 ha on either jurisdiction to minimise errors due to misalignment of the ownership and/or severity data. Percentage data were arcsin-square root-transformed to meet normality assumptions (all Kolmogorov–Smirnov tests P > 0.06).
Area burned by fire type and ownership
We stratified the perimeters of fires mapped by MTBS (www.mtbs.gov, accessed 23 October 2013) by year, ownership (FS, NPS, private), fire type (prescribed, wildfire, WFU), and forest type as mapped with CALVEG77. Dividing the period roughly in half (1984–1997 and 1998–2010), we performed two-sample t-tests to determine whether more area was burned in wildfires and WFU fires in the second half of the study period. Area data were first square root-transformed to meet normality assumptions (all Kolmogorov–Smirnov tests P > 0.15).
Results
Severity on private lands
The proportion of high-severity fire in extended assessments was significantly higher on private lands than FS lands, but not in initial assessments (Table 2). On private lands, severity in initial assessments was significantly lower than extended assessments. There was no difference between assessments on FS lands.
|
Area burned by ownership and fire type
FS, private and NPS lands accounted for the largest amount of area burned in wildfires, WFU fires and prescribed fires (Table 3). Although prescribed fires account for a small portion of the area burned, there were 2 years late in the time series (2005 and 2006) when the area burned in prescribed fires was substantial (41 and 34% respectively; Fig. 1).

|
|
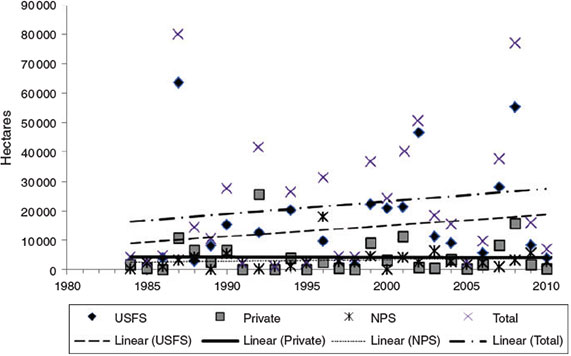
Area burned in wildfires and WFU fires on private and NPS lands was relatively constant over the 1984–2010 period, but average annual area burned increased on USFS lands, although not significantly at α = 0.05 (Fig. 2). Dividing the 1984–2010 period in half, the area burned on USFS lands in the second half of the period is significantly higher (P = 0.045, Table 4). The area burned on private and NPS lands was unchanged between periods. When the three jurisdictions were combined, the difference in total area burned between the first and second halves of the period was not significant.
|
|
Discussion
Our results demonstrate some of the possible sources of error associated with H&O’s analyses (plus see Table 1). At least two other issues worth discussing could either have contributed to H&O not identifying trends or confuse the interpretation of the actual effects described by the high-severity data.
First, H&O combine forest types into three unorthodox regional groupings that conjoin very different presettlement fire regime characteristics. One example is the combination of mixed conifer–fir with red fir in their ‘western mid-upper montane’ group. The boundary between high-elevation mixed conifer and red fir is a very important ecotone in the Sierra Nevada, as it coincides with the approximate elevation of freezing in mid-winter storms and the elevation of the deepest winter snowpack. Multiple authors have brought attention to major ecological changes that accompany the transition from mixed conifer to red fir, and these include fire regime (Kilgore 1971; Barbour et al. 2002, 2007; Sugihara et al. 2006; Safford and Van de Water 2013). Mixed conifer–fir supported presettlement fire return intervals (FRIs) that were much more similar to mixed conifer–pine forests than to red fir (mean FRIs of 11, 16, and 40 years for mixed conifer–pine, mixed conifer–fir and red fir respectively; Van de Water and Safford 2011). Under the national fire regime classification (Schmidt et al. 2002), Sierra Nevada mixed-conifer types are placed in Fire Regime I (0–35-year FRI, fires mostly low severity), whereas red fir is in Fire Regime III (35–100-year FRI, fires mostly mixed-severity). Studies have also found very different modern trends in fire activity and severity between mixed-conifer and red fir forests (Miller et al. 2009a, 2012; Miller and Safford 2012; Mallek et al. 2013). In general, mixed-conifer forests are burning at much higher severities today than under pre-Euroamerican conditions, whereas higher-elevation forests like red fir have missed fewer fires and have less departed from presettlement conditions (Mallek et al. 2013; Safford and Van de Water 2013). A further example of ill-advised vegetation grouping is H&O’s ‘eastern montane’ group, which is a composite of different forest types and fire regimes, with presettlement FRI ranges that span from 5–30 (yellow pine) to 15–290 years (lodgepole pine) (Van de Water and Safford 2011). With such heterogeneous and coarsely defined vegetation types, it is not surprising that H&O found no trend.
Second is H&O’s assertion that their high-severity category is equivalent to ‘~70% mortality of the prefire tree basal area’. H&O use the same Relative differenced Normalised Burn Ratio (RdNBR) value of 641 as the high-severity threshold as did Miller et al. (2009a) and Miller and Safford (2012) for extended assessments. Initial assessment thresholds are different owing to changes in ash cover over time (J. D. Miller, H. D. Safford, K. Welch and B. Quayle, unpubl. data). However, Miller and colleagues’ high-severity threshold is equivalent to a Composite Burn Index (CBI) value of 2.25, ~95% change in canopy or 89% change in basal area (BA) based on regression analyses (Miller and Thode 2007; Miller et al. 2009b). H&O cite Hanson et al. (2010) as a basis for equating RdNBR 641 to 70% BA mortality. However, nowhere in Hanson et al. (2010) are any methods or results presented that demonstrate that relationship. Rather, Hanson et al. (2010) is a response paper to a rebuttal of Hanson et al. (2009) where they claim that an RdNBR value of 800 equates to 75% BA mortality. Using field data we collected and used in Miller et al. (2009b), Hanson et al. (2009) swap dependent and independent variables, and then use the dependent variable as a threshold. But the purpose for collecting field data is to calibrate the satellite index, not vice versa. For example, plots with ≥75% BA mortality result in a mean RdNBR value of 802 (Table 5). Hanson et al. (2009) then use an RdNBR value of 800 as a threshold in their classification of ‘high’ severity, but an RdNBR value of ≥800 relates to a mean BA mortality of 94%. As they do not actually provide any methods, we don’t know how H&O arrive at their conclusion that an RdNBR value of 641 relates to 70% BA mortality, but it is inconsistent with earlier papers.
|
H&O overestimate the amount of area burned at high severity on private lands by using MTBS extended assessments (Table 2). As the percentage of area burned on private lands in comparison with FS lands is greater at the beginning of the time period (Fig. 2), it is likely that H&O overestimate severity early in the time series. Compounding the likely overestimation early in the time series, H&O also likely underestimate severity late in the time series by including prescribed fires (Fig. 1). Merely combining private and NPS lands with FS lands could mask a significant trend (e.g. Table 4). Coupled with the use of statistical techniques with low predictive power, their highly inaccurate and very coarse-scale vegetation data, and aggregating vegetation types into groupings that include highly disparate historical fire regimes contribute to considerable uncertainty in the conclusions they draw. Given the high number of error sources (Table 1), it is impossible to say which issue contributed most to the inability of H&O to identify any trends.
References
Altman DG (1980) Statistics and ethics in medical research. V – Analyzing data. British Medical Journal 281, 1473–1475.| Statistics and ethics in medical research. V – Analyzing data.Crossref | GoogleScholarGoogle Scholar | 1:STN:280:DyaL3M%2Fmtl2iuw%3D%3D&md5=9d49520f0c2283a2b123da4a32a67b5eCAS | 7437841PubMed |
Barbour M, Kelley E, Maloney P, Rizzo D, Royce E, Fites-Kaufmann J (2002) Present and past old-growth forests of the Lake Tahoe Basin, Sierra Nevada, US. Journal of Vegetation Science 13, 461–472.
| Present and past old-growth forests of the Lake Tahoe Basin, Sierra Nevada, US.Crossref | GoogleScholarGoogle Scholar |
Barbour MG, Keeler-Wolf T, Schoenherr AA (2007) (Eds) ‘Terrestrial Vegetation of California’, 3rd edn. (University of California Press: Berkeley, CA)
CWWR (1996) Status of the Sierra Nevada. Summary of the Sierra Nevada Ecosystem Project report. (Center for Water and Wildland Resources, University of California: Davis, CA)
Dickson WZ, Wiedemeier TH, Haas PE, Barden MJ (2005) Designing monitoring programs to effectively evaluate the performance of natural attenuation. In ‘Practical Handbook of Environmental Site Characterization and Ground-Water Monitoring’. (Ed. DM Nielsen) Ch. 9, pp. 573–638. (CRC Press, Taylor and Francis Group: Boca Raton, FL)
Eidenshink J, Schwind B, Brewer K, Zhu Z-L, Quayle B, Howard S (2007) A project for monitoring trends in burn severity. Fire Ecology 3, 3–21.
| A project for monitoring trends in burn severity.Crossref | GoogleScholarGoogle Scholar |
Goodchild MF (1993) Data models and data quality: problems and prospects. In ‘Environmental Modeling with GIS’. (Eds MF Goodchild, BO Parks and LT Steyaert) pp. 94–104. (Oxford University Press: New York)
Goodchild MF, Davis FW, Painho M, Storns DM (1991) ‘The Use of Vegetation Maps and Geographic Systems for Assessing Conifer Lands in California.’ (National Center for Geographic Information and Analysis, UC Santa Barbara, 91–23:Santa Barbara, CA)
Hanson CT, Odion DC (2014) Is fire severity increasing in the Sierra Nevada, California, USA? International Journal of Wildland Fire 23, 1–8.
| Is fire severity increasing in the Sierra Nevada, California, USA?Crossref | GoogleScholarGoogle Scholar |
Hanson CT, Odion DC, Dellasala DA, Baker WL (2009) Overestimation of fire risk in the Northern Spotted Owl Recovery Plan. Conservation Biology 23, 1314–1319.
| Overestimation of fire risk in the Northern Spotted Owl Recovery Plan.Crossref | GoogleScholarGoogle Scholar | 19549218PubMed |
Hanson CT, Odion DC, Dellasala DA, Baker WL (2010) More-comprehensive recovery actions for northern spotted owls in dry forests: reply to Spies et al. Conservation Biology 24, 334–337.
| More-comprehensive recovery actions for northern spotted owls in dry forests: reply to Spies et al.Crossref | GoogleScholarGoogle Scholar |
Helsel DR, Hirsch RM (2002) ‘Statistical Methods in Water Resources: Techniques of Water Resources Investigations’ (US Geological Survey) Available at http://pubs.usgs.gov/twri/twri4a3/ [Verified 3 October 2014]
Keeler-Wolf T (2007) The history of vegetation classification and mapping in California. In ‘Terrestrial Vegetation of California’. (Eds MG Barbour, T Keller-Wolf and AA Schoenherr) pp. 1–42. (University of California Press: Berkeley, CA)
Key CH, Benson NC (2006) Landscape assessment: ground measure of severity, the Composite Burn Index. In ‘FIREMON: Fire Effects Monitoring and Inventory System’. (Ed. DC Lutes) pp. LA8–LA15. (USDA Forest Service, Rocky Mountain Research Station: Fort Collins, CO)
Kilgore BM (1971) The role of fire in managing red fir forests. In ‘Transactions North American Wildlife and Natural Resources Conference, 7–10 March 1971, Portland, OR. (Ed. JB Trefethen) Wildlife Management Institute, Washington, DC, pp. 405–416.
Mallek C, Safford HD, Viers JH, Miller JD (2013) Modern departures in fire severity and area vary by forest type, Sierra Nevada and southern Cascade Range, California, USA. Ecosphere 4, art153
| Modern departures in fire severity and area vary by forest type, Sierra Nevada and southern Cascade Range, California, USA.Crossref | GoogleScholarGoogle Scholar |
Matyas WJ, Parker I (1980) ‘CALVEG mosaic of existing vegetation in California.’ (Regional Ecology Group, USDA Forest Service, Pacific Southwest Region: San Francisco, CA).
Miller JD, Safford HD (2012) Trends in wildfire severity 1984–2010 in the Sierra Nevada, Modoc Plateau, and southern Cascades, California, USA. Fire Ecology 8, 41–57.
| Trends in wildfire severity 1984–2010 in the Sierra Nevada, Modoc Plateau, and southern Cascades, California, USA.Crossref | GoogleScholarGoogle Scholar |
Miller JD, Thode AE (2007) Quantifying burn severity in a heterogeneous landscape with a relative version of the delta Normalized Burn Ratio (dNBR). Remote Sensing of Environment 109, 66–80.
| Quantifying burn severity in a heterogeneous landscape with a relative version of the delta Normalized Burn Ratio (dNBR).Crossref | GoogleScholarGoogle Scholar |
Miller JD, Safford HD, Crimmins MA, Thode AE (2009a) Quantitative evidence for increasing forest fire severity in the Sierra Nevada and southern Cascade Mountains, California and Nevada, USA. Ecosystems 12, 16–32.
| Quantitative evidence for increasing forest fire severity in the Sierra Nevada and southern Cascade Mountains, California and Nevada, USA.Crossref | GoogleScholarGoogle Scholar |
Miller JD, Knapp EE, Key CH, Skinner CN, Isbell CJ, Creasy RM, Sherlock JW (2009b) Calibration and validation of the relative differenced Normalized Burn Ratio (RdNBR) to three measures of fire severity in the Sierra Nevada and Klamath Mountains, California, USA. Remote Sensing of Environment 113, 645–656.
| Calibration and validation of the relative differenced Normalized Burn Ratio (RdNBR) to three measures of fire severity in the Sierra Nevada and Klamath Mountains, California, USA.Crossref | GoogleScholarGoogle Scholar |
Miller JD, Collins BM, Lutz JA, Stephens SL, van Wagtendonk JW, Yasuda DA (2012) Differences in wildfires among ecoregions and land management agencies in the Sierra Nevada region, California, USA. Ecosphere 3, Article 80
| Differences in wildfires among ecoregions and land management agencies in the Sierra Nevada region, California, USA.Crossref | GoogleScholarGoogle Scholar |
Rollins MG (2009) LANDFIRE: a nationally consistent vegetation, wildland fire, and fuel assessment. International Journal of Wildland Fire 18, 235–249.
| LANDFIRE: a nationally consistent vegetation, wildland fire, and fuel assessment.Crossref | GoogleScholarGoogle Scholar |
Safford HD, Van de Water K (2013) Using Fire Return Interval Departure (FRID) analysis to map spatial and temporal changes in fire frequency on National Forest lands in California. USDA Forest Service, Pacific Southwest Research Station, PSW-RP-266. (Albany, CA) Available at http://www.fs.fed.us/psw/publications/documents/psw_rp266/ [Verified 3 October 2014]
Schmidt KM, Menakis JP, Hardy CC, Hann WJ, Bunnell DL (2002) Development of coarse-scale spatial data for wildland fire and fuel management. USDA Forest Service, Rocky Mountain Research Station, RMRS-GTR-87. (Fort Collins, CO) Available at http://www.fs.usda.gov/Internet/FSE_DOCUMENTS/fsbdev3_061488.pdf [Verified 3 October 2014]
Smith JH, Wickham JD, Stehman SV, Yang LM (2002) Impacts of patch size and land-cover heterogeneity on thematic image classification accuracy. Photogrammetric Engineering and Remote Sensing 68, 65–70.
Sokal RR, Rohlf FJ (1995) ‘Biometry.’ (WH Freeman and Company: New York)
Sugihara NG, van Wagtendonk JW, Shaffer KE, Fites-Kaufman J, Thode AE (2006) (Eds) ‘Fire in California’s Ecosystems.’ (University of California Press: Berkeley, CA)
Van de Water K, Safford HD (2011) A summary of fire frequency estimates for California vegetation before Euro-American settlement. Fire Ecology 7, 26–58.
| A summary of fire frequency estimates for California vegetation before Euro-American settlement.Crossref | GoogleScholarGoogle Scholar |
van Wagtendonk JW (2007) The history and evolution of Wildland Fire Use. Fire Ecology 3, 3–17.
| The history and evolution of Wildland Fire Use.Crossref | GoogleScholarGoogle Scholar |
Yue S, Pilon P, Cavadias G (2002) Power of the Mann–Kendall and Spearman’s rho tests for detecting monotonic trends in hydrological series. Journal of Hydrology 259, 254–271.
| Power of the Mann–Kendall and Spearman’s rho tests for detecting monotonic trends in hydrological series.Crossref | GoogleScholarGoogle Scholar |
Zhang J, Webster J, Powers RF, Mills J (2008) Reforestation after the fountain fire in northern California: an untold success story. Journal of Forestry 106, 425–430.