

Understanding forest fire patterns and risk in Nepal using remote sensing, geographic information system and historical fire data
Mir A. Matin A B , Vishwas Sudhir Chitale A , Manchiraju S. R. Murthy A , Kabir Uddin A , Birendra Bajracharya A and Sudip Pradhan AA International Centre for Integrated Mountain Development. GPO Box 3226, Kathmandu, Nepal.
B Corresponding author. Email: mir.matin@icimod.org
International Journal of Wildland Fire 26(4) 276-286 https://doi.org/10.1071/WF16056
Submitted: 4 April 2016 Accepted: 15 February 2017 Published: 4 April 2017
Journal Compilation © IAWF 2017 Open Access CC BY-NC-ND
Abstract
Forest fire is one of the key drivers of forest degradation in Nepal. Most of the forest fires are human-induced and occur during the dry season, with ~89% occurring in March, April and May. The inaccessible mountainous terrain and narrow time window of occurrence complicate suppression efforts. In this paper, forest fire patterns are analysed based on historical fire incidence data to explore the spatial and temporal patterns of forest fires in Nepal. Three main factors are involved in the ignition and spread of forest fires, namely fuel availability, temperature and ignition potential. Using these factors a spatially distributed fire risk index was calculated for Nepal based on a linear model using weights and ratings. The input parameters for the risk assessment model were generated using remote sensing based land cover, temperature and active fire data, and topographic data. A relative risk ranking was also calculated for districts and village development committees (VDCs). In total, 18 out of 75 districts were found with high risk of forest fires. The district and VDC level fire risk ranking could be utilised by the Department of Forest for prioritisation, preparedness and resource allocation for fire control and mitigation.
Additional keywords: fire behaviour, fire danger, fire management, fire risk.
Introduction
The Hindu Kush-Himalayan (HKH) region (Fig. 1a) extends over 3500 km encompassing all or parts of eight countries: Afghanistan, Bangladesh, Bhutan, China, India, Myanmar, Nepal and Pakistan. The region contains 10 of Asia’s largest river systems, these provide water and ecosystem services to the 210 million people living in mountain areas, as well as the 1.3 billion people downstream (Molden and Sharma 2013). The region is extremely fragile in terms of land cover diversity and its association with variable terrain, climate and socio-demographic interactions. Although the HKH region is rich in biodiversity, it is one of the most understudied regions of the world (Sharma and Chettri 2005). The Intergovernmental Panel on Climate Change (IPCC) has recognised the HKH region as a ‘data deficit area’ (IPCC 2007). In the last few decades, the HKH region has undergone rapid economic, social and environmental changes (Uddin et al. 2015). Under such transitions, the land use and land cover are experiencing changes due to natural and anthropogenic causes. It is clear that land cover changes in the HKH is a driving factor for changes in the ecosystems and their services (Koschke et al. 2012). In this mountainous region, forests play a key role in watershed protection, soil conservation and biodiversity maintenance (Acharya et al. 2011).

|
Forest fire due to natural and anthropogenic factors (Adab et al. 2013) causes economic losses to people in this region and increases the emission of carbon that influences climate change (Chowdhury and Hassan 2015). Catastrophic forest fire causes the destruction of large areas in many countries in Europe, America and Australia (Bonazountas et al. 2005). Though the impacts are relatively low compared with other major disasters, like floods, landslides and earthquakes, forest fires have direct and indirect impacts that include death, and damage to buildings and infrastructures, as well as an adverse effect on people’s health (Kochi et al. 2010; Stephenson et al. 2013; Doerr and Santín 2016; Martin 2016). In tropical, mountainous countries, fire is used as a land management tool to clear forested land for agriculture (Biswas et al. 2015). Human activities in the forest also increase the incidence of forest fire (Kunwar and Khaling 2006). In the HKH region, forest fire is one of the major factors affecting the forest ecosystem of the region. Understanding the causes and spatiotemporal patterns of forest fires is key to the development of an effective fire management plan. Forest fire in Nepal burns ~400 000 ha of land annually (Bajracharya 2002). Nepal predominantly faces forest fires during the dry season from November to June each year, with the highest concentration occurring from March to May. They are assumed to be the major driver of forest degradation, due to the unplanned burning of the undergrowth in the forest affecting its natural regeneration. Besides the physical impact in the forest, fire also has an adverse effect on the local peoples’ livelihood, by limiting the sustainable availability of forest resources and the direct damage of public assets and infrastructure. There is evidence that number of forest fires is increasing in Nepal, affecting natural vegetation as well as causing a major destruction of human settlements (Parajuli et al. 2015). Tropical, subtropical, and temperate forests of Terai, Siwalik and mid-hills, particularly those with a large distribution of Shorea robusta and Pinus roxburghii, face destruction due to forest fires every year. The main reason for the high incidence of forest fires in these zones is the hot and dry weather and proximity of the forests to human settlements, roads and agricultural land. Of the total forest fire incidences, 58% are caused by deliberate burning by grazers, poachers and non-timber forest product collectors, 22% are caused by negligence and 20% occur by accident (Kunwar and Khaling 2006).
Apart from anthropogenic interference, variable climatic pattern and prolonged winter drought are other causes of forest fires in Nepal. Due to the prolonged drought in 2009 fire incidence increased significantly, causing 41 fatalities and extensive destruction of human settlements and forests (GON 2013). Such incidents have highlighted the need for an efficient forest fire risk assessment, warning and monitoring system to improve the management of forest fires. There have been some studies analysing fire regimes in specific areas of Nepal (Bajracharya 2002; Kunwar and Khaling 2006; Wagle 2014), but no studies have been conducted on the spatio-temporal distribution of fire incidence or on fire risk covering the whole country. To fill this gap, this study analyses the spatio-temporal patterns of forest fires using active fire records (Giglio et al. 2003) from multi-temporal data of Moderate Resolution Imaging Spectroradiometer (MODIS) on board Terra and Aqua satellites from 2003 to 2013.
Earth observation data and models have been widely used for fire monitoring, danger forecasting and risk mapping. Geospatial models have been used in some parts of the world to map fire risk indices (Jaiswal et al. 2002; Saglam et al. 2008; Adab et al. 2013; Mohammadi et al. 2014; Sivrikaya et al. 2014). These models integrate various factors related to vegetation, topography and proximity of forests to human activities to estimate risk. MODIS data has been widely used to map fire severity and burnt area (Chu and Guo 2015; Chu et al. 2016) and develop danger forecasting models (Akther and Hassan 2011; Chowdhury and Hassan 2013, 2015). These models used remote sensing data to generate model parameters, for example surface temperature, vegetation indices and moisture indices (Leblon et al. 2001; Aguado et al. 2003; Leblon 2005; Bisquert et al. 2014). In this paper, we have generated a fire risk map using topographic structure, land cover, surface temperature and anthropogenic parameters. MODIS data has been used to generate land cover and surface temperature parameters while Digital Elevation Modelling (DEM) was used for topographic parameters. Spatial proximity analysis with road and settlement location was used to generate distance parameters representing human factors. Weights were assigned to different parameters in the model based on the historical fire data analysis.
Method
Study area
The study area covers the whole of Nepal, which falls between latitude 26°22′N and 30°27′N and longitude 80°40′E and 88°12′E. Nepal shares an international border with China to the north, and India to the south, east and west (Fig. 1a). The total land area of the country is 147 181 km2. It is divided into five physiographic zones – high mountains, middle mountains, hills, Siwalik and Terai (Fig. 1b), and administratively into 75 districts and 4057 village development committees (VDCs), which are grouped into five development regions – far western, mid-western, western, central and eastern (Uddin et al. 2015). Nepal predominantly exhibits mountainous terrain with elevation ranging from 58 m above mean sea level (amsl) in the southern plains to 8848 m amsl at Mount Everest in the north (Fig. 1c). Out of the total geographical area of 147 181 km2, 39.6% is covered by forests. A distinct altitudinal gradient can be observed in the distribution of forest ecosystems, starting from less than 1000 m and exceeding 4000 m. The broad forest types in Nepal are tropical forests (below 1000 m), subtropical broadleaved forests (1000–2000 m), subtropical pine forests (1000–2200 m), lower temperate broadleaved forests (1700–2700 m), lower temperate mixed broadleaved forests (1700–2200 m), upper temperate broadleaved forests (2200–3000 m), upper temperate mixed broadleaved forests (2500–3500 m), temperate coniferous forests (2000–3000 m), subalpine forests (3000–4100 m), alpine shrub (>4100 m) (GON 2014). Forests are the main source of timber and fuel wood, and also a major source of fodder for livestock.
Nepal is home to 35 forest types, 75 vegetation types and 118 ecosystems, along with four global biodiversity hotspots (Chettri et al. 2008). However, these ecosystems are facing challenges due to natural and anthropogenic induced climate change. An increase of 0.06°C to 0.12°C in mean annual temperature in most of the country was observed from 1977 to 1994 (Shrestha et al. 1999).
The amount of precipitation and its spatio-temporal distribution is determined by the annual monsoon system. There are four climatological seasons including the pre-monsoon period (March–May) that is hot and dry, the summer monsoon (June–September) is characterised by high humidity and precipitation, the post-monsoon (October–November) with reduced rainfall, and winter (December–February) that is dry and cold (Kansakar et al. 2004). Four precipitation regimes are found in the country: the central and western high mountains have the lowest level of precipitation; the Terai and Siwalik zones, distributed east to west of the country, have an intermediate level of precipitation; the central and eastern foothills of the Siwaliks and middle mountains have a moderately high amount of precipitation; and the highest precipitation areas are located on the hilltops of the middle mountains and at the foothills of the high mountains (Kansakar et al. 2004). Due to climate change, temperatures in the Terai and mid hill region of Nepal are gradually increasing. Temperatures in this region have increased ~3°C during the summer months over the last few decades and are expected to rise by 1.4°C, 2.8°C and 4.7°C by 2030, 2060 and 2090 (Pradhan et al. 2013). Changes in temperature and precipitation regimes through Nepal in coming years are expected to increase the number of forest fires (Negi et al. 2012).
Data used
Active fire data from the MODIS instrument on NASA’s Terra and Aqua satellites dating from 2003 to 2013 was used. MODIS fire observations are made four times every day from the Terra (1030 hours and 2230 hours) and Aqua (0130 hours and 1330 hours) satellites. MODIS provides two standard fire products as part of the data package; the active fire product specifies the location of the fire and the burnt area product shows the extent of the burnt area at the time of satellite overpass. The active fire product mainly uses the brightness temperature from MODIS thermal bands (band 21, 22 and 31). The location of fire corresponds to the centre of a 1 × 1 km fire pixel representing one or more fire incidences occurring within the pixel area. A contextual algorithm compares each pixel with its background pixels to calculate temperature anomalies based on a preset threshold, therefore identifying pixels that are on fire (Giglio et al. 2003; Giglio 2010). The fire information includes the confidence at which the pixel is determined to be on fire, calculated based on the brightness temperature of the target pixel; the difference between the brightness of the target pixel and the mean of the surrounding pixels; the number of adjacent cloud pixels; and the number of adjacent water pixels. The final fire product also masks out false detection based on sun glint, desert boundaries and water (Giglio et al. 2003). During the period from 2003 to 2013, 28 449 fire incidences were recorded by MODIS with confidence levels of 1–100%. To avoid false identification we have filtered out the records with less than 50% confidence level, which reduces the total number of fire records to 21 147. The distribution of these fires across different land areas is given in Fig. 2a. From this subset, 12 269 fire incidences that occurred within forest, grasslands, shrublands and outside protected areas were selected for the analysis. Records of fires within the protected areas and agriculture lands were discarded because most of the fires in these areas are managed fires.

|
Vegetation cover is the most important factor in forest fires as it represents the availability of fuel (Roy 2003). For the vegetation factor, we have used land cover data for Nepal for the year 2010 (Uddin et al. 2015). The land cover data was prepared from the Landsat TM images using an object-based image analysis method. Temperature is the second most important factor for fire ignition and spread (Roy 2003). We used Terra MODIS-derived 8 day land surface temperature (LST) data (Wan 2008) from 2003 to 2013. At first, we generated the monthly maximum LST from MODIS and then averaged the monthly maximum LST for the pre-monsoon period (March–May) for each year. This data was then averaged for the study period (2003–2013) to generate the LST factor for input into the model. Topographic characteristics are also very important factors for fire spread (Jaiswal et al. 2002). Topographic parameters (i.e. elevation, slope, and aspect) were generated from the Shuttle Radar Topographic Mission (SRTM) digital elevation model (DEM) (CGIAR-CSI 2008). Anthropogenic factors are represented by proximity of fires to settlements and roads, these were generated with the ArcGIS distance tool using settlement and road cover data of Nepal.
Analysis of spatial and seasonal patterns of forest fires
MODIS active fire data were used to analyse the spatial and seasonal patterns of fire incidence in Nepal. The data were analysed to reveal the patterns in forest fires across physiographic zones, development regions, forest types, climatic seasons and social elements such as human settlements. To explore the seasonal and temporal patterns, year and month wise forest fires, peak fire month and number of fire days were calculated per VDC.
Analysing forest fire risk zones
Forest fire risk is the likelihood in an area for ignition and spread of fire (Jaiswal et al. 2002). Various indices have been proposed in literature to estimate fire risks using natural (vegetation, humidity, elevation, slope, aspect) and anthropogenic (proximity to settlements and roads) parameters (Jaiswal et al. 2002; Filippidis and Mitsopoulos 2004; Saglam et al. 2008; Cáceres 2011; Adab et al. 2013; Mohammadi et al. 2014; Sivrikaya et al. 2014; Zhang et al. 2014). These indices are grouped into three categories: structural and long-term indices; dynamic and short-term indices; and combined indices (Adab et al. 2013). Chuvieco and Congalton (1989) introduced a structural fire index (SFI) using vegetation, elevation, slope, aspect and proximity to roads to estimate fire hazard. This method was later adopted by others when estimating SFI (Jaiswal et al. 2002; Saglam et al. 2008; Sivrikaya et al. 2014). In this study we used vegetation type (land cover), elevation, slope, seasonal mean land surface temperature and proximity to settlements and roads to calculate the fire risk index (FRI). The general expression of the FRI is given in Eqn 1:

where Wi is the relative weight of a variable and Ci is the rating for different classes within each variable. We used variables for vegetation (land cover), temperature (surface temperature), topography (elevation, slope), and anthropogenic (proximity to settlements and roads) factors in the equation as they all contribute to fire behaviour (Roy 2003). The relative weights for variables were chosen based on the literature (Chuvieco and Congalton 1989; Jaiswal et al. 2002; Saglam et al. 2008; Adab et al. 2013; Sivrikaya et al. 2014) and ratings among the different classes within each variable were chosen based on historical data analysis. Higher ratings were assigned to classes with relatively higher occurrence of historical fire incidence within that class, compared with other classes. The expression used in this study is given in Eqn 2:

where, LCR is land cover rating, TR is temperature rating, SDR is settlement distance rating, RDR is road distance rating, ER is elevation rating and SLR is slope rating. The weights and ratings for different variables and classes are given in Table 1. To assign ratings for each variable, we used the exploratory data analysis method. For example, most of the forest fire occurred in the broadleaved closed forests followed by broadleaved open forest, shrubland, grassland and needle-leaved forests. The ratings for these land cover classes were assigned accordingly. A similar approach was taken to assign ratings for the other variables: surface temperature, distance from settlements and roads, elevation, and slope. The availability of fuel and high summer temperatures are the key factors in fire risk (Roy 2003). The availability of fuel is indicated by the abundance of flammable materials on the forest floor. When analysing the fire risk, the fuel ratings are assigned based on vegetation types (Xiangwei et al. 2011). Considering this, we have assigned the highest weight to the fuel factor (i.e. LCR) in line with other previous studies. Temperature is assigned the second highest weight. Globally, 90% of fires are ignited by humans (Arndt et al. 2013) and this also holds true for Nepal (Kunwar and Khaling 2006). Hence, we used proximity of fires to settlements and roads as an indicator for human activities and assigned the third highest weight to these factors. Finally, topographic factors (elevation, slope, aspect) are also included in the equation as they influence fire behaviour. Wind, precipitation and temperature are influences by elevation and all can affect fire ignition and spread. Slope influences how fast fire can rise and aspect determines the amount of solar radiation present that influences temperature (Biswas et al. 2015). We only used elevation and slope as topographic factors, because analysis of historical fire data showed no significant variation in fire incidence for the different aspects.

|
Results and discussion
Seasonal patterns
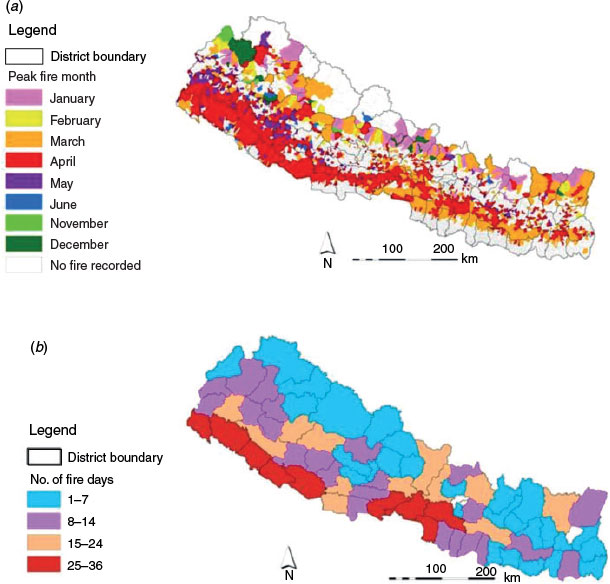
From 2003 to 2013, a total of 12 269 forest fires were recorded by MODIS sensors in Nepal in the unprotected forest, grass and shrub land with a confidence level of 50% or more. The frequency of fires was higher during recent years, that is, after 2009 (Fig. 2b). Fires start to occur in winter (December–February) with most of the fires (~89%) occurring during the pre-monsoon season (March–May) when the weather is hotter and drier (Fig. 2c). Using monthly fire incidences within VDC boundaries, a map of peak fire month per VDC was prepared (Fig. 3a). From this map, it is apparent that peak fire months vary across different landscapes of Nepal. April is the peak fire month in most parts of the country, with the exception of some areas in the eastern development region and at high altitude (Fig. 3a). In the eastern parts of the Terai, March is the peak fire month while in western Terai and most of the Siwalik hills, fire incidences peak in April. We observed a higher number of forest fire incidences in the year 2009, which corresponds with the driest year of the study period experiencing 50% less rainfall than average during the winter season, followed by the late start of the monsoon period for the year (Wang et al. 2013). The annual length of the fire season was calculated using the first and last fire incidence that occurred for individual districts. These annual lengths of the fire season were then averaged, for the 2003–13 period, to generate a map of all districts showing their mean number of fire days. The districts falling within the mid and far western and central parts of the Terai and middle mountains experienced more fire days, whereas the eastern parts of these zones observed fewer fire days (Fig. 3b). This is related to the precipitation regime in Nepal, where the monsoon season has a later onset and shorter duration in the western part of Nepal when compared with the eastern part of the country (Kansakar et al. 2004).
|
Effect of surface temperature, physiography and land cover
The analysis of the forest fire profiles across the five physiographic zones of Nepal revealed that highest number of forest fire incidences were recorded in the Siwalik zone (~37%) followed by low hill (~26%), Terai (~20%) and middle mountain (~13%). Very few fire occurrences were recorded in the high mountainous zone (Fig. 4a). About 80% of forest fires occur in the broadleaved forest. The broadleaved closed forest alone accounted for ~60% of total forest fires (Fig. 4b). This is because the tropical broadleaved forest experiences heavy leaf fall during summer (i.e. March–June) which results in the accumulation of a large amount of leaf litter, fuelling frequent and prolonged occurrences of fire during summer. The incidence of fire increases with the rise in surface temperature. Approximately 72% of fires occurred when the surface temperature rose above 30°C (Fig. 4c).

|
Effect of topography
Comparatively a higher number of forest fires occurred in lower elevation areas. About 65% of the fires were recorded in the areas below the elevation of 1000 m, whereas 85% of the incidences occurred in areas below 2000 m (Fig. 4d). Hardly any fires were recorded above 4000 m. Fire incidences also varied across different slopes. More than 30% of fires were recorded in plain lands (i.e. slope less than 5%). In the hill region, a slightly higher number of incidences were recorded in moderate slope areas (i.e. 15–35% slope), while very few incidences were recorded in areas with a slope of more than 50% (Fig. 4e). It is assumed that south facing slopes are susceptible to fire, but no significant patterns were observed in the fire records for the different aspects in Nepal (Fig. 4f).
Effect of human influence
The effect of human influence on the forest fires is indicated by the incidence of fires in proximity to settlements and roads. It is apparent from the fire records that more than 41% of fires in Nepal are recorded within 1 km of a settlement (i.e. within the same pixel of the satellite image) (Fig. 4g). The number of fires decreases with the distance from settlements. Similar patterns were also observed when fire locations were analysed in relation to the proximity of roads. About 40% of fire incidences were recorded within 1 km of a road (i.e. with one pixel) (Fig. 4h). The number of fires decreases with the distance from roads. Analysis of these two proximity factors indicates a high degree of influence by human activity on the incidence of fires.
Forest Fire risk index for Nepal
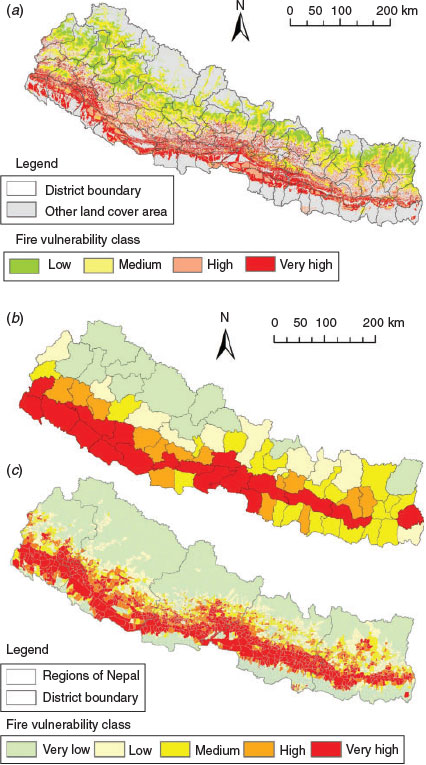
A forest fire risk index map was generated using Eqn 2. At first, we classified raster maps representing each of the parameters into the classes described in Table 1. The classified maps were then converted into rating maps for each parameter based on the relative rating for each class, as described in Table 1. The rating maps were then combined using Eqn 2 to generate the risk index map. The risk index generated by Eqn 2 was categorised into four risk classes, namely low, medium, high and very high (Fig. 5a). The classes are assigned using the natural breaks method, based on the Jenks Natural Breaks algorithm (Jenks 1977) with manual refinement in ArcGIS software (ESRI 2016). To validate the risk index we overlaid the fire incidences from 2003 to 2013 on the risk class map (Fig. 5a). The analysis shows that more than 80% of the fires occurred in high and very high risk areas justifying the model output.
|
Ranking of district and VDCs based on relative risk
The district and VDC level risk maps were generated by overlaying district and VDC boundary maps with the risk class map. Districts and VDCs were ranked based on the percentage of district or VDC area within the high and very high risk zones. The resulting maps were then classified into five risk categories: very low (<5%), low (5–14%), medium (15–29%), high (29–44%) and very high (≥45%) (Fig. 5b, 5c). The analysis shows that 31 out of 75 districts fall into high and very high fire risk classes while 22 districts fall into low or very low risk classes. Most of the districts in high and very high risk classes are located in the Terai and Siwalik zones. More districts in the western and central development regions fall in the high and very high risk classes than in the eastern development region (Fig. 5b). The low or very low risk districts are in the hills and high mountain zones. A list of districts with very high risk to forest fire is defined in Table 2. From the VDC wise risk map (Fig 5c), it is apparent that the districts in the mid and far western development region and in the central region within the Terai and Siwalik zones have a higher number of VDCs in the high and very high risk classes. The department of forest in Nepal has very limited resources for the monitoring and management of fire. The ranking of districts and VDCs based on fire risk will allow them to effectively mobilise resources in the districts and VDCs with higher risk and give more preference for distribution of fire-fighting equipment to local forest offices based on the fire risk ranking of districts.
|
Limitations
The MODIS active fire data has some inherent limitations. The Terra and Aqua satellites pass over most locations on Earth twice a day. Combined, they detect fire incidences four times in 24 h. The Terra satellite passes the same location in the morning at ~1030 hours and in the evening at ~2230 hours. The Aqua satellite passes the same location in the afternoon at 1330 hours and at night at 0130 hours. As a result of this timing, short duration fires that occur between satellite overpasses are missed. MODIS active fires are detected by calculating the thermal anomalies on a pixel 1 × 1 km in size and the location of the fire is reported as the centre of the pixel. Due to the coarse resolution, multiple fire incidences within one pixel area are reported as a single incidence. The detectability of a fire depends on the flame size but the surface heterogeneity, existence of fire in surrounding areas, clouds, heavy smoke and sun glint all affect the detectability of fires (Giglio et al. 2003, 2008; Giglio 2010).
Conclusions
In this study we analysed historical forest fire data to identify the spatial and seasonal distribution of forest fires in Nepal. The analysis provides a reasonable estimate of the occurrence of fires in various land covers, topographies and near different settlement features. Although MODIS fire data has some inherent limitations as described in section 4, the analysis will be useful for identifying fire regimes in Nepal. Using the vegetation, temperature, topography and human activity factors, we have estimated the fire risk index for Nepal. The fire risk maps will be helpful to understanding the pattern of risk across the country. The district level risk maps will be advantageous for forest managers at the national and regional levels to allocate resources among districts based on their relative risks, while the VDC level risk maps will help the district managers to develop strategies for fire management within the district and distribute firefighting equipment to areas that are in higher risk zones. The risk maps will also help in the setting up of effective firefighting infrastructure.
Acknowledgements
This study was partially supported by the SERVIR-Himalaya initiative funded by USAID and NASA. We are grateful to NASA and USAID for funding. Thanks also go to ICIMOD for providing the various data used in this study. We express our gratitude to the Department of Forest, Nepal, for their active support. We would also like to acknowledge two anonymous reviewers, an editor and an associate editor for their helpful suggestions. The views and interpretations in this paper are those of the authors and are not necessarily attributable to ICIMOD, USAID or NASA.
References
Acharya KP, Dangi RB, Acharya M (2011) Understanding forest degradation in Nepal. Unasylva 62, 31–38.Adab H, Kanniah KD, Solaimani K (2013) Modeling forest fire risk in the northeast of Iran using remote sensing and GIS techniques. Natural Hazards 65, 1723–1743.
| Modeling forest fire risk in the northeast of Iran using remote sensing and GIS techniques.Crossref | GoogleScholarGoogle Scholar |
Aguado I, Chuvieco E, Martin P, Salas J (2003) Assessment of forest fire danger conditions in southern Spain from NOAA images and meteorological indices. International Journal of Remote Sensing 24, 1653–1668.
| Assessment of forest fire danger conditions in southern Spain from NOAA images and meteorological indices.Crossref | GoogleScholarGoogle Scholar |
Akther MS, Hassan QK (2011) Remote Sensing-Based Assessment of Fire Danger Conditions Over Boreal Forest. IEEE Journal of Selected Topics in Applied Earth Observations and Remote Sensing 4, 992–999.
| Remote Sensing-Based Assessment of Fire Danger Conditions Over Boreal Forest.Crossref | GoogleScholarGoogle Scholar |
Arndt N, Vacik H, Koch V, Arpaci A, Gossow H (2013) Modeling human-caused forest fire ignition for assessing forest fire danger in Austria. iForest 6, 315–325.
| Modeling human-caused forest fire ignition for assessing forest fire danger in Austria.Crossref | GoogleScholarGoogle Scholar |
Bajracharya KM (2002) Forest fire situation in Nepal. International Forest Fire News 26, 84–86.
Bisquert M, Sanchez JM, Caselles V (2014) Modeling fire danger in Galicia and Asturias (Spain) from MODIS images. Remote Sensing 6, 540–554.
| Modeling fire danger in Galicia and Asturias (Spain) from MODIS images.Crossref | GoogleScholarGoogle Scholar |
Biswas S, Vadrevu KP, Lwin ZM, Lasko K, Justice CO (2015) Factors controlling vegetation fires in protected and non-protected areas of Myanmar. PLoS One
| Factors controlling vegetation fires in protected and non-protected areas of Myanmar.Crossref | GoogleScholarGoogle Scholar |
Bonazountas M, Kallidromitou D, Kassomenos PA, Passas N (2005) Forest fire risk analysis. Human and Ecological Risk Assessment 11, 617–626.
| Forest fire risk analysis.Crossref | GoogleScholarGoogle Scholar |
Cáceres CF (2011) Using GIS in Hotspots analysis and forest fire risk zones mapping in the Yeguare Region, Southeastern Honduras. Available at http://www.gis.smumn.edu/GradProjects/CaceresC.pdf [Verified 21 February 2017].
CGIAR-CSI (2008) ‘SRTM 90-m digital elevation data.’ Available at http://srtm.csi.cgiar.org/ [Verified 12 February 2016].
Chettri N, Shakya B, Thapa R, Sharma E (2008) Status of a protected area system in the Hindu Kush-Himalayas: an analysis of PA coverage. International Journal of Biodiversity Science & Management 4, 164–178.
| Status of a protected area system in the Hindu Kush-Himalayas: an analysis of PA coverage.Crossref | GoogleScholarGoogle Scholar |
Chowdhury EH, Hassan QK (2013) Use of remote sensing-derived variables in developing a forest fire danger forecasting system. Natural Hazards 67, 321–334.
| Use of remote sensing-derived variables in developing a forest fire danger forecasting system.Crossref | GoogleScholarGoogle Scholar |
Chowdhury EH, Hassan QK (2015) Operational perspective of remote sensing-based forest fire danger forecasting systems. ISPRS Journal of Photogrammetry and Remote Sensing 104, 224–236.
| Operational perspective of remote sensing-based forest fire danger forecasting systems.Crossref | GoogleScholarGoogle Scholar |
Chu T, Guo X (2015) Compositing MODIS time series for reconstructing burned areas in the taiga–steppe transition zone of northern Mongolia. International Journal of Wildland Fire 24, 419–432.
| Compositing MODIS time series for reconstructing burned areas in the taiga–steppe transition zone of northern Mongolia.Crossref | GoogleScholarGoogle Scholar |
Chu T, Guo X, Takeda K (2016) Temporal dependence of burn severity assessment in Siberian larch (Larix sibirica) forest of northern Mongolia using remotely sensed data. International Journal of Wildland Fire 25, 685–698.
| Temporal dependence of burn severity assessment in Siberian larch (Larix sibirica) forest of northern Mongolia using remotely sensed data.Crossref | GoogleScholarGoogle Scholar |
Chuvieco E, Congalton RG (1989) Application of remote-sensing and geographic information-systems to forest fire hazard mapping. Remote Sensing of Environment 29, 147–159.
| Application of remote-sensing and geographic information-systems to forest fire hazard mapping.Crossref | GoogleScholarGoogle Scholar |
Doerr SH, Santín C (2016) Global trends in wildfire and its impacts: perceptions versus realities in a changing world. Philosophical Transactions of the Royal Society B: Biological Sciences 371, 20150345
| Global trends in wildfire and its impacts: perceptions versus realities in a changing world.Crossref | GoogleScholarGoogle Scholar |
ESRI (2016) Classifying numerical fields for graduated symbology. Available at http://desktop.arcgis.com/en/arcmap/10.3/map/working-with-layers/classifying-numerical-fields-for-graduated-symbols.htm [Verified 19 August 2016].
Filippidis EI, Mitsopoulos ID (2004) Mapping forest fire risk zones based on historical fire data in Mount Olympus, Greece, using geographical information systems. Available at https://www.witpress.com/Secure/elibrary/papers/RISK04/RISK04056FU.pdf [Verified 8 March 2017].
Giglio L (2010) MODIS Collection 5 active fire product user’s guide version 2.4. University of Maryland. Available at http://www.fao.org/fileadmin/templates/gfims/docs/MODIS_Fire_Users_Guide_2.4.pdf [Verified 4 March 2017].
Giglio L, Descloitres J, Justice CO, Kaufman YJ (2003) An enhanced contextual fire detection algorithm for MODIS. Remote Sensing of Environment 87, 273–282.
| An enhanced contextual fire detection algorithm for MODIS.Crossref | GoogleScholarGoogle Scholar |
Giglio L, Csiszar I, Restas A, Morisette JT, Schroeder W, Morton D, Justice CO (2008) Active fire detection and characterization with the advanced spaceborne thermal emission and reflection radiometer (ASTER). Remote Sensing of Environment 112, 3055–3063.
| Active fire detection and characterization with the advanced spaceborne thermal emission and reflection radiometer (ASTER).Crossref | GoogleScholarGoogle Scholar |
GON (2013) Nepal disaster report, 2013. Ministry of Home Affairs (MoHA), Government of Nepal Available at http://flagship4.nrrc.org.np/sites/default/files/documents/Nepal%20Disaster%20Report%202013.pdf [Verified 4 March 2017].
GON (2014) Nepal national biodiversity strategy and action plan 2014–2020. Nepal Ministry of Forest and Soil Conservation. Available at https://www.cbd.int/doc/world/np/np-nbsap-v2-en.pdf. [Verified 04 03 2017].
IPCC (2007) Climate change 2007: impacts, adaptation and vulnerability. Contribution of Working Group II to the fourth assessment report of the Intergovernmental Panel on Climate Change (Eds ML Parry, OF Canziani, JP Palutikof, PJ van der Linden, CE Hanson) (Cambridge University Press: Cambridge, UK)
Jaiswal RK, Mukherjee S, Raju KD, Saxena R (2002) Forest fire risk zone mapping from satellite imagery and GIS. International Journal of Applied Earth Observation and Geoinformation 4, 1–10.
| Forest fire risk zone mapping from satellite imagery and GIS.Crossref | GoogleScholarGoogle Scholar |
Jenks GF (1977) ‘Optimal data classification for choropleth maps.’ (Department of Geography, University of Kansas: Lawrence, KS)
Kansakar SR, Hannah DM, Gerrard J, Rees G (2004) Spatial pattern in the precipitation regime of Nepal. International Journal of Climatology 24, 1645–1659.
| Spatial pattern in the precipitation regime of Nepal.Crossref | GoogleScholarGoogle Scholar |
Kochi I, Donovan GH, Champ PA, Loomis JB (2010) The economic cost of adverse health effectsfrom wildfire-smoke exposure: a review. International Journal of Wildland Fire 19, 803–817.
| The economic cost of adverse health effectsfrom wildfire-smoke exposure: a review.Crossref | GoogleScholarGoogle Scholar |
Koschke L, Furst C, Frank S, Makeschin F (2012) A multi-criteria approach for an integrated land-cover-based assessment of ecosystem services provision to support landscape planning. Ecological Indicators 21, 54–66.
| A multi-criteria approach for an integrated land-cover-based assessment of ecosystem services provision to support landscape planning.Crossref | GoogleScholarGoogle Scholar |
Kunwar RM, Khaling S (2006) Forest fire in Terai, Nepal – causes and community management interventions. International Forest Fire News 34, 46–54.
Leblon B (2005) Monitoring forest fire danger with remote sensing. Natural Hazards 35, 343–359.
| Monitoring forest fire danger with remote sensing.Crossref | GoogleScholarGoogle Scholar |
Leblon B, Alexander M, Chen J, White S (2001) Monitoring fire danger of northern boreal forests with NOAA-AVHRR NDVI images. International Journal of Remote Sensing 22, 2839–2846.
| Monitoring fire danger of northern boreal forests with NOAA-AVHRR NDVI images.Crossref | GoogleScholarGoogle Scholar |
Martin DA (2016) At the nexus of fire, water and society. Philosophical Transactions of the Royal Society B: Biological Sciences 371, 20150172
Mohammadi F, Bavaghar MP, Shabanian N (2014) Forest fire risk zone modeling using logistic regression and GIS: an Iranian case study. Small-scale Forestry 13, 117–125.
| Forest fire risk zone modeling using logistic regression and GIS: an Iranian case study.Crossref | GoogleScholarGoogle Scholar |
Molden D, Sharma E (2013) ICIMOD’s strategy for delivering high-quality research and achieving impact for sustainable mountain development. Mountain Research and Development 33, 179–183.
| ICIMOD’s strategy for delivering high-quality research and achieving impact for sustainable mountain development.Crossref | GoogleScholarGoogle Scholar |
Negi GCS, Samal PK, Kuniyal JC, Kothyari BP, Sharma RK, Dhyani (2012) Impact of climate change on the western Himalayan mountain ecosystems: an overview. Tropical Ecology 53, 345–356.
Parajuli A, Chand DB, Rayamajhi B, Khanal R, Baral S, Malla Y, Poudel S (2015) Spatial and temporal distribution of forest fires in Nepal. Available at http://www.forestrynepal.org/images/publications/wfc2015_forestfirenepal.pdf [Verified 28 February 2017].
Pradhan B, Shrestha S, Shrestha R, Pradhanang S, Kayastha B, Pradhan P (2013) Assessing climate change and heat stress responses in the Tarai Region of Nepal. Industrial Health 51, 101–112.
| Assessing climate change and heat stress responses in the Tarai Region of Nepal.Crossref | GoogleScholarGoogle Scholar |
Roy PS (2003) Forest fire and degradation assessment using satellite remote sensing and geographic information system. Available at http://www.wamis.org/agm/pubs/agm8/Paper-18.pdf [Verified 21 February 2017].
Saglam B, Bilgili E, Durmaz BD, Kadiogullari AI, Kucuk O (2008) Spatio-temporal analysis of forest fire risk and danger using Landsat imagery. Sensors 8, 3970–3987.
| Spatio-temporal analysis of forest fire risk and danger using Landsat imagery.Crossref | GoogleScholarGoogle Scholar |
Sharma E, Chettri N (2005) ICIMOD’s transboundary biodiversity management initiative in the Hindu Kush-Himalayas. Mountain Research and Development 25, 278–281.
| ICIMOD’s transboundary biodiversity management initiative in the Hindu Kush-Himalayas.Crossref | GoogleScholarGoogle Scholar |
Shrestha AB, Wake CP, Mayewski PA, Dibb JE (1999) Maximum temperature trends in the Himalaya and its vicinity: an analysis based on temperature records from Nepal for the period 1971–94. Journal of Climate 12, 2775–2786.
| Maximum temperature trends in the Himalaya and its vicinity: an analysis based on temperature records from Nepal for the period 1971–94.Crossref | GoogleScholarGoogle Scholar |
Sivrikaya F, Saglam B, Akay AE, Bozali N (2014) Evaluation of forest fire risk with GIS. Polish Journal of Environmental Studies 23, 187–194.
Stephenson C, Handmer J, Betts R (2013) Estimating the economic, social and environmental impacts of wildfires in Australia. Environmental Hazards 12, 93–111.
| Estimating the economic, social and environmental impacts of wildfires in Australia.Crossref | GoogleScholarGoogle Scholar |
Uddin K, Shrestha HL, Murthy MSR, Bajracharya B, Shrestha B, Gilani H, Pradhan S, Dangol B (2015) Development of 2010 national land cover database for the Nepal. Journal of Environmental Management 148, 82–90.
| Development of 2010 national land cover database for the Nepal.Crossref | GoogleScholarGoogle Scholar |
Wagle S (2014) ‘Problem of forest fire and its prevention.’ Available at http://www.forestrynepal.org/article/1725/5018 [Verified 23 June 2016].
Wan ZM (2008) New refinements and validation of the MODIS Land-Surface Temperature/Emissivity products. Remote Sensing of Environment 112, 59–74.
| New refinements and validation of the MODIS Land-Surface Temperature/Emissivity products.Crossref | GoogleScholarGoogle Scholar |
Wang S-Y, Yoon J-H, Gillies RR, Cho C (2013) What caused the winter drought in western Nepal during recent years? Journal of Climate 26, 8241–8256.
| What caused the winter drought in western Nepal during recent years?Crossref | GoogleScholarGoogle Scholar |
Xiangwei G, Xianyun F, Hongquan X (2011) Forest fire risk zone evaluation based on high spatial resolution RS image in Liangyungang Huaguo Mountain Scenic Spot. In ‘2011 IEEE international conference on spatial data mining and geographical knowledge services (ICSDM)’, 29 June–1 July 2011, Fuzhou, China.
Zhang HJ, Qi PC, Guo GM (2014) Improvement of fire danger modelling with geographically weighted logistic model. International Journal of Wildland Fire 23, 1130–1146.
| Improvement of fire danger modelling with geographically weighted logistic model.Crossref | GoogleScholarGoogle Scholar |