

Downward spread of smouldering peat fire: the role of moisture, density and oxygen supply
Xinyan Huang A B C and Guillermo Rein BA Department of Mechanical Engineering, University of California, Berkeley, 60 Hesse Hall, Berkeley, CA 94720, USA.
B Department of Mechanical Engineering, Imperial College London, 614 City and Guilds Building, South Kensington, London SW7 2AZ, UK.
C Corresponding author. Email: seuhxy@gmail.com
International Journal of Wildland Fire 26(11) 907-918 https://doi.org/10.1071/WF16198
Submitted: 1 November 2016 Accepted: 6 August 2017 Published: 31 October 2017
© The Authors 2017 Open Access CC BY-NC-ND, published on behalf of IAWF
Abstract
Smouldering fires in peatland are different from the flames in wildland fires. Smouldering peat fire is slow, low-temperature and more persistent, releasing large amounts of smoke into the atmosphere. In this work, we experimentally and computationally investigate the vertical downward spread of smouldering fire in a column of 30 cm-tall moss peat under variable moisture content (MC) and bulk density. The measured downward spread rate decreases with depth and wet bulk density, and is ~1 cm h−1 equivalent to a carbon emission flux of 200 tonnes day−1 ha−1. We observe that downward spread increases as MC increases substantially at least inside the range from 10 to 70%, which is not intuitive and goes against the trend observed for the horizontal spread in the same peat. We also conduct one-dimensional computational simulations to successfully reproduce the experimental observations. The analysis shows that the spread rate increases with MC and decreases with density because smouldering spread is controlled by the oxygen supply. The volume of the porous peat expands when absorbing water, which reduces the density of organic matter and decreases the heat release rate. This shows that the widely assumed conclusion that the spread rate of wildfire decreases with MC is not universal when applied to smouldering fires.
Additional keywords: carbon emission, fire spread rate, in-depth spread, modelling, peatland.
Introduction
Peatlands are important ecosystems in the boreal and tropical regions, not only supporting the biological diversity for a wide range of wildlife habitats, but also storing 25% of the world’s soil carbon (Page et al. 2011). Smouldering wildfires in peatlands are the largest combustion phenomena on Earth and contribute greatly to the global emission of greenhouse gasses (Rein 2013). Annually, peat fires release a huge amount of ancient carbon, approximately equivalent to 15% of human-made emissions (Page et al. 2002; Ballhorn et al. 2009). Also, they result in the widespread destruction of ecosystems and regional haze events, e.g. recent mega-fires in South-east Asia, North America and north-east Europe (Page et al. 2002; Rein 2013). Moreover, recent global warming dries the peatlands and increases the depth of belowground soil combustion, creating a positive feedback to the climate system (Turetsky et al. 2015).
Smouldering is the slow, low-temperature, flameless burning of porous fuels, and the most persistent type of combustion phenomena. Smouldering involves heterogeneous reactions, and is especially common in porous solid fuels like coal and organic soils with a charring tendency (Rein 2016). Peat, as a typical organic soil, is a porous and charring natural fuel (Chambers et al. 2011), thus prone to smouldering. Once ignited, smouldering peat fires can burn for very long periods of time (e.g. months and years) despite extensive rains, weather changes, or fire-fighting attempts (Rein 2013).
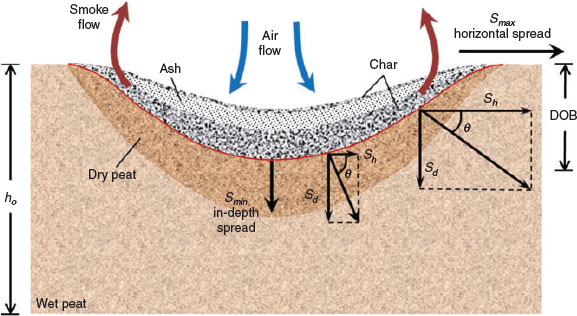
Two mechanisms control the spread of smouldering combustion: oxygen supply and heat losses (Ohlemiller 1985; Rein 2016). Most smouldering peat fires are initiated on the ground surface by flaming fires, lightning strikes, hot particles and self-heating (Restuccia et al. 2017). The probability of ignition depends on the ignition source, environmental conditions, peat moisture content (MCA), inorganic content (IC), chemistry, and other transport properties. As illustrated in Fig. 1, once ignited on the free surface, the smouldering fire spread is a volumetric phenomenon, including a vertical downward spread component (Sd) and a horizontal spread component (Sh). Near the free surface, the lateral spread may reach a maximum, whereas in the deep layer, the in-depth spread dominates. The forward smouldering dominates both spread components and eventually leads to a void or hole in the general shape of the semi-ellipsoid or pan (Huang and Rein 2014; Rein 2016).
|
Several researchers looked into the ignition, and the forward smouldering spread using small soil samples (~5 cm thick) under a high oxygen supply (Frandsen 1987, 1997; Hadden et al. 2013; Huang et al. 2015). Frandsen (1987, 1997) experimentally studied the ignition threshold for various soil samples and found a correlation between critical MC and IC. This correlation was recently verified and further corrected by a numerical model in Huang et al. (2015). Hadden et al. (2013) performed an ignition and fire spread experiment on the small-scale moss peat, and revealed the pyrolysis and oxidation reactions in the char formation. For the large-scale peat fires in the field, the downward spread of smouldering fire was found to consume peat layers up to depths of 50 cm (Page et al. 2002; Rein et al. 2008; Ballhorn et al. 2009).
The depth of burn (DOB) is the thickness of soil layers burnt through the smouldering fire (see Fig. 1), which plays an important role in the estimation of soil carbon emission. The DOB and critical MC for extinction  at the vertical downward (or in-depth) spread of peat fires have been investigated by various experiments (Benscoter et al. 2011; Watts 2012; Davies et al. 2013; Zaccone et al. 2014) and numerical simulations (Huang and Rein 2015, 2016a; Yang et al. 2016). Recently, laboratory experiments on the horizontal fire spread over a shallow peat sample showed that the spread rate decreased with MC but increased with the forward wind speed (Huang et al. 2016; Prat-Guitart et al. 2016). However, He et al. (2014) found that the downward smouldering spread rate over the piled biomass powder was not sensitive to MC from 3 to 21%. Thus, the idea of peat fire spread always decreasing with increasing MC, although it sounds logical, is not necessary well tested or supported.
For the limited research of downward peat fire spread in the literature, many tested soil samples were shallow (<5 cm), and other deep samples had at heterogeneous MC profile or had a clear 2-D (horizontal + vertical) fire spread behaviour (See Fig. 1). These complexities limit the quantitative understanding of downward smouldering spread behaviours and the role of key parameters, such as MC, density and oxygen supply, posing a knowledge gap. In this work, the downward spread of smouldering peat fires is first studied using the 30 cm-high columns of homogeneous peat in the controlled laboratory experiments, and then using the numerical modelling for different peat moisture and density conditions.
Experiments
Experimental setup
Fig. 2a shows the schematic diagram of the experimental setup for the downward peat fire spread. A smouldering reactor was built using the 1.27 cm-thick insulation ceraboard to contain the peat sample and had an inner cross-section area of 10 × 10 cm2 and a height of 30 cm. The fire reactor was further covered by several layers of aluminium foil to prevent the gas leakage and reduce the radiative heat loss. As (1) the vertical dimension was clearly larger than the cross-section dimension and (2) the smouldering spread is extremely slow, the whole downward spread may be approximated as a 1-D spread phenomenon, similar to those in Benscoter et al. 2011 and Zaccone et al. 2014). This 1-D dominated downward spread of smouldering peat fire without the wind is different from other multi-dimensional smouldering spread over small and shallow peat samples (Hadden et al. 2013; Huang et al. 2016; Prat-Guitart et al. 2016; Yang et al. 2016).

|
The peat used in the experiment is a commercial moss peat from Ireland (Shamrock Irish Moss Peat, Bord na Mona Horticulture Ltd, see Fig. 2b). Compared with the naturally sourced peat, it was readily available in large quantities, has relatively homogeneous properties and constant composition, and has been used in a series of past experiments (Belcher et al. 2010; Hadden et al. 2013; Huang et al. 2016; Prat-Guitart et al. 2016). After the oven-drying process, this moss peat has a bulk density of 135 ± 5 kg m−3 in its natural state and a low mineral content (IC ~2%). Compared to woody biomass and sandy soils, the natural bulk density is fairly low because the size of peat particle is coarse, leaving a large pore space. The element analysis for the organic matter shows a respective mass fraction of 53.8, 5.5, 38.4, 1.9 and 0.5% for C, H, O, N and S.
To obtain the desired MC, the peat sample was first dried at 90°C for 48 h, and then well mixed with the corresponding amount of water, the same process as in Huang et al. (2016). For example, 1.7 kg of 70% MC peat requires 1 kg of dry peat mixed with 0.7 kg of water. Afterward, the mixed sample was left to rest inside a sealed basket for homogenisation without compression for at least another 48 h. Once the dry peat came in contact with air, it would quickly absorb the ambient moisture to reach an equilibrium with air of MC = ~10%, so testing peat with MC = 0% was not practical. Other targeted values for peat were 35 and 70%. After mixing, the MC of peat sample was also measured, showing the uncertainty of MC is ±5%.
During the water absorbing process, the volume of peat sample tended to expand naturally, which is an important natural phenomenon. Thus, although the measured wet bulk density of peat (ρwp, kg m−3) increases with MC, the dry bulk density of peat or the density of organic matterB (ρp, kg m−3) decreases with MC. The measure bulk densities are shown in Fig. 2c and their values can be correlated with MC as:


Additionally, to investigate the influence of peat density, the dried peat was compressed uniformly to increase 40% of its original density to ρwp = 190 ± 5 kg m−3.
For ignition, a 10 cm-long coil heater was placed 5 cm below the top free surface. The ignition protocol was fixed to be 100 W for 30 min, which was strong enough to initiate a uniform smouldering front in a peat sample of MC <150%. To monitor both the temperature and the location of the smouldering front, thermocouple probes were inserted through the sidewall into the central axis of the sample column. These thermocouples were K-type, and had the 0.5-mm bead and 0.1-Hz scan frequency, placed from 5 cm (coil heater) to 29 cm (near the bottom) below the free surface with a 2-cm interval (see Fig. 2a). At least two to three experiments were conducted at each condition, and a good experimental repeatability was found.
Experimental results
In the experiment, a typical downward smouldering spread over a 30 cm-deep sample could last from 20 to 50 h, depending on the MC and density of peat. Fig. 3 shows a group of thermocouple measurements in the downward fire spread under different peat MCs and densities, where the negative sign of the thermocouple position means the distance below the initial free surface (z = 0). During the forced ignition by the coil heater (t < 30 min), the temperature near the ignition zone (i.e. −7 and −9 cm) rapidly increased and exceeded 600°C. After the ignition, the temperature first decreased, and then increased again, which indicates a self-sustained smouldering front. Fig. 4a illustrates a typical process of downward spread of smouldering peat fire.

|

|
During the downward smouldering spread, the peak temperature was ~550–600°C right below the ignition zone, and its value did not vary under different MCs or wet bulk densities. As the smouldering fire spread downward, the peak temperature slowly decreased with the depth, and such decrease became less prominent as the MC increased. At the same time, the volume of peat sample shrank and the top free surface regressed. Once the free surface regressed below a thermocouple, the thermocouple started to record the gas temperature and showed a high-frequency temperature variation. This signal change could tell the position of the regressed free surface.
During the downward fire spread, a thin black char layer was observed on the free surface, and it was not converted into white ash, probably because of a large heat loss to the environment. Below this thin char layer, a white ash layer could be observed. Near the end of spread, the sample temperature was found to be below 200°C, where the smouldering front (or the char-oxidation zone) could not be sustained any more. Therefore, another black char layer of 1–4 cm thick was left on the bottom. After extinction, this sandwich structure of fire residue (char + ash + char, see (IV) End of spread in Fig. 4a) was always observed under all MCs and bulk densities, and also in previous horizontal spread experiments with the shallow samples of the same peat (Huang et al. 2016).
The approximate rate of fire spread can be estimated from the burning duration, as shown in Fig. 3, where the burning duration decreases with the increasing MC while increases with the increasing wet bulk density (ρwp). More accurate spread rate can be determined by tracking the moments when thermocouples reached their peak temperature. Fig. 4b shows the measure downward (or in-depth) spread rate (Sd, cm h−1) as a function of depth, where the error bar indicates the uncertainty from repeating experiments. Clearly, the downward spread rate decreases with the depth under all MCs. Specifically, the spread rate is found to be in the range from 0.5 to 2 cm h−1, which agrees with the measurement in the natural peat fire (Usup et al. 2014). Also, it is in the same order of the horizontal spread rate (Sh, cm h−1) of the same peat (Huang et al. 2016; Prat-Guitart et al. 2016), but slightly smaller (see Fig. 4c). Unlike the horizontal fire spread controlling the burning area, the downward spread controls the carbon emission per unit peat-fire area (Rein 2013). Therefore, the burning rate of carbon (or the carbon emission flux) of this peat can be estimated as:
where the dry peat density ρp = 135 kg m−3 and its carbon mass fraction YC = 54%.
Fig. 4c further shows the effect of MC on the downward spread (Sd) and compares with the horizontal spread (Sh) in Huang et al. (2016). Interestingly, as the peat MC increases, the downward spread rate continuously increases. Compared with the dried peat (MC = 10%), the spread rate for MC = 35 and 70% increases ~80 and 150% respectively. This result goes against our intuition and is opposite to the previous finding in the horizontal spread near the free surface for the same peat (same type, density and MC), where the spread rate decreased with increasing MC (Huang et al. 2016; Prat-Guitart et al. 2016). There are two possible reasons: (1) the water in the porous peat matrix increases the overall thermal conductivity in the drying zone, which facilitates the heat transfer from the upstream oxidation zone, and (2) the reduction of fuel density (ρp) due to the natural expansion of peat sample after the water absorption (see Fig. 2c). Note that it is also possible to have a downward spread rate larger than the horizontal spread rate, especially in the deep layer where Sd > Sh at θ > 45° in Fig. 1.
Additionally, as the peat dry bulk density (ρp) increased by 40%, the spread rate decreased ~40%. This implis that for the dry peat, the oxygen supply might control the burning rate ( , kg m−2 s−1) and the downward spread rate (Sd) as:
where  is the oxygen supply;
  is the oxygen stoichiometric coefficient;
  = ~0.233 is the oxygen mass fraction in air; and
  is the characteristic air diffusion speed. In the current experiments, the boundary condition in the free surface was fixed without wind, so the oxygen supply should be the similar for different peat MCs and bulk densities.
Referring to Eqn 2, we may fit a semi-empirical correlation for the downward fire spread rate [cm/h] as:
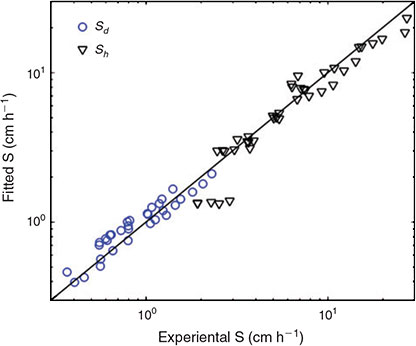
where ρw is the wet bulk density of peat; the depth is 5 cm < z (cm) < 30 cm; and MC < 80%. The expression shows Sd increases with MC, but decreases with the wet bulk density and depth. The fitting coefficients, searched using the genetic algorithm, give an excellent fit (R2 = 0.96), as shown in Fig. 5. Note that this expression is only one of many possible which could provide a good fitting to the same dataset.
|
Similarly, we may fit the previously measured horizontal fire spread rate [cm/h] in Huang et al. (2016) as:
where U (m s−1) is the near ground wind speed; 2 < z <10 cm; and MC < 130%. The expression shows Sh increases with wind, but decreases with MC, wet bulk density and depth. The R2 value for this fitting expression is 0.95, as also plotted in Fig. 5. But caution is needed when applying these correlations to other peat types and environmental conditions.
Numerical modelling
Model setup
To better explain the experimental results and understand the role of oxygen supply, MC and density, a 1-D numerical model for the downward peat fire spread is applied. Previously, this model has been demonstrated to successfully simulate the ignition and extinction of peat fire and used to analyse the role of atmospheric oxygen concentration, MC and IC (Huang and Rein 2015, 2016a, 2016b; Huang et al. 2015). The setup of the model will be briefly described here, and more details can be found in Huang and Rein (2015).
The 1-D computational domain has the same sample depth as that in the experiment, illustrated in Fig. 4a. The model includes transient equations for the condensed-phase mass conservation, species conservation, and energy conservation, and the gas-phase mass conservation, species conservation and momentum conservation (Darcy’s Law). The model assumes the thermal equilibrium between gas and solid phase, the unit Schmidt number, and the same diffusion coefficient and specific heat for all gasses (see more details in Huang and Rein 2015). Note that the model does not consider the detailed pore structure of solid particles and the corresponding intra-particle diffusion. When the particle temperature is high (>500°C), the localised intra-particle (Knudsen) diffusion may start to limit the oxygen supply to heterogeneous reactions and slows down the temperature rise.
At the top free surface (z = 0), a convection coefficient hc,0 = 10 W m−2 K−1, capturing the environmental convective cooling, and the surface re-radiation (ϵ = 0.95) are set. Based on the heat-mass transfer analogy, the maximum mass transfer number,  = 10 g m−2 s−1, is used for the gas species conservation. The ambient pressure and temperature are constant, at 1 atm and 300 K. An external radiation (
 = 30 kW m−2) is applied at z = 0 to simulate the ignition by the coil heater. At the bottom boundary (z = −δ), the heat loss is applied using hc,−δ = 5 W m−2 K−1; and there is no mass flux
  = 0 g m−2 s−1 (Huang and Rein 2015).
These transient equations are solved using an open-source code, Gpyro (Lautenberger and Fernandez-Pello 2009). It adopts a fully implicit formulation for the solution of all conservation equations. Simulations were run with an initial cell size of Δz = 0.2 mm, and initial time step of 0.02 s. Reducing the cell size and time step by a factor of 2 gives very small difference in results, so this discretisation is acceptable.
Parameter selection
The heterogeneous chemistry for smouldering peat fire is described by a five-step kinetics, proposed previously based on the thermogravimetric analysis (TGA) (Huang and Rein 2014, 2016b). The five steps are given in Eqn 4a drying (dr), Eqn 4b peat pyrolysis (pp), Eqn 4c peat oxidation (po), Eqn 4d β-char oxidation (βo) and Eqn 4e α-char oxidation (αo) as:


where υ is the stoichiometric coefficient; subscripts w, p, α, β and a represent five condensed species: water, peat, α-char, β-char, and ash, in addition to four gaseous species: oxygen, nitrogen, water vapour, and emission gasses.
The non-dimensional reaction rate of reaction (k) can be expressed by the Arrhenius law as.
where Zk and Ek are the pre-exponential factor and the activation energy respectively. The functions for mass action of reactants A and O2 are.
where nk and  are the reaction orders of reaction and oxygen respectively. The kinetic parameters of this Irish moss peat have been previously obtained by optimising the TG data in both inert and oxidative atmospheres (Huang and Rein 2016b) and are listed in Table 1.
|
 gas and ΔH > 0 is endothermic and ΔH < 0 is exothermic. The kinetic parameters for drying is modified to reflect the rapid and simultaneous processes of evaporation and condensation in a narrowed temperature region at ~100°C. For variable definitions please see the Nomenclature list
For modelling a reactive porous media, the species porosity can be estimated as.
where the bulk (or packing) density (ρi,0) can be measured in experiment, and solid density (ρs,i) is selected from the literature (Jacobsen et al. 2003). Preliminary small-scale experiments in a hot oven with nitrogen showed that during the process of peat decomposing into char, despite of the gas release and mass loss, due to the increase in porosity, the volume changed less than 5%. Thus, the actual bulk density of char can be estimated as  and
and  . Note that although the bulk density increases 40% after compression, the decrease in porosity and the calculated permeability is small because the peat sample is highly porous.
The effective thermal conductivity includes the radiation heat transfer across pores and is a strong function of temperature as.

where γi = ~10−4–10−3 m depends on the pore size (Yu 2012). Table 2 lists the species thermos-physical parameters used in the model. The averaged properties in each cell are calculated, for example, as.

|

where Xi and Yi are the mass fraction and volume fraction respectively. For example, the thermal conductivity of wet peat is estimated as.
which increases with linear with MC, agreeing with the experimental measurements at Xw < 0.15 (Campbell et al. 1994).
Modelling results
Fig. 6 shows the simulated temperature profile at the same location of thermocouplesC and presents a direct comparison with the experiment in Fig. 3. In general, a good agreement is shown between simulation and experiment on (1) the shape of temperature profile where the duration of the temperature-rise stage increases with depth, (2) the peak temperature (~600°C for all cases), and (3) the duration of fire spread that decreases with MC while increasing the bulk density (or the degree of compression). Therefore, the proposed model is proved to be an accurate and reliable tool to describe the downward spread of smouldering peat fire.

|
Fig. 7 further shows the detailed profile for temperature, reaction rate and species for peat MCs of 10 and 70%. The temperature gradients in both ash layers are found to be similar because of the same free surface cooling condition and a similar ash layer thickness (δa). Within the ash layer, some char remains because the large heat loss to environment prevents the complete oxidation. In contrast, the temperature gradient in the char layer (or the peat-pyrolysis zone) is found to be greater for the higher MC. This is because a larger amount of heat should be conducted downstream to evaporate a larger amount of water. As the result, for the wetter peat, the drying rate is larger, and the thickness of char layer (δc) is smaller.

|
For the given MC, the thickness of char layer is controlled by the competition between the rate of peat pyrolysis (or char formation) and char oxidation, and before spreading to the bottom, it increases with time and depth. The growth of char layer is responsible for the reduction in the rate of temperature rise, seen in both experiment (Fig. 3) and simulation (Fig. 6). Moreover, as the char layer thickness increases, the portion of heat generation that transfers downstream is reduced, resulting in the decreasing spread rate with the depth. Near the bottom, the extinction occurs, and char is not completely consumed because of the large heat loss from the bottom, leaving a char-ash-char sandwich structure. The real bottom heat loss in the experiment is large and in multiple directions, and is responsible for the decrease of the peak temperature (see Fig. 3). Such behaviour is not well modelled and may be beyond the capability of the current 1-D model.
Like the experiment, the spread rate in the simulation can be obtained by tracking the time and location of the peak temperature. Fig. 8a shows the predicted downward fire spread rate against the depth and MC and compared with the experimental result in Fig. 4b. In general, the influences of MC and depth are both well predicted: the predicted downward spread rate decreases with the depth and increases with the MC. Moreover, the direct comparison with experimental data shows an excellent agreement. As discussed above, the decreasing spread rate with the depth is caused by the growth of char layer which reduces the heat transfer downstream.

|
To better illustrate the effect of MC, Fig. 8b shows the spread rate as a function of MC at different depths. Note that the critical MC for fire spread found in the simulation is MC* = 145%, agreeing with the experimental observation that the fire can spread at MC = 130% but not at MC = 150%. Specifically, as MC increases from MC = 10 to 145%, the downward spread rate (Sd) is almost tripled. As discussed above, two reasons may be responsible for the accelerated fire spread in the wetter peat: (i) the increase of thermal conductivity in wet peat layer, and (ii) the reduction of fuel density due to the natural expansion of peat sample after the water absorption. Thus, these two possible reasons are investigated using this numerical model.
First, simulations are performed by fixing MC and varying effective thermal conductivity of wet peat (ρwp, see Eqn 6). However, a negligible difference is found in the spread rate, which rules out the influence by changing thermal conductivity (not plotted here). Then, simulations are performed by fixing MC and varying the peat wet bulk density or the degree of compression or expansion. Fig. 9a shows the averaged downward fire spread rate between z = −10 and −20 cm as a function of wet bulk density of peat (ρwp). For both MCs, it is found that the spread rate decreases with the wet bulk density because of the increase of dry bulk (fuel) density or the volume expansion, agreeing with the experiment.

|
To identify the effect of fuel density, Fig. 9b replots the data in Fig. 9a as a function of dry bulk (fuel) density,  . Clearly, if fixing the fuel density, the spread rate under different MCs becomes very close to each other. In other words, if the peat volume expansion is small after absorbing the water, the downward spread rate becomes insensitive to MC.
Note that in this extremely slow fire spread, the smouldering fire spread rate is the same as the fuel consumption (burning) rate, and the latter is controlled by the oxygen supply. Therefore, we can conclude that it is the oxygen supply, rather than the MC, controlling the downward peat fire spread in current experiments. This is completely different from the horizontal peat fire spread near the free surface where the oxygen supply is sufficient. Then, the MC is found to dominate the horizontal spread rate for the wet peat, and the influence of oxygen is smaller for a wetter peat (Huang et al. 2016).
Conclusions
In this study, we use experimental and computational approaches to investigate the downward smouldering spread of peat fire under different moisture contents and bulk densities. There are no experimental data on the downward spread before this study. The downward spread is an important phenomenon of peat fire because it is responsible for the depth of burn and the fuel consumption per unit area. Thus, downward spread determines the rate of carbon emission per unit area (Rein 2013). We report measurements of a characteristic downward spread rate in the range from 0.5 to 2 cm h−1, which would result in a carbon emission flux in the order of 1 kg h−1 m−2 (or 200 tonnes day−1 ha−1) for an organic matter density of 130 kg m−3.
We found that the downward spread of smouldering fire in peat is more sensitive to oxygen supply than to heat losses. As wind speed increases, convective heat loss increases and the oxygen supply increases. However, for flaming wildland fires, flame spread increases with the wind speed due to increased convective heating, rather than increased oxygen supply (Williams 1982). This is a significant difference between smouldering and flaming wildland fires, because smouldering combustion is controlled by heat losses and oxygen supply (Ohlemiller et al. 1985; Rein 2016). The spread rate of smouldering is known to vary with depth. However, because both the density and moisture of peat change with depth in real peatlands (Benscoter et al. 2011), relying on field studies alone has not allowed differentiation of the effect of depth v. density v. moisture until now. For this reason, laboratory-controlled experiments are most valuable. By controlling each of these variables separately, our work shows that downward smouldering spread rate decreases substantially with the depth because the oxygen supply is reduced. Also, by fixing the oxygen supply, we observe that the downward smouldering spread reduces with bulk density. Clarification of these effects is novel.
For the effect of peat moisture, we report for the first time the counterintuitive fact that the downward spread rate increases substantially with moisture, at least inside the range from 10% to 70% (higher MC values were not explored). For example, the spread rate at 70% MC is twice the rate at 10% MC. This goes against previously observed trends for the horizontal spread of the same peat (Huang et al. 2016) and other peat types (Prat-Guitart et al. 2016). Our analysis shows that the spread rate increases with MC because of the volume expansion of the peat when absorbing water, which reduces the density of organic matter. This shows that the widely assumed conclusion that the spread rate of wildfire decreases with MC is not universal when applied to smouldering fires.
Conflicts of interest
The authors declare that they have no conflicts of interest.
Nomenclature
Variables
 , heat capacity (kJ kg−1 K−1).
 , activation energy (kJ mol−1).
 , heat-transfer coefficient (W m−2 K−1).
 , mass-transfer coefficient (g m−2 s−1).
 , heat of reaction (MJ kg−1).
 , thermal conductivity (W m−1 K−1).
 , flow permeability (m2).
 , mass flux (g m−2 s−1).
 , reaction order (–).
 , external heat flux (kW m−2).
 , universal gas constant, 8.314 (J mol−1 K−1).
 , smouldering fire spread rate (cm h−1).
 , time (s).
 , temperature (°C or K).
 , volume fraction (–).
 , mass fraction (–).
 , depth (cm).
 , pre-exponential factor (s−1).
IC, inorganic content (%).
MC, moisture content (%).
Greek letters
 , radiative coefficient (m).
 , thickness (m).
 , emissivity (–).
 , spread direction angle (–).
 , stoichiometric coefficient (–).
 , density (kg m−3).
 , Stefan–Boltzmann constant (kg s−3 K−4).
 , porosity (–).
 , volumetric reaction rate (s−1 m−3).
Superscripts
*, critical.
Subscripts
0, initial.
α/αo, α-char/α-char oxidation.
β/βo, β-char/β-char oxidation.
a, ash.
d, downward spread.
dr, drying.
g, gas.
i, condensed species index.
j, gaseous species index.
k, reaction index.
p/po/pp, peat/peat oxidation/peat pyrolysis.
s, solid.
u, upward spread.
w, water.
wp, wet peat.
Acknowledgements
This research was funded by European Research Council (ERC) Consolidator Grant HAZE (682587). The authors thank Dr Rory Hadden (University of Edinburgh) for his assistance in part of the experiments.
References
Ballhorn U, Siegert F, Mason M, Limin S, Limin S (2009) Derivation of burn scar depths and estimation of carbon emissions with LIDAR in Indonesian peatlands. Proceedings of the National Academy of Sciences of the United States of America 106, 21213–21218.| Derivation of burn scar depths and estimation of carbon emissions with LIDAR in Indonesian peatlands.Crossref | GoogleScholarGoogle Scholar | 1:CAS:528:DC%2BC3cXjvFOhsrs%3D&md5=09fe129cffbaa18e95078f19656f76b6CAS |
Belcher CM, Yearsley JM, Hadden RM, Mcelwain JC, Rein G (2010) Baseline intrinsic flammability of Earth’s ecosystems estimated from paleoatmospheric oxygen over the past 350 million years. Proceedings of the National Academy of Sciences of the United States of America 107, 22448–22453.
| Baseline intrinsic flammability of Earth’s ecosystems estimated from paleoatmospheric oxygen over the past 350 million years.Crossref | GoogleScholarGoogle Scholar | 1:CAS:528:DC%2BC3MXkslSksg%3D%3D&md5=e75e2183d1a7338adb4d98b718ed4842CAS |
Benscoter BW, Thompson DK, Waddington JM, Flannigan MD, Wotton BM, de Groot WJ, Turetsky MR (2011) Interactive effects of vegetation, soil moisture and bulk density on depth of burning of thick organic soils. International Journal of Wildland Fire 20, 418–429.
| Interactive effects of vegetation, soil moisture and bulk density on depth of burning of thick organic soils.Crossref | GoogleScholarGoogle Scholar | 1:CAS:528:DC%2BC3MXlsFGlsLo%3D&md5=b7e1df5d9311ed5463556090e6415a85CAS |
Campbell GS, Jungbauer JD, Bidlake WR, Hungerford RD (1994) Predicting the effect of temperature on soil thermal conductivity. Soil Science 158, 307–313.
| Predicting the effect of temperature on soil thermal conductivity.Crossref | GoogleScholarGoogle Scholar | 1:CAS:528:DyaK2MXis1ans7k%3D&md5=97f9dd5633e0a242fb5850f87c24f0b4CAS |
Chambers FM, Beilman DW, Yu Z (2011) Methods for determining peat humification and for quantifying peat bulk density, organic matter and carbon content for palaeostudies of climate and peatland carbon dynamics. Mires and Peat 7, 1–10.
Davies GM, Gray A, Rein G, Legg CJ (2013) Peat consumption and carbon loss due to smouldering wildfire in a temperate peatland. Forest Ecology and Management 308, 169–177.
| Peat consumption and carbon loss due to smouldering wildfire in a temperate peatland.Crossref | GoogleScholarGoogle Scholar |
Frandsen WH (1987) The influence of moisture and mineral soil on the combustion limits of smouldering forest duff. Canadian Journal of Forest Research 17, 1540–1544.
| The influence of moisture and mineral soil on the combustion limits of smouldering forest duff.Crossref | GoogleScholarGoogle Scholar |
Frandsen WH (1997) Ignition probability of organic soils. Canadian Journal of Forest Research 27, 1471–1477.
| Ignition probability of organic soils.Crossref | GoogleScholarGoogle Scholar |
Hadden RM, Rein G, Belcher CM (2013) Study of the competing chemical reactions in the initiation and spread of smouldering combustion in peat. Proceedings of the Combustion Institute 34, 2547–2553.
| Study of the competing chemical reactions in the initiation and spread of smouldering combustion in peat.Crossref | GoogleScholarGoogle Scholar | 1:CAS:528:DC%2BC2cXhvV2ntbY%3D&md5=f5e7eda64b69e8ae289803174a1135e8CAS |
He F, Yi W, Li Y, Zha J, Luo B (2014) Effects of fuel properties on the natural downward smoldering of piled biomass powder: experimental investigation. Biomass and Bioenergy 67, 288–296.
| Effects of fuel properties on the natural downward smoldering of piled biomass powder: experimental investigation.Crossref | GoogleScholarGoogle Scholar | 1:CAS:528:DC%2BC2cXht1WmtL%2FE&md5=72c13e59d30d6d113921f920256dc200CAS |
Huang X, Rein G (2014) Smouldering combustion of peat in wildfires: inverse modelling of the drying and the thermal and oxidative decomposition kinetics. Combustion and Flame 161, 1633–1644.
| Smouldering combustion of peat in wildfires: inverse modelling of the drying and the thermal and oxidative decomposition kinetics.Crossref | GoogleScholarGoogle Scholar | 1:CAS:528:DC%2BC2cXht1Cjs7Y%3D&md5=462173cb0230a8771dc247ac9fe98500CAS |
Huang X, Rein G (2015) Computational study of critical moisture and depth of burn in peat fires. International Journal of Wildland Fire 24, 798–808.
| Computational study of critical moisture and depth of burn in peat fires.Crossref | GoogleScholarGoogle Scholar |
Huang X, Rein G (2016a) Interactions of Earth’s atmospheric oxygen and fuel moisture in smouldering wildfires. The Science of the Total Env-ironment 572, 1440–1446.
| Interactions of Earth’s atmospheric oxygen and fuel moisture in smouldering wildfires.Crossref | GoogleScholarGoogle Scholar | 1:CAS:528:DC%2BC28XntVOrsrg%3D&md5=a3665af78ea7944a75022a7a3cb3049cCAS |
Huang X, Rein G (2016b) Thermochemical conversion of biomass in smouldering combustion across scales: the roles of heterogeneous kinetics, oxygen and transport phenomena. Bioresource Technology 207, 409–421.
| Thermochemical conversion of biomass in smouldering combustion across scales: the roles of heterogeneous kinetics, oxygen and transport phenomena.Crossref | GoogleScholarGoogle Scholar | 1:CAS:528:DC%2BC28Xhtl2rurc%3D&md5=7e676ac03300a6e2e8999cea64435860CAS |
Huang X, Rein G, Chen H (2015) Computational smoldering combustion: predicting the roles of moisture and inert contents in peat wildfires. Proceedings of the Combustion Institute 35, 2673–2681.
| Computational smoldering combustion: predicting the roles of moisture and inert contents in peat wildfires.Crossref | GoogleScholarGoogle Scholar | 1:CAS:528:DC%2BC2cXhtFSrurzJ&md5=87c5f4cf768c6d703cbd0af6e22e70a4CAS |
Huang X, Restuccia F, Gramola M, Rein G (2016) Experimental study of the formation and collapse of an overhang in the lateral spread of smouldering peat fires. Combustion and Flame 168, 393–402.
| Experimental study of the formation and collapse of an overhang in the lateral spread of smouldering peat fires.Crossref | GoogleScholarGoogle Scholar | 1:CAS:528:DC%2BC28XitV2ktL4%3D&md5=51f281b68ca1f5495debb0df3b1ddef3CAS |
Jacobsen RT, Lemmon EW, Penoncello SG, Shan Z, Wright NT (2003) Thermophysical properties of fluids and materials. In ‘Heat Transfer Handbook’. (Eds A Bejan, AD Kraus) pp. 43–159. (Wiley: Hoboken, NJ, USA)
Lautenberger C, Fernandez-Pello C (2009) Generalized pyrolysis model for combustible solids. Fire Safety Journal 44, 819–839.
| Generalized pyrolysis model for combustible solids.Crossref | GoogleScholarGoogle Scholar | 1:CAS:528:DC%2BD1MXotlOltL4%3D&md5=f7ef1b392bdd94fcf10271b3a8a5488fCAS |
Ohlemiller TJ (1985) Modeling of smoldering combustion propagation. Progress in Energy and Combustion Science 11, 277–310.
| Modeling of smoldering combustion propagation.Crossref | GoogleScholarGoogle Scholar | 1:CAS:528:DyaL28XhsFWrtbY%3D&md5=34ee5679b1bd5a9d9410cf88d6e87010CAS |
Page SE, Siegert F, Rieley JO, Boehm H V, Jayak A, Limink S (2002) The amount of carbon released from peat and forest fires in Indonesia during 1997. 1999, 61–65.
| The amount of carbon released from peat and forest fires in Indonesia during 1997.Crossref | GoogleScholarGoogle Scholar |
Page SE, Rieley JO, Banks CJ (2011) Global and regional importance of the tropical peatland carbon pool. Global Change Biology 17, 798–818.
| Global and regional importance of the tropical peatland carbon pool.Crossref | GoogleScholarGoogle Scholar |
Prat-Guitart N, Rein G, Hadden RM, Belcher CM, Yearsley JM (2016) Propagation probability and spread rates of self-sustained smouldering fires under controlled moisture content and bulk density conditions. International Journal of Wildland Fire 25, 456–465.
| Propagation probability and spread rates of self-sustained smouldering fires under controlled moisture content and bulk density conditions.Crossref | GoogleScholarGoogle Scholar |
Rein G (2013) Smouldering fires and natural fuels. In ‘Fire Phenomena in the Earth System’. (Ed. CM Belcher) pp. 15–34. (Wiley: New York, NY, USA)
Rein G (2016) Smoldering combustion. In ‘SFPE Handbook of Fire Protection Engineering’ (Eds MJ Hurley, DT Gottuk, JR Hall Jr, K Harada, ED Kuligowski, M Puchovsky, JL Torero, JM Watts Jr, CJ Wieczorek) pp. 581–603. (Springer: New York, NY, USA)
Rein G, Cleaver N, Ashton C, Pironi P, Torero JL (2008) The severity of smouldering peat fires and damage to the forest soil. Catena 74, 304–309.
| The severity of smouldering peat fires and damage to the forest soil.Crossref | GoogleScholarGoogle Scholar |
Restuccia F, Huang X, Rein G (2017) Self-ignition of natural fuels: can wildfires of carbon-rich soil start by self-heating? Fire Safety Journal 91, 828–834.
| Self-ignition of natural fuels: can wildfires of carbon-rich soil start by self-heating?Crossref | GoogleScholarGoogle Scholar | 1:CAS:528:DC%2BC2sXmtV2nsbc%3D&md5=e82d44751ce5a84b2445c0b95d000cfcCAS |
Turetsky MR, Benscoter B, Page S, Rein G, van der Werf GR, Watts A (2015) Global vulnerability of peatlands to fire and carbon loss. Nature Geoscience 8, 11–14.
| Global vulnerability of peatlands to fire and carbon loss.Crossref | GoogleScholarGoogle Scholar | 1:CAS:528:DC%2BC2cXitFKltbbE&md5=872387580a9a8fd350d841cdab010466CAS |
Usup A, Hashimoto Y, Takahashi H, Hayasaka H (2004) Combustion and thermal characteristics of peat fire in tropical peatland in Central Kalimantan, Indonesia. Tropics 14, 1–19.
| Combustion and thermal characteristics of peat fire in tropical peatland in Central Kalimantan, Indonesia.Crossref | GoogleScholarGoogle Scholar |
Watts AC (2012) Organic soil combustion in cypress swamps: moisture effects and landscape implications for carbon release. Forest Ecology and Management 294, 178–187.
| Organic soil combustion in cypress swamps: moisture effects and landscape implications for carbon release.Crossref | GoogleScholarGoogle Scholar |
Williams FA (1982) Urban and wildland fire phenomenology. Progress in Energy and Combustion Science 8, 317–354.
| Urban and wildland fire phenomenology.Crossref | GoogleScholarGoogle Scholar | 1:CAS:528:DyaL3sXptF2ltg%3D%3D&md5=001cc27da04466852b5de7e2e540962aCAS |
Yang J, Chen H, Liu N (2016) Modeling of two-dimensional natural downward smoldering of peat. Energy & Fuels 30, 8765–8775.
| Modeling of two-dimensional natural downward smoldering of peat.Crossref | GoogleScholarGoogle Scholar | 1:CAS:528:DC%2BC28XhsV2qtLrL&md5=04fbe72665fb6df7c569e59eb997d8deCAS |
Yu ZC (2012) Northern peatland carbon stocks and dynamics: a review. Biogeosciences 9, 4071–4085.
| Northern peatland carbon stocks and dynamics: a review.Crossref | GoogleScholarGoogle Scholar | 1:CAS:528:DC%2BC3sXit1Grs74%3D&md5=ca7ac9bf32e87ca94000d093de6c4adbCAS |
Zaccone C, Rein G, D’Orazio V, Hadden RM, Belcher CM, Miano TM (2014) Smouldering fire signatures in peat and their implications for palaeoenvironmental reconstructions. Geochimica et Cosmochimica Acta 137, 134–146.
| Smouldering fire signatures in peat and their implications for palaeoenvironmental reconstructions.Crossref | GoogleScholarGoogle Scholar | 1:CAS:528:DC%2BC2cXps12nsrs%3D&md5=b4eaa752a7b1b5fc7f9fd3adf01f7d42CAS |
A Moisture content (MC) is defined in dry basis as the mass of water divided by the mass of a dry soil sample, expressed as a percentage. Inorganic content (IC < 100%) is defined in dry basis as the mass of soil inorganic matter (minerals) divided by the mass of a completely dry soil sample, expressed as a percentage.
B From the aspect of combustion, the dry bulk density of peat or the density of organic matter is the fuel density.
C After the free surface regresses below the probing location, the solid temperature can no longer be recorded. Thus, an exponential decay function, fitted from the thermocouple measurement, is used to make the simulation curves continuous.