

Mapping Canadian wildland fire interface areas
Lynn M. Johnston A C and Mike D. Flannigan BA Natural Resources Canada, 1219 Queen Street E, Sault Ste Marie, ON, P6A 2E5, Canada.
B University of Alberta, 751 General Services Building, University of Alberta, Edmonton, AB T6G 2H1, Canada.
C Corresponding author. Email: lynn.johnston@canada.ca
International Journal of Wildland Fire 27(1) 1-14 https://doi.org/10.1071/WF16221
Submitted: 15 December 2016 Accepted: 7 November 2017 Published: 22 December 2017
Journal Compilation © CSIRO 2018 Open Access CC BY-NC-ND
Abstract
Destruction of human-built structures occurs in the ‘wildland–urban interface’ (WUI) – where homes or other burnable community structures meet with or are interspersed within wildland fuels. To mitigate WUI fires, basic information such as the location of interface areas is required, but such information is not available in Canada. Therefore, in this study, we produced the first national map of WUI in Canada. We also extended the WUI concept to address potentially vulnerable industrial structures and infrastructure that are not traditionally part of the WUI, resulting in two additional maps: a ‘wildland–industrial interface’ map (i.e. the interface of wildland fuels and industrial structures, denoted here as WUI-Ind) and a ‘wildland–infrastructure interface’ map (i.e. the interface of wildland fuels and infrastructure such as roads and railways, WUI-Inf). All three interface types (WUI, WUI-Ind, WUI-Inf) were defined as areas of wildland fuels within a variable-width buffer (maximum distance: 2400 m) from potentially vulnerable structures or infrastructure. Canada has 32.3 million ha of WUI (3.8% of total national land area), 10.5 million ha of WUI-Ind (1.2%) and 109.8 million ha of WUI-Inf (13.0%). The maps produced here provide a baseline for future research and have a wide variety of practical applications.
Additional keywords: communities, fuels, values, wildland–industrial interface, wildland–infrastructure interface, wildland–urban interface.
Introduction
Wildland fire is ubiquitous across Canada; every year, an average of over 7000 wildland fires burn more than 2 million ha (CIFFC 2013). Fire suppression activities are primarily carried out to protect human lives, communities and infrastructure, with expenditures in some years exceeding CAD$1 billion (Stocks and Martell 2016). Despite effective fire suppression in Canada (Cumming 2005; Martell and Sun 2008; Stocks and Flannigan 2013), it is not uncommon that human-built structures are damaged or destroyed by wildland fires (Pyne 2007; Beverly and Bothwell 2011; Flat Top Complex Wildfire Review Committee 2012). Wildland fires that threaten or destroy structures are referred to as ‘wildland–urban interface fires’, where the ‘wildland–urban interface’ (WUI) is known as the area where homes or other structures meet with or are dispersed within wildland vegetation (USDA and USDI 2001). The WUI can take many forms, and can range from a defined line of structures abutting wildland vegetation (generally referred to as ‘interface’ WUI) to scattered or isolated structures amongst the forest (‘intermix’ WUI) (USDA and USDI 2001). Having ‘urban’ in the name is somewhat misleading, as many areas that would not be considered an urban area (e.g. small towns, reserves and cottage communities) are actually WUI areas. ‘Urban’ can be thought as representing any human-built areas containing homes, seasonal homes, public buildings or commercial structures.
The WUI definition leaves out industrial structures (e.g. oil and gas facilities), despite the fact that these values can be destroyed by wildfire. Industrial values are important, not just for the potential loss of the structures, but also for the loss of revenue when industrial operations are shut down owing to wildland fires. For example, fires in 2011 and 2016 in Alberta, Canada, resulted in oil and gas operations shutting down, resulting in billions of dollars of lost revenue, and were deemed to have contributed to measurable drops in Canada’s national gross domestic product (Statistics Canada 2011; Flat Top Complex Wildfire Review Committee 2012; CBC News 2016; The Canadian Press 2016). These shutdowns can be caused by evacuations of workers, service shutdowns (e.g. power transmission or gas lines), or destruction of crucial equipment or structures.
Similarly, infrastructure values (e.g. roads, railways, or powerlines) are not included in the traditional WUI definition, but are important for a variety of reasons. For example, infrastructure can be any of the following: an escape route for civilians during a wildfire (i.e. roads), values in need of fire protection (e.g. bridges, power and communication lines, pipelines), strategic firefighting features (e.g. roads being used in burnout operations), or sources of wildfire ignitions (e.g. railways).
In the present paper, areas where industrial values meet with or are dispersed within wildland vegetation will be referred to as the ‘wildland–industrial interface’ (or ‘WUI-Ind’). Areas where infrastructure values meet with or are dispersed within wildland vegetation will be referred to as the ‘wildland–infrastructure interface’ (or ‘WUI-Inf’). The three interface types (i.e. WUI, WUI-Ind and WUI-Inf) could be discussed together as the ‘wildland–human interface’ (as suggested in Robinne et al. (2016)), or in more general terms, the ‘interface’.
Fires in the interface will likely become even more of an issue1 in the future for two main reasons: (1) increased fire activity due to climate change is predicted for most of Canada (Flannigan et al. 2009; Wang et al. 2015; Flannigan et al. 2016); and (2) there will likely be more interface area due to changes in human land use (e.g. urban and rural sprawl, development of new industrial facilities, and increasing secondary home or cottage development) (Radeloff et al. 2005; Bollman and Clemenson 2006; Peter et al. 2006; Theobald and Romme 2007). Fire suppression and mitigation may be able to restrain impacts on structures with increased interface area (Fox et al. 2015), but eventually the heightened demand on suppression (Podur and Wotton 2010), along with increased fire activity from the effects of climate change (Flannigan et al. 2009) will inevitably result in more destructive interface wildfire events. In order to predict, adapt to, or mitigate changes in the WUI, there must be an understanding of the current situation; specifically, the location and size of the interface must be known.
Unfortunately, in Canada there is no national map of where current interface areas are located or estimates of how much area the interface covers. Many studies done in other countries (United States primarily, but also France, Spain, Australia) have not only mapped the current area of WUI up to a national scale (Radeloff et al. 2005; Theobald and Romme 2007; Lampin-Maillet et al. 2010; Galiana-Martina et al. 2011; Herrero-Corral et al. 2012; Chas-Amil et al. 2013; Haas et al. 2013; Chuvieco et al. 2014; Price and Bradstock 2014; Thomas and Butry 2014), but have also mapped past changes in WUI (Hammer et al. 2007; Theobald and Romme 2007; Zhang et al. 2008; Bouillon et al. 2014; Fox et al. 2015) and predicted future WUI changes (Theobald and Romme 2007). In Canada, there are only two published studies mapping the WUI, and both were done at a municipal scale. Beverly et al. (2010) mapped the WUI for four communities in the province of Alberta, and Whitman et al. (2013) for two communities in the province of Nova Scotia. No studies mapping the WUI-Ind or WUI-Inf have been done in Canada or elsewhere in the world.
The primary objective of the present study is to develop national WUI, WUI-Ind and WUI-Inf maps for Canada. Based on these maps, general statistics will be provided for the country and also by province or territory. Spatial patterns in the interface will be examined, and the relationships between interface areas and fuels, structures, and past fires will be investigated. These maps will provide a baseline for future research (e.g. risk mapping and prediction of future interface areas) but also have a variety of practical applications, including fire management decision support and long-term planning, fire insurance, municipal planning and fire mitigation.
Methods
Structure data
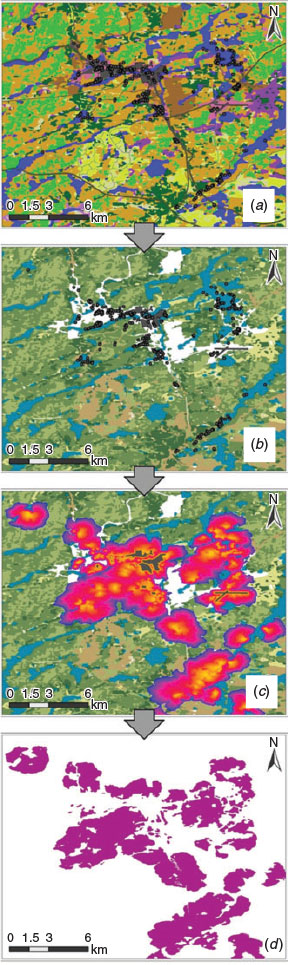
To produce the three national interface maps (WUI, WUI-Ind and WUI-Inf), data for both human-built structures2 and wildland fuels were required. We obtained structure information (Fig. 1a) from the freely available CanVec+ (Natural Resources Canada 2015a) dataset, which contains a wide variety of data compiled on a national scale. Structure information in the CanVec+ database is largely derived from the (now defunct) National Topographic Data Base (NTDB) with updates from a variety of remote sensing products. Structure locations were used to spatially map the interface areas. Unlike many other studies (e.g. Theobald and Romme 2007; Lampin-Maillet et al. 2010; Galiana-Martina et al. 2011), structure density definitions were not required because the actual structure locations were available, removing the need to resort to using spatially aggregated density data (e.g. census data). Having the actual structure locations permits a much more spatially precise estimation of the interface in Canada and also removes the necessity for a subjective interface definition based on structure density.
|
For each of the three interface types, we extracted the relevant structures based on the type of structure recorded in the CanVec+ dataset. For the WUI, we selected the following private, public, or commercial structures: places of interest (e.g. picnic sites, stadiums, zoos, campgrounds), railway stations and structures, airport runways, man-made hydrographic entities (e.g. docks, dams), and the majority of buildings and structures (e.g. city hall, residential areas, hospitals) (Fig. 1b). For the WUI-Ind, we selected the following industrial structures: oil and gas facilities, electric power and transformer stations, wind-operated devices, all industrial areas (e.g. lumber yards, mines), and all industrial buildings (e.g. oil and gas buildings, electric buildings, industrial chimneys, petroleum wells). For the WUI-Inf, the following infrastructure features were selected: pipelines, powerlines, roads, trails, bridges and transmission lines (telephone, other). A rasterised version (30-m resolution) of the three sets of structure data (one for each of the WUI, WUI-Ind and WUI-Inf) became the structure input to the interface calculations (Fig. 1c).
We initially considered an additional classification for roads owing to their unique characteristics with regards to fire risk and suppression. Roads can be values in need of protection from damage or to maintain escape routes, but they also affect suppression access and ignition potential, can act as a fuel break, and cause fragmentation of the landscape. Ultimately, roads were included as WUI-Inf to provide a simplistic national look at broad interface categories. However, in future analysis, roads will be investigated further, in particular their complex effects on fire risk (Lein and Stump 2009; Vilar et al. 2010; Gralewicz et al. 2012; Parisien et al. 2016).
Fuels data
We obtained data for wildland fuels from the Land Cover ~2000 (Natural Resources Canada 2015b) dataset (LC2000) (Fig. 1a). The LC2000 dataset is based on classified Landsat 5 and 7 images collected from 1996 to 2005 (majority from 1999 to 2001) and is compiled from three mapping initiatives (Land Cover for Agricultural regions of Canada, Northern Land Cover of Canada, and Earth Observation for Sustainable Development of Forests), with a 30-m resolution.
We then extracted all potentially burnable land-cover types from the LC2000 dataset: shrublands, grasslands, vegetated wetland, tundra, herb, and all types of forest. Non-fuel land-cover types were not included as fuels (i.e. croplands, true wetlands, pasture, sparse vegetation on rock, bare soil, developed land, exposed land, rock, snow or ice, barren, water), as were unknown land-cover types (cloud, shadow, unclassified and no data). To ensure consistent topology between the fuel data and the structures data, we removed small areas of non-fuel from the fuels layer using non-fuel polygon features from the CanVec+ dataset, including: buildings and structures, energy, hydrology, industrial and commercial, places of interest and transportation. This step removed a limited amount of area, with the majority of corrections from the hydrology features.
Using the fuels data extracted from the LC2000 dataset, we produced a fuel weight raster layer using two steps. The first step grouped the fuels (i.e. the land-cover types) into categories based on their relative maximum potential ‘hazard’ (i.e. their difficulty of suppression), as shown in Table 1. This ranking relied on potential fire behaviour and suppression difficulty based on the Canadian Fire Behaviour Prediction (FBP) System (Forestry Canada Fire Danger Group 1992) and is similar to what was used in mapping the WUI in the United States in Theobald and Romme (2007).
|
The second step of producing a fuel weight raster provided an assessment of horizontal fuel connectivity of all fuels across the national landscape. For this purpose, we used the aggregation index (AI) (He et al. 2000; Wang et al. 2014); this index has been employed in previous WUI mapping studies (Lampin-Maillet et al. 2010; Galiana-Martina et al. 2011; Herrero-Corral et al. 2012). This index provides a measure of the degree of the connectivity or aggregation of fuel dispersed within areas of non-fuel, and it also provides a proxy for the ease of fire spread across the landscape (Zhang et al. 2008; Lampin-Maillet et al. 2010).
We calculated the AI on a 5 × 5 raster cell (0.0002-decimal degree cells) moving window basis for the entire country. Raw AI values range from 0 (no aggregation; i.e. each cell is isolated) to 100 (complete aggregation; i.e. fuel is continuous), but we simplified and reclassified the values: AI > 90 was classified as ‘high aggregation’ and given a value of 0, 0 < AI ≤ 90 was ‘low’ and given a value of 1, and AI = 0 was ‘no aggregation’ and given a value of 2. For each raster cell, these AI values were added to the 1 to 5 ranks of the fuel land cover (categories as in Table 1), resulting in fuel weight categories from 1 to 7. For example, a raster cell with a conifer fuel type (rank of 1) and a ‘high’ AI (value of 0) results in a value of 1 for that cell’s fuel weight value. This weighted raster layer (Fig. 1b) with values 1 to 7, along with non-fuel and water features with a value of 10 (as in Theobald and Romme 2007), became the input for the interface calculation.
Interface calculation
In the present study, the interface is defined as the area of wildland fuels surrounding any potentially vulnerable structure, i.e. a fuels-focused, not a structure-focused definition is used, as discussed in Platt (2010). A fuels-focused definition ultimately produces a map of the burnable land area classified as interface, instead of identifying groups of structures in the interface. Calculating the area of interface was achieved by producing a variable-width buffer around the structures (similar to the methods of Theobald and Romme 2007; Fig. 1c), as opposed to using a static-width buffer that does not take into account the specific fuels surrounding a given structure. The width of the buffer was based on the 1 to 7 (and 10 for non-fuels) fuel weight raster values (i.e. the cover type fuel rank of 1 to 5, added to the AI value of 0 to 2) surrounding the structure, as a cost distance procedure. The buffer has a maximum width of 2400 m, which can be realised only under the most hazardous fuel conditions; e.g. a continuous conifer stand with a fuel weight value of 1 would have the full 2400-m buffer. Under less hazardous fuel conditions, the buffer value is decreased; e.g. a continuous mixedwood stand (fuel weight value of 2) would have twice the ‘cost’ in the cost distance procedure calculating the buffer distance, and thus would have a buffer width of 1200 m.
We chose the 2400-m maximum buffer distance for two reasons; the first is that this distance is frequently used in WUI mapping literature (Haight et al. 2004; Radeloff et al. 2005; Hammer et al. 2007; Stewart et al. 2007; Theobald and Romme 2007; Zhang et al. 2008; Platt 2010; Maranghides and Mell 2011; Bar-Massada et al. 2013; Thomas and Butry 2014) because it is the federally accepted standard in the United States said to represent the distance a firebrand can travel from a wildland fire and ignite a structure (USDA and USDI 2001; though rigorous investigation into refining this potential spotting distance and structure ignition is required). The second reason is that it is an appropriate match to the spatial scale and the management applications of the interface maps in the present study, including values protection, fire management planning and fuels treatments.
After we completed the buffering procedure, we removed the non-fuel areas (i.e. water and non-burnable areas) from the buffered areas; this layer forms the final interface layer, and indicates areas of interface as a Boolean value (Fig. 1d). We performed the interface calculation three times, once for each of the three interface types (WUI, WUI-Ind and WUI-Inf), thus producing three separate national interface maps.
Analysis
To provide some analysis of the interface maps, we performed some further processing. We first aggregated the raw interface, fuels and structures raster data into a grid of hexagonal cells, thus permitting density calculations and analysis of spatial patterns that would not be possible with the full-resolution raster data. Each hexagonal cell is ~1° by 1° (exact cell area is 3400 km2, which is ~1° by 1° at mid-latitudes of Canada). We calculated the density of each variable as the amount of area in the cell divided by the total land area in each cell (all non-water area within Canada’s borders was included as land area).
Despite having high-resolution structure locations from the CanVec+ dataset, the dataset does not necessarily define single structures. For example, a structure point or polygon could potentially represent a single-family dwelling, or a multistorey apartment complex. High-density housing and urban areas are just shown as large polygons. Therefore, in this study, no estimate of the number of homes or how much of the human population is living within interface areas can be directly produced. To address this limitation to some degree, we overlaid the WUI map with a layer of ‘Populated Places’ from the North American Atlas dataset (Natural Resources Canada 2010). This dataset provides point locations for cities, towns settlements, and reservations across Canada (and the rest of North America). The WUI-Ind and the WUI-Inf were not considered here because the Populated Places dataset reflects human populations in settlements, not the industrial structural locations or infrastructure with no population associated with it.
In order to provide some context for the spatial patterns of interface in Canada with respect to past fires, we obtained data on past fire locations, area burned and causes from the Canadian Forest Service Canadian National Fire Database (NFDB) (Canadian Forest Service 2014). The first fire-related analysis involved classification of every fire polygon in the database from 1980 to 2014 as an ‘interface fire’ or ‘not interface fire’. To be counted as an interface fire here, any part of the fire polygon must intersect with an interface area (WUI, WUI-Ind or WUI-Inf). These ‘interface fires’ were also further classified as lightning- or human-caused fires to investigate any differences by ignition cause. It should be noted that the interface areas were mapped using more current data than much of the NFDB fire dates, so it is possible that fires deemed ‘interface fires’ may not have actually been interface fires if the area of interface did not exist at the time of the fire. This analysis could be thought of as an indication of whether those fires would be ‘interface’ fires or not if they had happened at the present time.
For the second fire-related analysis, we used the same NFDB fire polygons to determine if there is a higher or lower proportion of area burned inside interface areas v. outside interface areas. We selected randomly sampled points across Canada, with the number of random samples proportional to 0.01% of land area. Using the randomly sampled points, we performed χ2 tests for equality of proportions for each province or territory (with α = 0.05 and n scaled down to 1500).
For the third fire-related analysis, we used the same hexagonal grid of the interface areas discussed at the beginning of the section, and then we also calculated the area burned and number of fires for each cell. We determined area burned by individually adding the area burned for each fire polygon (or partial polygon) from the NFDB 1980–2014 dataset within the hexagon. Overlapping fire polygons were permitted; therefore, it was possible for much more than 100% of a hexagon cell to have burned over the 1980–2014 time period. We determined the numbers of fires per hexagonal cell by using the NFDB points dataset (using just 1980–2014), which shows the location of recorded fires in Canada as a point feature. Within each cell, we counted the number of fire points to produce the number of fires per cell.
Results and discussion
National interface
Nationally, there are 116.5 million ha of wildland–human interface in Canada, covering 13.8% of the total land area of Canada (842 million ha) or 20.7% of the total wildland fuel area (562 million ha). Though these areas may not actually be at risk of wildfire, classifying these areas as ‘interface’ indicates they may have the potential to be at risk when a wildfire occurs, given appropriate conditions (e.g. weather, detailed fuel characteristics, topography, structural flammability). Interface areas delineated here are areas where intensive fire suppression and values protection activities would likely be crucial, and should be considered priority areas for risk assessments and fire mitigation activities (e.g. FireSmart,3 community preparedness plans, and fuel treatments).
National maps4 of the interface produced here show all three interface types together (i.e. the wildland–human interface; Fig. 2a), and then each type separately (Fig. 2b–d). Individually, the WUI in Canada covers 32.3 million ha (3.8% of land area, 5.8% of fuel area), WUI-Ind covers 10.5 million ha (1.3% of land area, 1.9% of fuel area), and WUI-Inf covers 109.8 million ha (13.0% of land area, 19.5% of fuel area) (Table 2). Note that the national areas for the three interface types do not sum to the national area for the wildland–human interface (116.5 million ha) owing to the overlap of the three layers. The WUI-Inf covers the largest area of the three interface types, largely because of the widespread road network.

|

|
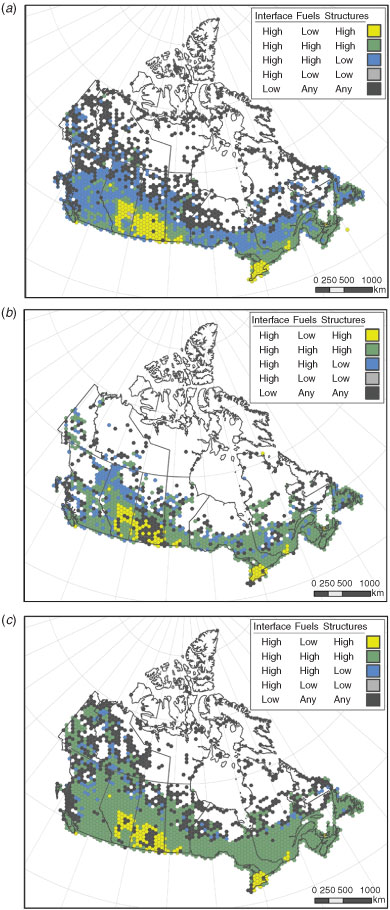
Fig. 3 shows categories of the density of WUI (Fig. 3a), WUI-Ind (Fig. 3b) and WUI-Inf (Fig. 3c) aggregated into a grid of hexagonal cells (as covered in the Methods section), which we then crossed with categories of both fuel and structure area. The classification that reflects the highest potential risk is ‘high’ densities of interface with ‘high’ fuel densities and ‘high’ structure densities (shown as green cells in Fig. 3). For the WUI and WUI-Ind, specific areas with the high/high/high classification include the border between the prairies and the boreal forest, and the majority of the southern portion of the country (with the exception of southern Ontario and the prairies, which have ‘low’ fuels). The WUI-Inf follows a similar pattern, but the high/high/high classification covers a much broader extent, in particular extending into more of the boreal forest.
|
Provincial and territorial interface
The majority of interface areas are located in the southern portions of the country, with very limited areas in the northern portions. The provinces with the largest interface areas are Quebec, Alberta, Ontario and British Columbia (Table 2). These four provinces are the main players in fire management, and are responsible for 80% of the fire management expenditures across the country (Stocks and Flannigan 2013). Three eastern provinces (Nova Scotia, Prince Edward Island and New Brunswick) have particularly high densities of interface (but not high total areas compared with other provinces), especially for WUI and WUI-Inf (Table 2). Wildfire in these three provinces is less frequent than in many other provinces (Stocks et al. 2002), but if a wildfire occurs in these three provinces, it is very likely to be an interface fire.
Interface and structures
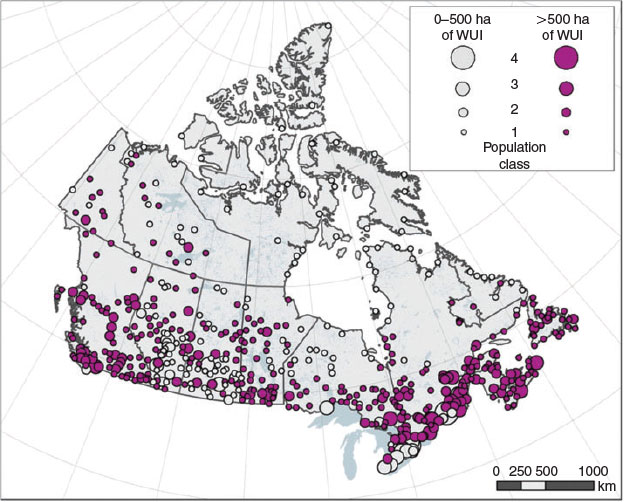
Of all Canadian ‘Populated Places’ (cities, towns, settlements and reservations), 521 of 544 locations (96%) had at least some WUI within a 5-km buffer. The majority (60%) of Populated Places also had more than 500 ha of WUI within a 5-km buffer (327 of the total 544); these locations are shown in purple in Fig. 4. Locations that have only small amounts of or no WUI area surrounding them are more common in the far north, the prairies and southern Ontario. As noted in the methods section, only the WUI was included because the Populated Places dataset reflects human populations in settlements, which is primarily characteristic of the WUI.
|
Interface and fires
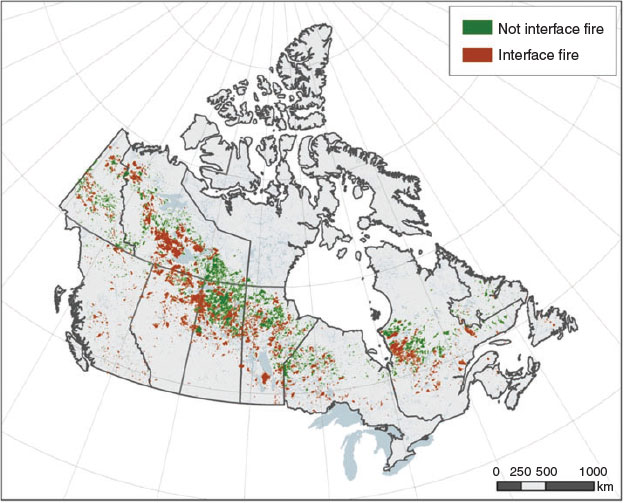
Fig. 5 displays all fire area burned polygons that are recorded in the NFDB from 1980 to 2014, and indicates each fire as an ‘interface fire’ (if it intersects an interface area) or ‘not interface fire’ (does not intersect an interface area). For all interface types together (i.e. the wildland–human interface), 40% of all NFDB fire polygons are considered to be an interface fire. Considering each interface type individually, the number of fire polygons that are interface fires is 17, 6 and 38% for the WUI, WUI-Ind and WUI-Inf respectively. Overall, these numbers indicate that fires within interface areas are fairly common. It should be noted, however, that the overall number of fires is underestimated because the NFDB polygons do not include all fires. Smaller fires in particular are underestimated and only data from provinces and territories and Parks Canada are included (leaving out municipal and undetected fires).
|
We performed the same intersection of interface areas with fire polygons, but separated out fires by cause (lightning- v. human-caused, leaving out the other causes in the database: unknown, restarts, prescribed burns). We found that lightning-caused fires saw much lower percentages of ‘interface fires’ than human-caused fires. Lightning-caused fires had 6, 3 and 25% of fires being classified as interface fires for WUI, WUI-Ind and WUI-Inf respectively. Human-caused fires had higher percentages, with 39, 12 and 65% for WUI, WUI-Ind and WUI-Inf respectively. This is unsurprising, as human-caused ignitions are more frequent near interface areas where humans are living and accessing them (Wotton et al. 2003; Gralewicz et al. 2012; Price and Bradstock 2014). This high percentage for human-caused interface fire would likely be even higher without effective fire suppression and landscape fragmentation typically found in interface areas (Gralewicz et al. 2012; Price and Bradstock 2014; Parisien et al. 2016). Lightning-caused fires, however, are not clustered around populated areas and can be difficult to access and suppress (Stocks et al. 2002; Podur et al. 2003), resulting in low suppression effectiveness (Arienti et al. 2006; Robinne et al. 2016). Lightning fires can grow to a greater extent in the less populated boreal forest where, in some cases, they may be permitted to burn freely if not threatening values (Stocks and Simard 1993; Stocks et al. 2002; Podur et al. 2003).
Randomly sampled points of the fire polygons and the interface rasters for each province or territory indicated that there is a lower proportion of area burned within interface areas as compared with outside interface areas. For WUI, the proportion of points sampled inside WUI areas that had been burned by fire is 2%, compared with 8% outside (i.e. 4.0 times lower within interface areas; χ2 for equality of proportions = 65, P value <0.0001). For WUI-Ind, the proportion of fire samples inside WUI-Ind areas is 4%, and 8% outside (i.e. 2.0 times lower within interface areas; χ2 = 28, P value <0.0001). WUI-Inf has a proportion of 6% inside and 9% outside (i.e. 1.5 times lower within interface areas; χ2 = 10, P value = 0.001). It is likely that early detection and fire suppression (in particular initial attack) are the main factors in this reduction of fire area within interface areas.
The same hexagonal ~1° grid as in Fig. 3 was used to look at the relationship between fires and interface areas (Fig. 6). The amount of interface area in each cell is shown in three categories (low, medium, high) and crossed with either the area burned in each cell (Fig. 6a, c, e) or the number of fires in each cell (Fig. 6b, d, f). For all three interface types, when crossed with area burned, the distribution of the higher categories (e.g. high/high, high/medium, medium/medium) is generally distributed to a more northern extent (Fig. 6a, c, e) when compared with the same maps using number of fires (Fig. 6b, d, f). For the maps using area burned (Fig. 6a, c, e), the majority of the boreal forest contains hexagons with higher categories. The prairies, southern Ontario and Quebec, the east coast provinces and the far north have very low or no area burned, resulting in a zero (shown in grey in Fig. 6) or low category for area burned by interface. A difference between north-west and north-east Ontario can also be seen, with higher categories for the majority of cells in north-western Ontario. For the maps using number of fires (Fig. 6b, d, f), in addition to a more southern distribution of the higher categories than is seen for the area burned maps, there are also areas of higher categories in southern Ontario and Quebec and the east coast provinces (except for Newfoundland). The prairies have slightly higher values than were found for the area burned maps, but still mostly one of the lower categories or no fire. As with the area burned maps, the number of fires maps all show the far north with the no-fire category.

|
Combining the interface maps here with the fire parameters begins to address the element of fire risk; where there is little fire, there is low fire risk. However, more data are required to get estimates of the total potential impacts and the likelihood of destruction in order to fully quantify risk (Fried et al. 1999; Lein and Stump 2009; Haas et al. 2013; Chuvieco et al. 2014).
Results comparison
Direct comparison of the main results of the present study (i.e. the amount of interface area across Canada) with other studies cannot be performed for two reasons: (1) most studies were performed in other areas of the world, and (2) the methods and input data used vary between studies. Methods vary broadly, from the definition of the interface to the selection of structures and fuels to include, and the use and treatment of a buffer. Scale and resolution vary between studies as well, as do the input data. Even studies performed using the same input data and the same general interface definitions can end up with disparate interface maps (Stewart et al. 2009; Platt 2010; Bar-Massada et al. 2013; Bouillon et al. 2014). However, to provide some reference for comparison, we will compare the overall results of the national WUI area with other national studies. Only WUI will be discussed because there are no other studies that investigate the WUI-Ind or the WUI-Inf.
Most studies that calculated the area of the WUI were done in the United States, with six studies producing a national estimate for the conterminous United States. From these studies, the total WUI area ranges from 46.6 to 84.8 million ha (covering ~5 to 11% of land area). Specifically, the area of the conterminous United States that was defined as WUI for each study was: 71.9 million ha (9% of land area) (Radeloff et al. 2005), 46.6 million ha (6%) (Theobald and Romme 2007), 84.8 million ha (11%) (Haas et al. 2013) and 71.9 million ha (9%) (Thomas and Butry 2014). In contrast, in the present study, we found there is 32.3 million ha of WUI in Canada, covering 3.8% of the land area. Disregarding differences in methodology, it appears WUI in Canada does cover a smaller area and proportion of the country compared with WUI in the United States.
Modugno et al. (2016) studied WUI in European countries. Total areas of WUI were not provided, but percentages of each country covered by WUI ranged from 0.1 to 17.4%, with an average of 3.5% (standard deviation 3.6%). Putting aside differing methods between the Modugno et al. (2016) study and the current study, Canada has a similar percentage of land mapped as WUI (3.8%).
Applications
There are a wide variety of potential wildfire-related applications of the data produced in this study. Planning wildfire mitigation activities could benefit from having this interface data, including targeting which districts should receive FireSmart or fuel treatment funding, developing or altering municipal wildfire bylaws, industrial wildfire mitigation regulations, or infrastructure fire mitigation initiatives. Further long-term planning applications include applications within city planning, fire management planning, evacuation planning, and wildfire insurance. Additionally, a variety of wildfire decision-support activities may benefit from these data, including resource prepositioning, values protection, fire prioritisation, setting alerts for interface fires, and risk modelling.
Limitations
Any further research or applied uses of these data must use them at the appropriate scale (i.e. not at a fine scale such as neighbourhood or structure scale). Users of these interface data should also recall that the interface areas do not indicate fire risk (where risk is defined as vulnerability multiplied by potential exposure). Additionally, the interface maps are not guaranteed to be complete or without errors; out-of-date input data (e.g. where new developments have been built, or where fuels have undergone recent disturbance) or errors in the input data result in incomplete or inaccurate interface maps. Furthermore, only structural and infrastructure values that have the potential to be vulnerable to wildland fire were included, thus leaving out non-structural values such as: aesthetic, ecological, economic (including recreational loses and timber losses) and cultural values. It should also be noted that these maps have been defined with wildfire-focused parameters, and as such, may not be entirely appropriate for applications related to other human natural issues, such as: biodiversity impacts, forestry, wildlife management, land-cover conversion and habitat fragmentation (as discussed in Radeloff et al. (2005) and Bar-Massada et al. (2014)).
Future research
The maps produced in this study provide a first look at Canadian interface areas that will be used for further research, including interface risk mapping and change detection or future prediction of interface areas. The current maps also may be updated with new fuels or values information as they become available, and refinements of the interface areas can be made through the addition of a variety of elements such as detailed fuel loads, seasonal fire hazard, or structure vulnerability.
Conclusion
In this study, we provide the first national maps of interface areas for Canada. We defined the interface areas as the wildland fuel areas that are within a fuel-dependent buffer of a maximum distance of 2400 m to a potentially vulnerable value. Overall, large areas of Canada are mapped as interface (116.5 million ha). Looking at just what is generally considered the traditional WUI (focusing on homes and community or commercial buildings), Canada has 32.3 million ha of WUI. Expanding the WUI concept to focus on just industrial structures showed that there is 10.5 million ha of WUI-Ind, and focusing on infrastructure (e.g. roads, railways and powerlines) showed that there is 109.8 million ha of WUI-Inf. Much of the areas of the three interface ‘types’ overlap, and they are found in every province and territory in Canada. Further research is required to improve on the existing maps (e.g. improved and updated fuels information), and to include structure vulnerability and eventually a comprehensive risk model within interface areas.
Conflicts of interest
The authors declare that they have no conflicts of interest.
Acknowledgements
The authors would like to thank Tara McGee, Kelsy Gibos, Jennifer Beverly, Xianli Wang and Karen Blouin for helpful feedback on this project. Xianli Wang and Francois Robinne provided technical advice and support. The Canadian Forest Service, the University of Alberta and the Western Partnership for Wildland Fire Science supported this research.
References
Arienti MC, Cumming SG, Boutin S (2006) Empirical models of forest fire initial attack success probabilities: the effects of fuels, anthropogenic linear features, fire weather, and management. Canadian Journal of Forest Research 36, 3155–3166.| Empirical models of forest fire initial attack success probabilities: the effects of fuels, anthropogenic linear features, fire weather, and management.Crossref | GoogleScholarGoogle Scholar |
Bar-Massada A, Stewart SI, Hammer RB, Mockrin MH, Radeloff VC (2013) Using structure locations as a basis for mapping the wildland urban interface. Journal of Environmental Management 128, 540–547.
| Using structure locations as a basis for mapping the wildland urban interface.Crossref | GoogleScholarGoogle Scholar |
Bar-Massada A, Radeloff VC, Stewart SI (2014) Biotic and abiotic effects of human settlements in the wildland–urban interface. Bioscience 64, 429–437.
| Biotic and abiotic effects of human settlements in the wildland–urban interface.Crossref | GoogleScholarGoogle Scholar |
Beverly JL, Bothwell P (2011) Wildfire evacuations in Canada 1980–2007. Natural Hazards 59, 571–596.
| Wildfire evacuations in Canada 1980–2007.Crossref | GoogleScholarGoogle Scholar |
Beverly JL, Bothwell P, Conner JCR, Herd EPK (2010) Assessing the exposure of the built environment to potential ignition sources generated from vegetative fuel. International Journal of Wildland Fire 19, 299–313.
| Assessing the exposure of the built environment to potential ignition sources generated from vegetative fuel.Crossref | GoogleScholarGoogle Scholar |
Bollman RD, Clemenson HA (2006) Structure and change in Canada’s rural demography: an update to 2006 with provincial detail. (Statistics Canada: Ottawa, ON). Available at http://www.statcan.gc.ca/pub/21-006-x/21-006-x2007007-eng.htm [Accessed 1 June 2016]
Bouillon C, Fernandez Ramiro M, Sirca C, Fierro Garcia B, Casula F, Vila B, Long Fournel M, Pellizzaro G, Arca B, Tedim F (2014) A tool for mapping rural–urban interfaces on different scales. In ‘Advances in forest fire research. Chapter 3: Fire management’. (Ed. DX Viegas) pp. 611–625. (Imprensa da Universidade de Coimbra: Coimbra, Portugal)
Canadian Forest Service (2014) Canadian National Fire Database – Agency fire data. Dataset. (Natural Resources Canada, Canadian Forest Service, Northern Forestry Centre: Edmonton, AB) Available at http://cwfis.cfs.nrcan.gc.ca/ha/nfdb [Verified 5 December 2017]
CBC News (2016) Canada’s GDP shrank by 0.6% in May, worst month in more than 7 years. CBC News, Business. 29 July 2016. Available at http://www.cbc.ca/news/business/gdp-may-fire-economy-1.3693968 [Accessed 5 December 2016]
Chas-Amil M, Touza J, Garcia-Martinez E (2013) Forest fires in the wildland–urban interface: a spatial analysis of forest fragmentation and human impacts. Applied Geography 43, 127–137.
| Forest fires in the wildland–urban interface: a spatial analysis of forest fragmentation and human impacts.Crossref | GoogleScholarGoogle Scholar |
Chuvieco E, Aguado I, Jurdao S, Pettinari ML, Yebra M, Salas J, Hantson S, De La Riva J, Ibarra P, Rodrigues M, Echeverria M, Azqueta D, Roman MV, Bastarrika A, Martinez S, Recondo C, Zapico E, Martinez-Vega FJ (2014) Integrating geospatial information into fire risk assessment. International Journal of Wildland Fire 23, 606–619.
| Integrating geospatial information into fire risk assessment.Crossref | GoogleScholarGoogle Scholar |
CIFFC (2013) CIFFC Canada Report 2013. Canadian Interagency Forest Fire Centre Inc. Available at http://www.ciffc.ca/images/stories/pdf/2013_canada_report.pdf [Accessed 17 July 2015]
Cumming SG (2005) Effective fire suppression in boreal forests. Canadian Journal of Forest Research 35, 772–786.
| Effective fire suppression in boreal forests.Crossref | GoogleScholarGoogle Scholar |
Flannigan M, Wotton B, Marshall G, de Groot W, Johnston J, Jurko N, Cantin A (2016) Fuel moisture sensitivity to temperature and precipitation: climate change implications. Climatic Change 134, 59–71.
| Fuel moisture sensitivity to temperature and precipitation: climate change implications.Crossref | GoogleScholarGoogle Scholar | 1:CAS:528:DC%2BC2MXhs1eiu7zN&md5=e8c3dc6bf31e871508dd6b92aee2e906CAS |
Flannigan MD, Krawchuk MA, de Groot WJ, Wotton BM, Gowman LM (2009) Implications of changing climate for global wildland fire. International Journal of Wildland Fire 18, 483–507.
| Implications of changing climate for global wildland fire.Crossref | GoogleScholarGoogle Scholar |
Flat Top Complex Wildfire Review Committee (2012) Flat Top Complex. (Sustainable Resource Development: AB, Canada) Available at https://wildfire.alberta.ca/resources/reviews/documents/FlatTopComplex-WildfireReviewCommittee-A-May18-2012.pdf [Accessed 5 December 2017]
Forestry Canada Fire Danger Group (1992) Development and structure of the Canadian Forest Fire Behaviour Prediction System. Forestry Canada, Information Report ST-X-3. (Ottawa, ON). Available at http://cfs.nrcan.gc.ca/pubwarehouse/pdfs/10068.pdf [Accessed 4 July 2016]
Fox D, Martin N, Carrega P, Andrieu J, Adnès C, Emsellem K, Ganga O, Moebius F, Tortorollo N, Fox E (2015) Increases in fire risk due to warmer summer temperatures and wildland urban interface changes do not necessarily lead to more fires. Applied Geography 56, 1–12.
| Increases in fire risk due to warmer summer temperatures and wildland urban interface changes do not necessarily lead to more fires.Crossref | GoogleScholarGoogle Scholar |
Fried JS, Winter GJ, Gilless JK (1999) Assessing the benefits of reducing fire risk in the wildland–urban interface: a contingent valuation approach. International Journal of Wildland Fire 9, 9–20.
| Assessing the benefits of reducing fire risk in the wildland–urban interface: a contingent valuation approach.Crossref | GoogleScholarGoogle Scholar |
Galiana-Martin L, Herrero G, Solana J (2011) A wildland–urban interface typology for forest fire risk management in Mediterranean areas. Landscape Research 36, 151–171.
| A wildland–urban interface typology for forest fire risk management in Mediterranean areas.Crossref | GoogleScholarGoogle Scholar |
Gralewicz NJ, Nelson TA, Wulder MA (2012) Factors influencing national scale wildfire susceptibility in Canada. Forest Ecology and Management 265, 20–29.
| Factors influencing national scale wildfire susceptibility in Canada.Crossref | GoogleScholarGoogle Scholar |
Haas JR, Calkin DE, Thompson MP (2013) A national approach for integrating wildfire simulation modeling into wildland–urban interface risk assessments within the United States. Landscape and Urban Planning 119, 44–53.
| A national approach for integrating wildfire simulation modeling into wildland–urban interface risk assessments within the United States.Crossref | GoogleScholarGoogle Scholar |
Haight RG, Cleland DT, Hammer RB, Radeloff VB, Rupp TS (2004) Assessing fire risk in the wildland–urban interface. Journal of Forestry 102, 41–48.
Hammer RB, Radeloff VC, Fried JS, Stewart SI (2007) Wildland–urban interface housing growth during the 1990s in California, Oregon, and Washington. International Journal of Wildland Fire 16, 255–265.
| Wildland–urban interface housing growth during the 1990s in California, Oregon, and Washington.Crossref | GoogleScholarGoogle Scholar |
He HS, DeZonia BE, Mladenoff DJ (2000) An aggregation index (AI) to quantify spatial patterns of landscapes. Landscape Ecology 15, 591–601.
| An aggregation index (AI) to quantify spatial patterns of landscapes.Crossref | GoogleScholarGoogle Scholar |
Herrero-Corral G, Jappiot M, Bouillon C, Long-Fournel M (2012) Application of a geographical assessment method for the characterization of wildland–urban interfaces in the context of wildfire prevention: a case study in western Madrid. Applied Geography 35, 60–70.
| Application of a geographical assessment method for the characterization of wildland–urban interfaces in the context of wildfire prevention: a case study in western Madrid.Crossref | GoogleScholarGoogle Scholar |
Lampin-Maillet C, Jappiot M, Long M, Bouillon C, Morge D, Ferrier J-P (2010) Mapping wildland–urban interfaces at large scales integrating housing density and vegetation aggregation for fire prevention in the south of France. Journal of Environmental Management 91, 732–741.
| Mapping wildland–urban interfaces at large scales integrating housing density and vegetation aggregation for fire prevention in the south of France.Crossref | GoogleScholarGoogle Scholar |
Lein JK, Stump NI (2009) Assessing wildfire potential within the wildland–urban interface: a south-eastern Ohio example. Applied Geography 29, 21–34.
| Assessing wildfire potential within the wildland–urban interface: a south-eastern Ohio example.Crossref | GoogleScholarGoogle Scholar |
Maranghides A, Mell W (2011) A case study of a community affected by the Witch and Guejito wildland fires. Fire Technology 47, 379–420.
| A case study of a community affected by the Witch and Guejito wildland fires.Crossref | GoogleScholarGoogle Scholar |
Martell DL, Sun H (2008) The impact of fire suppression, vegetation, and weather on the area burned by lightning-caused forest fires in Ontario. Canadian Journal of Forest Research 38, 1547–1563.
| The impact of fire suppression, vegetation, and weather on the area burned by lightning-caused forest fires in Ontario.Crossref | GoogleScholarGoogle Scholar |
Modugno S, Balzter H, Cole B, Borrelli P (2016) Mapping regional patterns of large forest fires in wildland–urban interface areas in Europe. Journal of Environmental Management 172, 112–126.
| Mapping regional patterns of large forest fires in wildland–urban interface areas in Europe.Crossref | GoogleScholarGoogle Scholar |
Natural Resources Canada (2010) North American Atlas – Populated Places. Dataset. (NRC Government of Canada, Mapping Information Branch, The Atlas of Canada). Available at http://geogratis.cgdi.gc.ca/download/frameworkdata/North_America_Atlas10M/popplaces/ [Verified 5 December 2017]
Natural Resources Canada (2015a) CanVec+. Dataset. Used under the Open Government Licence – Canada. (EaSS GeoGratis Client Services. Natural Resources Canada, Canada Centre for Mapping and Earth Observation). Available at ftp://ftp.geogratis.gc.ca/pub/nrcan_rncan/vector/canvec/archive/canvec+_archive_20151029/doc/CanVec+_en_release_notes.pdf [Verified 5 December 2017]
Natural Resources Canada (2015b) Land Cover, circa 2000 – vector. Dataset. Used under the Open Government Licence – Canada. (EaSS GeoGratis Client Services, Natural Resources Canada, Canada Centre for Mapping and Earth Observation). Available at www.GeoGratis.gc.ca [Verified 5 December 2017]
Parisien M-A, Miller C, Parks SA, DeLancey ER, Robinne F-N, Flannigan MD (2016) The spatially varying influence of humans on fire probability in North America. Environmental Research Letters 11, 075005
| The spatially varying influence of humans on fire probability in North America.Crossref | GoogleScholarGoogle Scholar |
Peter B, Wang S, Mogus T, Wilson B (2006) Fire risk and population trends in Canada’s wildland–urban interface. In ‘Canadian wildland fire strategy: background synthesis, analysis, and perspectives’. (Eds KG Hirsch, P Fuglem) pp. 37–48. (Canadian Council of Forest Ministers: Edmonton, AB, Canada)
Platt RV (2010) The wildland–urban interface: evaluating the definition effect. Journal of Forestry 108, 9–15.
Podur J, Wotton M (2010) Will climate change overwhelm fire management capacity? Ecological Modelling 221, 1301–1309.
| Will climate change overwhelm fire management capacity?Crossref | GoogleScholarGoogle Scholar |
Podur JJ, Martell DL, Csillag F (2003) Spatial patterns of lightning-caused forest fires in Ontario, 1976–1998. Ecological Modelling 164, 1–20.
| Spatial patterns of lightning-caused forest fires in Ontario, 1976–1998.Crossref | GoogleScholarGoogle Scholar |
Price O, Bradstock R (2014) Countervailing effects of urbanization and vegetation extent on fire frequency on the wildland–urban interface: disentangling fuel and ignition effects. Landscape and Urban Planning 130, 81–88.
| Countervailing effects of urbanization and vegetation extent on fire frequency on the wildland–urban interface: disentangling fuel and ignition effects.Crossref | GoogleScholarGoogle Scholar |
Pyne SJ (2007) ‘Awful splendour: a history of fire in Canada.’ (University of British Columbia Press: Vancouver, BC, Canada)
Radeloff VC, Hammer RB, Stewart SI, Fried JS, Holcomb SS, McKeefry JF (2005) The wildland–urban interface in the United States. Ecological Applications 15, 799–805.
| The wildland–urban interface in the United States.Crossref | GoogleScholarGoogle Scholar |
Robinne F-N, Parisien M-A, Flannigan M (2016) Anthropogenic influence on wildfire activity in Alberta, Canada. International Journal of Wildland Fire 25, 1131–1143.
| Anthropogenic influence on wildfire activity in Alberta, Canada.Crossref | GoogleScholarGoogle Scholar | 1:CAS:528:DC%2BC28XhslOhsrvF&md5=27e61d1646fb7eaf5e0f785addf8334fCAS |
Statistics Canada (2011) ‘Wednesday, August 31, 2011. Canadian economic accounts. The Daily.’ Available at www.statcan.gc.ca/daily-quotidien/110831/dq110831a-eng.htm [Accessed 30 May 2016]
Stewart SI, Radeloff VC, Hammer RB, Hawbaker TJ (2007) Defining the wildland–urban interface. Journal of Forestry 105, 201–207.
Stewart SI, Wilmer B, Hammer RB, Aplet GH, Hawbaker TJ, Miller C, Radeloff VC (2009) Wildland–urban interface maps vary with purpose and context. Journal of Forestry 107, 78–83.
Stocks BJ, Flannigan M (2013) Current fire regimes, impacts and the likely changes – I: Past, current and future boreal fire activity in Canada. In ‘Vegetation fires and global change: challenges for concerted international action. A White Paper directed to the United Nations and International Organizations’. (Ed. JG Goldammer) Ch. 4, pp. 39–50. (Kessel Publishing House: Remagen-Oberwinter, Germany)
Stocks BJ, Martell DL (2016) Forest fire management expenditures in Canada: 1970–2013. Forestry Chronicle 92, 298–306.
| Forest fire management expenditures in Canada: 1970–2013.Crossref | GoogleScholarGoogle Scholar |
Stocks BJ, Simard AJ (1993) Forest fire management in Canada. Disaster Management 5, 21–27.
Stocks BJ, Mason JA, Todd JB, Bosch EM, Wotton BM, Amiro BD, Flannigan MD, Hirsch KG, Logan KA, Martell DL, Skinner WR (2002) Large forest fires in Canada, 1959–1997 Journal of Geophysical Research 107, FFR 5-1–FFR 5-12.
| Large forest fires in Canada, 1959–1997Crossref | GoogleScholarGoogle Scholar |
The Canadian Press (2016) Wildfire loss to oilsands at least 30 million barrels worth $1.4 billion. CBC News Business. 15 June 2016. Available at http://www.cbc.ca/news/business/wildfire-loss-to-oilsands-at-least-30-million-barrels-worth-1-4-billion-1.3636716 [Accessed 5 December 2016]
Theobald DM, Romme WH (2007) Expansion of the US wildland–urban interface. Landscape and Urban Planning 83, 340–354.
| Expansion of the US wildland–urban interface.Crossref | GoogleScholarGoogle Scholar |
Thomas DS, Butry DT (2014) Areas of the US wildland–urban interface threatened by wildfire during the 2001–2010 decade. Natural Hazards 71, 1561–1585.
| Areas of the US wildland–urban interface threatened by wildfire during the 2001–2010 decade.Crossref | GoogleScholarGoogle Scholar |
USDA and USDI (2001) Notices. Federal Register. pp. 751–777. (United States Government) Available at https://www.federalregister.gov/articles/2001/01/04/01-52/urban-wildland-interface-communities-within-the-vicinity-of-federal-lands-that-are-at-high-risk-from [Accessed 4 July 2016]
Vilar L, Woolford DG, Martell DL, Martin MP (2010) A model for predicting human-caused wildfire occurrence in the region of Madrid, Spain. International Journal of Wildland Fire 19, 325–337.
| A model for predicting human-caused wildfire occurrence in the region of Madrid, Spain.Crossref | GoogleScholarGoogle Scholar |
Wang X, Blanchet FG, Koper N (2014) Measuring habitat fragmentation: an evaluation of landscape pattern metrics. Methods in Ecology and Evolution 5, 634–646.
| Measuring habitat fragmentation: an evaluation of landscape pattern metrics.Crossref | GoogleScholarGoogle Scholar |
Wang X, Thompson DK, Marshall GA, Tymstra C, Carr R, Flannigan MD (2015) Increasing frequency of extreme fire weather in Canada with climate change. Climatic Change 130, 573–586.
| Increasing frequency of extreme fire weather in Canada with climate change.Crossref | GoogleScholarGoogle Scholar |
Whitman E, Rapaport E, Sherren K (2013) Modeling fire susceptibility to delineate wildland–urban interface for municipal-scale fire risk management. Environmental Management 52, 1427–1439.
| Modeling fire susceptibility to delineate wildland–urban interface for municipal-scale fire risk management.Crossref | GoogleScholarGoogle Scholar |
Wotton BM, Martell DL, Logan KA (2003) Climate change and people-caused forest fire occurrence in Ontario. Climatic Change 60, 275–295.
| Climate change and people-caused forest fire occurrence in Ontario.Crossref | GoogleScholarGoogle Scholar | 1:CAS:528:DC%2BD3sXnvVOrs78%3D&md5=654bcf84d12e9f76983dad0b0e09fa9bCAS |
Zhang Y, He HS, Yang J (2008) The wildland–urban interface dynamics in the south-eastern US from 1990 to 2000. Landscape and Urban Planning 85, 155–162.
| The wildland–urban interface dynamics in the south-eastern US from 1990 to 2000.Crossref | GoogleScholarGoogle Scholar |
1 The complex and interconnected effects of climate change and also of human development may result in decreases in fire activity in some areas. For example, decreased risk in the interface may be seen in conditions where climate becomes wetter (thus decreasing fire activity), environmental conditions result in less fuel (resulting in a fuel-limited situation), with increased fire management or mitigation, or where large amounts of available fuel are displaced by dense human development.
2 ‘Structures’ here refer to traditional human-built structures but also infrastructure values that may not necessarily be structures (e.g. roads, powerlines, railways) but for simplicity are referred to here as structures.
3 FireSmart is primarily a community wildfire mitigation and awareness campaign, similar to Firewise in the United States; it includes a series of guidelines to mitigate fire in the interface and reduce structure vulnerability to fire.
4 The full-resolution interface maps cannot be reproduced here, but are available by request.