

Recent estimates of the out-of-pocket expenditure on health care in Australia
Farhat Yusuf A B C and Stephen Leeder AA Menzies Centre for Health Policy, Sydney School of Public Health, Faculty of Medicine and Health, Charles Perkins Centre D17, The University of Sydney, NSW 2006, Australia.
B Department of Management, Macquarie Business School, Macquarie University, NSW 2109, Australia.
C Corresponding author. Email: farhat.yusuf@sydney.edu.au
Australian Health Review 44(3) 340-346 https://doi.org/10.1071/AH18191
Submitted: 21 September 2018 Accepted: 29 April 2019 Published: 13 September 2019
Journal Compilation © AHHA 2020 Open Access CC BY-NC-ND
Abstract
Objective The aims of this study were to estimate the average annual out-of-pocket (OOP) expenditure on health care by households in Australia in 2015–16, and to compare this with the estimate for 2009–10.
Methods Data from the most recent Household Expenditure Survey (HES) conducted by the Australian Bureau of Statistics were used. Various statistical methods were used to estimate the annual OOP expenditures at the household and national levels.
Results The average annual OOP expenditure was A$4290 per household, representing 5.8% of the amount spent on all goods and services. Private health insurance (PHI) premiums, although not a direct expenditure on health care, were 40.6% of the total OOP expenses. Of the remaining 59.4%, nearly half was spent on doctors and other health professionals, and approximately one-third was spent on medicines. Dental treatments and specialist consultations were the most expensive, whereas visits to general practitioners incurred the least OOP expenditure. Households with PHI (58.6%) spent fourfold more on health care than those not insured. Compared with the 2009–10 survey, the biggest increases were in the cost of PHI (50.7%) and copayments to specialists (34.8%) and other health professionals (42.0%).
Conclusions OOP expenditure on health care as a proportion of the total household expenditure on all goods and services has increased by more than 25% between 2009–10 and 2015–16.
What is known about the topic? Australian households incur OOP expenses for health care in Australia for a wide range of goods and services, such as copayments to doctors and other health professionals beyond the Medicare rebates, the cost of medicines and other pharmaceutical goods not covered entirely by the Pharmaceutical Benefits Scheme and PHI premiums. Although other estimates of OOP expenditure are available in official reports of the Australian Institute of Health and Welfare, they are based on administrative records rather than consumer reports, and cannot be disaggregated by item or the characteristics of households.
What does this paper add? This paper provides detailed information on OOP expenditure on health care as reported by a probability sample of households interviewed for the HES conducted by the ABS during 2015–16. These estimates of OOP expenditure, based on consumer reports, add a further dimension to the information available from administrative records only.
What are the implications for practitioners? Practitioners should take account of the effect of increasing copayments for their services, especially on patients belonging to the lower socioeconomic categories. Increasing copayments may lead to people foregoing medical care. Health planners and politicians should note the steady upward drift in OOP expenses and factor these into their policies for future funding of health care.
Additional keywords: copayments, medical care and health, private health insurance.
Introduction
In economically advanced nations, public funds are commonly used to support health care, either through insurance, such as Australia’s Medicare,1 or by direct subvention, as in the national health services of Britain2 and Canada.3
In Australia, the cost of health care is rising faster than inflation. According to the Australian Institute of Health and Welfare (AIHW), the real or constant value cost of health care, after adjusting for inflation, increased threefold, from A$50.3 billion to A$154.6 billion, over the 25-year period from 1989–90 to 2013–14.4
Multiple approaches have been adopted to improve the efficiency of health care and to limit outlays. Efforts have been made to control demand for medical care and to alleviate pressure on the public purse by expecting that patients pay from their own resources a portion of the cost of care at the time they receive that care. These expectations are usually modified to accommodate the limited capacity to pay of infirm, older and severely economically disadvantaged citizens.
In Australia, the OOP component of the healthcare expenses has generally been estimated using administrative records. For example, the AIHW estimated that over the 6 years from 2009–10 to 2015–16 the contribution of ‘individuals’ to the national healthcare budget increased from A$20.8 billion to A$29.4 billion, an increase of 41.3%.5
Many studies of healthcare expenditure in Australia have analysed aggregated data.6–8 Other studies were based on information pertaining to, for example, the cost of chronic illness and disability,9 stroke,10 obstructive pulmonary disease11 or copayments incurred for particular specialist services.12,13
The Household Expenditure Survey (HES) conducted periodically by the Australian Bureau of Statistics (ABS) since 1984 provides detailed data on all household expenditure items including the OOP expenditure on health care. So far, data from the 2003–04 and 2009–10 surveys have been analysed and published.14–16
In this paper we present the findings of our analysis pertaining to the OOP expenditure on health care using the information collected in the 2015–16 HES and compare this expenditure with that based on the HES conducted in 2009–10.15,16
Methods
The ABS selected survey dwellings using a stratified multistage cluster design from the private dwelling framework of the ABS Population Survey Master Sample. Selections were distributed across a 12-month enumeration period so that the survey results were representative of income and expenditure patterns across the year. The sample was representative of the majority of the population of Australia. Those excluded were inhabitants of very remote areas, residents of non-private dwellings, such as hotels, boarding schools, boarding houses and nursing homes, and foreign diplomats and the armed forces stationed in Australia.
Experienced ABS interviewers were comprehensively trained and given detailed written instructions to complement the survey documents. Within each household, a person was defined as the ‘reference person’. This person was chosen using criteria such as being a partner in a registered or de facto marriage, or a lone parent with one or more dependent children, or the person with highest income, or the most senior person in the household. Data on household characteristics, housing costs, assets and liabilities and items of expenditure common to all household members were obtained from the reference person. The ABS provided diaries to each member of the household aged ≥15 years to record information on their expenses over two 1-week periods.
We were provided with deidentified records for each of the 10 046 households in the sample through an arrangement between the ABS and the University of Sydney. These records included the characteristics of households and the average weekly expenditure on various goods and services purchased by the household members. These estimates of weekly household expenditure did not refer to any particular week; they were derived by the ABS for each expenditure item by dividing the reported expenditure for all members of the household on that item by the number of weeks in the relevant recall or reference period. For healthcare expenditure, the recall periods were 12 months for private health insurance (PHI), 3 months for health practitioners’ fees and hospital charges and 2 weeks for medicines bought under the Pharmaceutical Benefits Scheme (PBS), non-prescription drugs and other pharmaceutical products. The ABS provided a weighting factor for each of the sample households, being the inverse of the probability of its selection for calculating the national estimates, and 60 replicate weights for the estimation of relative standard errors.
Further details about the survey, the questionnaire and diaries used, and a full list of the expenditure items are available on the ABS website.17
Results
Overall characteristics of households
The estimated number of households in Australia in 2015–16 was 8.96 million. The average age of their reference people was 52 years and 41.0% were females, who were somewhat older than their male counterparts. One-in-four reference people was aged ≥65 years, 28.9% reported experiencing at least one financial stress during the year before the survey, 58.6% had PHI and 10.2% reported zero OOP expenditure on health care during the reference periods of the survey.
Selected characteristics of households
Table 1 provides data on selected sociodemographic characteristics of households cross-classified by their age and sex profiles, experiences of financial stress, PHI and proportion with zero OOP expenditure on health care.

|
The majority of households were located in the greater city areas in each state and territory. On average, the reference people of such households were younger than those of families living outside capital cities. Although there was no significant gender gap and or variation in financial stress experiences between the two groups, the city dwellers were more likely to have PHI and far fewer reported zero OOP expenditure on health care.
Classifying the households by income quintiles revealed strong negative associations with age and sex of the reference person, financial stress and reportedly zero OOP expenditures on health care. Conversely, the association between income quintile and PHI was strongly positive.
The two groups of households with children (i.e. couples with children and single parents with children) were substantially younger than all the other households. The latter group, along with lone-person households, was characterised by a higher proportion of female household reference people, higher levels of financial stress, no PHI and zero OOP expenditure on health care.
Households whose main sources of income were government pensions and allowances consisted predominantly of older reference people who were more likely to be female. Such households had high levels of financial stress, non-access to PHI and zero OOP expenditure on health care.
Overall OOP expenditure on health care
The annual average expenditure on health care was A$4290 per household. This represented 5.8% of the total household expenditure on all goods and services.
Table 2 lists the average annual OOP expenditure on health care, total expenditure on all goods and services and the ratio of these two. Households that had PHI spent fourfold more on OOP expenses than those that were not ensured. Although their total expenditure on all goods and services was somewhat higher, the proportion of their household budget spent on OOP expenses was 2.5-fold greater than that of uninsured households.

|
Household income revealed a strong positive association with both OOP expenses and total household budget. It appears that, on average, the richer households, despite having highest OOP levels, spent a smaller proportion of their household budget on health care, primarily because of their high income levels.
Among the various household types, couples with children had the highest OOP expenses as well as the highest expenditure on all goods and services, whereas the lone-person households ranked lowest on both these indicators. Couple-only households had the highest ratio between their OOP expenses and household budget, whereas households consisting of single parents with children had the lowest OOP expenses : household budget ratio.
Households whose reference people were ≥65 years or female had spent somewhat less on OOP expenses. However, expressed as proportion of their total household budgets, their ratios were higher than the households whose reference people were <65 years or male. A similar pattern was noted for households whose main source of income was government pensions and allowances.
OOP expenditure by items
Overall, the biggest item of OOP expenditure was the cost of PHI premiums. In the majority of cases these costs are after rebate, although some households may have claimed the rebate through tax. PHI premiums accounted for 40.6% of the total OOP expenditure per household. The remaining 59.4% included the medicines and other therapeutic products bought over the counter (13.6%), copayments to specialists (10.2%), fee or copayments to dentists (9.2%), copayments for medicines largely covered by the PBS (6.8%), fees or copayments to other health professionals, such as physiotherapists, psychologists (6.7%) and general practitioners (GPs; 2.2%), with the remainder (10.5%) for miscellaneous expenses not covered elsewhere, such as hospital charges and hire or purchase of therapeutic appliances.
Table 3 gives the breakdown of the eight OOP expenditure items by selected characteristics of households. For each item, the privately insured households spent more money than those not insured. With the exception of copayments to specialists, the households living in capital cities spent more than those living elsewhere. The increasing gradient with income was apparent for each item of expenditure. Although there was no clear pattern by household type, age and sex of the reference person, households whose main sources of income were government pensions and allowances spent much less money on each item compared with the overall averages given in the last row of Table 3. This is probably because many specialists and health professionals bulk-bill such patients or give them discounts.

|
Changes in OOP expenditure over time
Table 3 shows changes in OOP expenditure disaggregated by items between 2009–10 and 2015–16. The biggest increase was in the PHI premiums, followed by other-than-doctors health professionals’ fees (although only partially covered by PHI, depending upon the individual health insurance policies), copayments charged by medical specialists and other miscellaneous costs, including hospital charges. Copayments for GP consultations showed much smaller increases than those for the specialists. There was no significant change in the outlays for dentists and medicines.
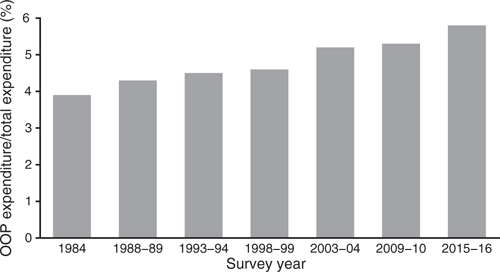
Overall, the OOP expenditure increased by 3.8% per annum, whereas the total household expenditure on all goods and services had a more modest increase of 2.4% per annum. In proportional terms, Australian households spent 5.3% of their household budget on health care in 2009–10; this increased to 5.8% in 2015–16.
Historical data from the seven HES conducted by the ABS since the advent of Medicare in 1984 show that this proportion has been monotonically increasing (Fig. 1).18
|
National estimates of OOP expenditure
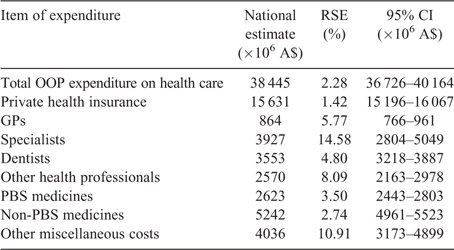
The average annual OOP expenditures were multiplied by the estimated number of households (8.962 million) to determine the national OOP expenditure on health care. This resulted in an estimate for 2015–16 of A$38.4 billion. This is 33.8% higher than the previous estimate of A$28.7 billion based on the 2009–10 data.15,16 Table 4 disaggregates our national estimates into the cost of PHI and various other items of healthcare expenditure. Data from PHI companies compiled by the Australian Prudential Regulation Authority (APRA) indicate that the total cost of PHI in 2015–16 was A$22 054 million.20 This figure includes both the premiums paid by individuals or households, as well as the rebate paid by the Australian government. APRA does not release the data on these two components separately. However, in Health Expenditure Australia 2015–16 (table 3.1),5 the AIHW has reported that in 2015–16 the PHI companies contributed A$14.917 billion towards the cost of health care in Australia. Our analysis shows that this amount was easily covered by the A$15–16 billion in PHI premiums paid by individuals or households.
|
The AIHW’s estimate of A$29.4 billion (table 3.1)5 for the OOP cost was substantially lower than our estimate of A$37–40 billion (Table 4). The differences between our estimates and those of the AIHW are due largely to the different methodologies used: our estimates are based on reported expenditure by households, whereas the AIHW estimates are based on administrative records. In addition, we have included the cost of PHI in our analysis, whereas the AIHW has not. We consider that our estimates are representative of the actual OOP burden of health care in Australia.
Discussion
In this study we report the experience of a representative sample from the community about personal health expenditure. We found that OOP expenditure was highest among affluent households, especially those holding PHI. This was so whether or not PHI premiums were treated as an OOP expense. A small group of respondents who claimed to have had no OOP expenditure on health care were among the lowest socioeconomic groups.
The findings of this study are limited because the study depended solely on recall by householders of what they had spent on household goods and services during certain reference periods. The data used in this paper do not indicate the extent to which OOP expenses limit access to health care. However, OOP costs weigh more heavily on individuals with low incomes and multiple health problems.9–11
A strength of this study is that the stability of methods used in the HES of 2009–10 and 2015–16 allows comparison between the two surveys because the biases in reporting are likely to be broadly the same. Because both surveys were spread over 12-month periods, seasonal variations in expenditure are covered. We noted that the demographic and socioeconomic features of the households in the 2009–10 and 2015–16 surveys were very similar. This study does not include the cost of aged care because relevant data were not collected in the HES.
The progressive movement of healthcare costs from public to person has occurred without policy debate, slowly and steadily with small steps, such as freezing Medicare rebates for various medical services, and so it may be imperative for practitioners to seek, beyond simple efficiency savings, an increasing copayment from patients.
Historical data indicate that OOP expenses on health care as a proportion of the total household budget of Australian households have been increasing since 1984, when Medicare was introduced. The other national healthcare payment system besides Medicare is PHI, which is used by approximately half the population; it also claims to be under serious pressure.
The effects on individuals of large copayments for medical and surgical care were reported vividly in a 2018 Four Corners program on the ABC.19 Case histories of dire consequences as a result of huge OOP expenses reinforce the seriousness of the drift away from public payment for health care and challenge prevailing concepts of equity. The large OOP expenses for care by medical specialists reveal no evidence of concordant variations in quality or access of care provided.13 OOP expenses can be extremely heavy, and indeed crippling, when long, drawn-out care costs are incurred by individuals with multiple chronic diseases.9 Individual effects of an upward drift in OOP expenses deserve serious public discussion in the determination of future health policy for Australia.
Competing interests
None.
Acknowledgements
The authors thank the Australian Bureau of Statistics for making data from their Household Expenditure Survey conducted in 2015–16 available to us. The authors are grateful for the interest of their colleagues in the Menzies Centre for Health Policy. This research did not receive any specific funding.
References
[1] Boxall A-M, Gillespie JA. Making Medicare: the politics of universal health care in Australia. Sydney: University of New South Wales Press; 2013.[2] Baggott R. Health and health care in Britain. 3rd edn. New York: St. Martin’s Press; 2004.
[3] Maioni A. Health care in Canada. Oxford: Oxford University Press; 2015.
[4] Australian Institute of Health and Welfare (AIHW). 25 years of health expenditure in Australia: 1989–90 to 2013–14. Catalogue no. HWE66. Canberra: AIHW; 2016. Available at: https://www.aihw.gov.au/reports/health-welfare-expenditure/25-years-of-health-expenditure-in-australia-1989-90-to-2013-14/contents/table-of-contents [verified 23 June 2018].
[5] Australian Institute of Health and Welfare (AIHW). Health expenditure Australia 2015–16. Catalogue no. HWE58. Canberra: AIHW; 2017. Available at: https://www.aihw.gov.au/getmedia/3a34cf2c-c715-43a8-be44-0cf53349fd9d/20592.pdf.aspx?inline=true [verified 23 June 2018].
[6] Ang JB. The determinants of health care expenditure in Australia. Appl Econ Lett 2010; 17 639–44.
| The determinants of health care expenditure in Australia.Crossref | GoogleScholarGoogle Scholar |
[7] Schofield D. Public hospital expenditure: how is it divided between lower, middle and upper income groups? Aust Econ Rev 2000; 33 303–16.
| Public hospital expenditure: how is it divided between lower, middle and upper income groups?Crossref | GoogleScholarGoogle Scholar |
[8] Barrett GF, Condon R. Health care spending: family structure and family health. Econ Labour Relat Rev 2003; 14 143–52.
| Health care spending: family structure and family health.Crossref | GoogleScholarGoogle Scholar |
[9] Jan S, Essue BM, Leeder SR. Falling through the cracks: the hidden economic burden of chronic illness and disability on Australian households. Med J Aust 2012; 196 29–31.
| Falling through the cracks: the hidden economic burden of chronic illness and disability on Australian households.Crossref | GoogleScholarGoogle Scholar | 22256924PubMed |
[10] Dewey HM, Thrift AG, Mihalopoulos C, Carter R, Macdonell RAL, McNeil JJ, Donnan GA. ‘Out of pocket’ costs to stroke patients during the first year after stroke – results from the North East Stroke Incidence Study. J Clin Neurosci 2004; 11 134–7.
| ‘Out of pocket’ costs to stroke patients during the first year after stroke – results from the North East Stroke Incidence Study.Crossref | GoogleScholarGoogle Scholar | 14732370PubMed |
[11] Essue B, Kelly P, Roberts M, Leeder S, Jan S. We can’t afford my chronic illness! The out-of-pocket burden associated with managing chronic obstructive pulmonary disease in western Sydney, Australia. J Health Serv Res Policy 2011; 16 226–31.
| We can’t afford my chronic illness! The out-of-pocket burden associated with managing chronic obstructive pulmonary disease in western Sydney, Australia.Crossref | GoogleScholarGoogle Scholar | 21954233PubMed |
[12] Callander E, Fox H. Changes in out-of-pocket charges associated with obstetric care provided under Medicare in Australia. Aust N Z J Obstet Gynaecol 2018; 58 362–5.
| Changes in out-of-pocket charges associated with obstetric care provided under Medicare in Australia.Crossref | GoogleScholarGoogle Scholar | 29327343PubMed |
[13] Freed GL, Allen AR. Variation in outpatient consultant physician fees in Australia by speciality and state and territory. Med J Aust 2017; 206 176–80.
| Variation in outpatient consultant physician fees in Australia by speciality and state and territory.Crossref | GoogleScholarGoogle Scholar | 28253468PubMed |
[14] Jones G, Savage E, van Gool K. The distribution of household health expenditures in Australia. Econ Rec 2008; 84 S99–114.
| The distribution of household health expenditures in Australia.Crossref | GoogleScholarGoogle Scholar |
[15] Yusuf F, Leeder SR. Can’t escape it: the out-of-pocket cost of health care in Australia. Med J Aust 2013; 199 475–8.
| Can’t escape it: the out-of-pocket cost of health care in Australia.Crossref | GoogleScholarGoogle Scholar | 24099208PubMed |
[16] Yusuf F, Leeder SR. Household expenditure on medical care and health in Australia. In Hoque N, Potter L, editors. Emerging techniques in applied demography. Dordrecht: Springer; 2015. pp. 189–210.
[17] Australian Bureau of Statistics (ABS). Household expenditure survey and survey of income and housing, user guide, Australia, 2015–16. Catalogue no. 6503.0. Canberra: ABS; 2017. Available at: http://www.abs.gov.au/ausstats/abs@.nsf/mf/6503.0 [verified 25 July 2018].
[18] Australian Bureau of Statistics. Household expenditure survey, Australia: summary of results, 2015–16. Key findings. Catalogue no. 6530.0. Canberra: ABS, 2017. Available at: http://www.abs.gov.au/ausstats/abs@.nsf/mf/6530.0 [verified 25 July 2018].
[19] Willis O; for Four Corners. Medical bills: how out-of-pocket costs can get out of control. ABC Health & Wellbeing, 28 May 2018. Available at: http://www.abc.net.au/news/2018-05-28/how-out-of-pocket-medical-costs-can-get-out-of-control/9592792 [verified 30 July 2018].
[20] Australian Prudential Regulation Authority. Operations of private health insurers annual report, 2015–2016, table 1. Available at: http://webarchive.nla.gov.au/gov/20170316172201/http://apra.gov.au/PHI/Publications/Pages/Operations-of-Private-Health-Insurers-Annual-Report.aspx [verified 9 April 2019].