Recognising potential for preventing hospitalisation
David Banham A F , Tony Woollacott A , John Gray B , Brett Humphrys C , Angel Mihnev D and Robyn McDermott EA Strategic Planning, Research and Analysis Unit, SA Health, Level 10, CitiCentre 11 Hindmarsh Square, Adelaide, SA 5000, Australia.
B Southern Adelaide Health Service, Sir Mark Oliphant Building, Lafter Drive, Science Park, Bedford Park, SA 5042, Australia.
C Country Health South Australia, Port Augusta Hospital, 36 Flinders Terrace, Port Augusta, SA 5700, Australia.
D Central Northern Adelaide Health Service, 207-255 Hampstead Road, Northfield, SA 5085, Australia.
E Division of Health Sciences, University of South Australia, City East Campus, North Terrace, Adelaide, SA 5000, Australia.
F Corresponding author. Email: david.banham@health.sa.gov.au
Australian Health Review 34(1) 116-122 https://doi.org/10.1071/AH09674
Submitted: 11 August 2008 Accepted: 1 April 2009 Published: 25 March 2010
Abstract
To identify the incidence and distribution of public hospital admissions in South Australia that could potentially be prevented with appropriate use of primary care services, analysis was completed of all public hospital separations from July 2006 to June 2008 in SA. This included those classified as potentially preventable using the Australian Institute of Health and Welfare criteria for selected potentially preventable hospitalisations (SPPH), by events and by individual, with statistical local area geocoding and allocation of relative socioeconomic disadvantage quintile. A total of 744 723 public hospital separations were recorded, of which 79 424 (10.7%) were classified as potentially preventable. Of these, 59% were for chronic conditions, and 29% were derived from the bottom socioeconomic status (SES) quintile. Individuals in the lowest SES quintile were 2.5 times more likely to be admitted for a potentially preventable condition than those from the top SES quintile. Older individuals, males, those in the most disadvantaged quintiles, non-metropolitan areas and Indigenous people were more likely to have more than one preventable admission.
People living in more disadvantaged areas in SA appear to have poorer utilisation of effective primary care, resulting in preventable hospital admissions, than those in higher SES groups. The SA Health Care Plan, 2007–2016 is aimed at investing in improved access to primary care in those areas of most disadvantage. The inclusion of SPPHs in future routine reporting should identify if this has occurred.
What is known about the topic? Ambulatory care sensitive conditions, or selected potentially preventable hospitalisation separations (SPPH), are an indicator of the availability and effectiveness of primary health care. SPPHs are increasingly reported by area level disadvantage.
What does this paper add? This paper offers analysis by individuals. It shows around three-quarters of individuals had one potentially preventable public hospital separation. The rate among those living in the most disadvantaged areas was more than twice that of lowest disadvantage areas.
What are the implications for practitioners? Realising the potential for preventing potentially avoidable hospitalisation may involve focus on particular target areas and subpopulations. Potentially preventable separations by area of disadvantage can assist with monitoring performance and evaluating policy and program initiatives. Analysis by numbers of individuals will enhance this further.
Ambulatory Care Sensitive Conditions (ACSCs) are one indicator of the suboptimal availability and effectiveness of primary health care1 in preventing hospitalisation for a range of conditions through primary prevention, early diagnosis, treatment and/or appropriate long-term management.2 Other measures of assessing the impact of primary care, such as data derived from service throughput records or patient satisfaction surveys, have inherent weaknesses. They do not capture unmet need in the population at all, whereas ACSCs at least measure need where a condition has deteriorated. These other measures are also open to problems of validity and reliability given the incomplete coverage and sometimes poor quality of primary care service throughput data and the general lack of standardisation and low response rates in patient satisfaction surveys.
Variations of the ACSC indicator are widely published internationally with relevance and generalisability across a variety of contexts where funding source and coverage vary.2–4 Some Australian jurisdictions report ACSCs,1 whereas the Australian Institute of Health and Welfare reports selected potentially preventable hospitalisations (SPPHsA)5,6 in relation to 21 conditions arranged into three categories:
-
acute – appendicitis with generalised peritonitis, cellulitis, convulsions and epilepsy, dehydration and gastroenteritis, dental conditions, ear nose and throat infections, gangrene, pelvic inflammatory disease, perforated-bleeding ulcer and pyelonephritis;
-
chronic – angina, asthma, chronic obstructive pulmonary disease, congestive cardiac failure, diabetes complications, hypertension, iron deficiency anaemia, nutritional deficiencies and rheumatic heart disease; and
-
vaccine related – influenza, pneumonia and other vaccine preventable conditions.
Given their relevance to primary health care, SPPHs are increasingly and routinely reported by individual level income,7 area level disadvantage8,9 and by Indigenous identification.10,11 As the distribution of SPPHs suggest inequity and inefficiency in the wider health system,12 they can provide a useful addition to a suite of indicators aimed at improving equity in health system performance.13 Often this leads to opportunities for pursuing cost savings for the health system through targeting small, localised areas and/or population subgroups.7
To date, Australian SPPH analyses focus on the volume of hospital services delivered, owing to the availability of administrative data sets that are designed to count funded service activity rather than patient outcomes. An alternative is to count the individuals using those services. This is possible if separations associated with individuals can be identified, however, such an identifier is not routinely available in Australia.
This paper uses several (sometimes incomplete) fields within an administrative collection of public hospital separations in South Australia to examine the number of South Australians admitted to public hospitals for a selection of potentially preventable conditions in the period July 2006 to June 2008. In spite of the limitations of the method and data underpinning the estimates, the paper aims to identify who is currently experiencing potentially preventable hospitalisation by offering some insight into questions such as:
-
How many individuals are hospitalised for potentially preventable conditions in South Australia?
-
How do rates of individuals experiencing SPPHs vary by area disadvantage and other demographic variables?
-
How do SPPH rates among those individuals vary by sex, age and area disadvantage?
Methods
Separations
Public hospital, inpatient admission separations for South Australian residents within the Integrated South Australian Activity Collection (ISAAC) for July 2006 to June 2008 were scanned for SPPHs using an SPSS14 algorithm based on the Australian Institute of Health and Welfare’s conditions list.15 Previous analyses indicated cases within the condition of diabetes complications involving renal dialysisB are skewed because of coding practices in several hospitals. Given their confounding effect, such cases were omitted from further analysis.
In addition to diagnosis and procedure fields, ISAAC includes several mandatorily reported fields including Indigenous identification and area of usual residence. These small, geographic areas, known as statistical local areas (SLAs),16 were ranked according to the 2006 Census Index of Relative Socio-economic Disadvantage (IRSD),17 then allocated to an area disadvantage quintile of approximately equal population size. The South Australian estimated resident population at 30 June 2006 by SLA, sex and age (M. Roden, Demography Section, ABS, pers. comm., 12 December 2007) provides the denominator for calculating separation rates. The age and sex profile of each SLA and disadvantage quintile varies, so quintile rates are directly age and sex adjusted with Australia 2001 as the comparator population. Indigenous identification was assigned by positive responses to ISAAC’s Aboriginal and Torres Straight Islander field, and non-metropolitan residency was assigned to SLAs outside metropolitan Adelaide.
Individuals
After assigning each separation a unique case number, the last digit of the recorded Medicare number was removed. Where valid Medicare numbers were available, the file was aggregated by Medicare number, date of birth and sex, with the first appearing case number retained for each ‘individual’. Where the Medicare number was missing, separations were aggregated by date of birth, sex and postcode to identify further individuals, then the remainder were reaggregated by date of birth, sex, hospital and unit record number with individuals identified by first-appearing case number. From remaining unprocessed separations, a further set of individuals were identified by manually inspecting date of birth, sex, postcode and hospital/unit record.
Data analysis
Statistical analyses used STATA version 9.218 with all statistical tests two-tailed and P < 0.05 defining statistical significance. Marascuilo’s procedure for planned comparisons19 enabled the simultaneous testing of proportionate SPPH distribution by demographic variables across disadvantage quintiles. The relationship between individuals’ SPPH separation numbers and available predictor variables was initially examined using Poisson regression. Due to evidence of overdispersion, the final multivariate model used negative binomial regression to increase the efficiency of the model estimates.
Results
Separations
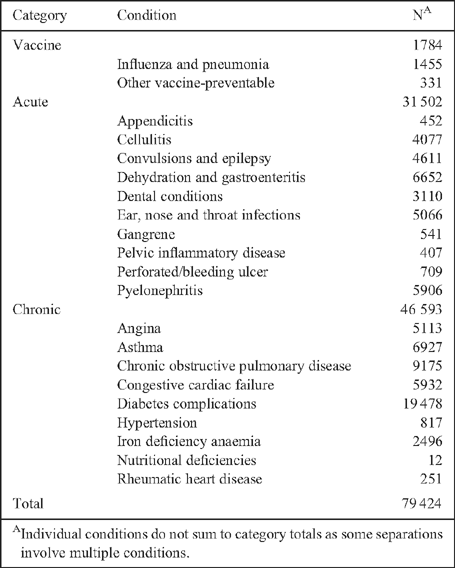
Of 758 977 public hospital separations, 744 723 (98.1%) involved usual residents of SA, with 83 347 (11.2%) categorised as potentially preventable. Within these, diabetes complications involving renal dialysis involved 3923 separations (47 individual unit record numbers) and 79 424 SPPH separations remained after their removal. Box 1 details the distribution of those SPPH separations by categories and conditions. Whereas public hospital separations account for 74% of all SPPHs in SA, unpublished data not shown in this report indicated 28 442 (6.1%) separations from private hospitals were identified as being for potentially preventable conditions.

|
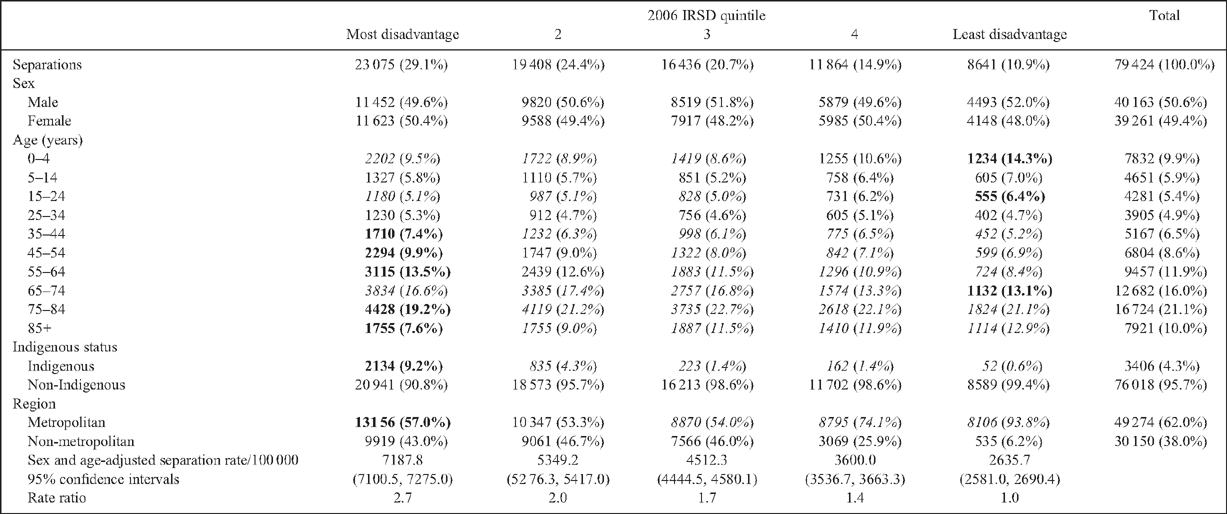
Almost 30% of potentially preventable hospitalisations to public hospitals involve residents from the 20% of population in South Australia’s most disadvantaged areas (Box 2). After adjusting for age and sex, separation rates decreased as area disadvantage decreased. The rate in the most disadvantaged quintile was 2.7 times greater than the least disadvantaged quintile.
Although there were no significant sex differences, a number of age differences were apparent. For each age group, separation numbers tended to be highest among residents in areas of greatest disadvantage and lowest in areas of least disadvantage. Two exceptions were the third quintile’s results for the 85 years and over age group, and younger ages in quintiles four and five where figures were higher than the general trend. After the infant years, the general increase in separation numbers in line with increasing age is similar across quintiles. The relative change within quintiles varies markedly though. At both ends of the age spectrum, the proportion of separations involving infants and persons aged 75 or more in areas of least disadvantage were significantly higher compared with most disadvantage. In the 35–64 years age group, the opposite occurred and 31% of separations involved residents of most disadvantaged areas compared with 21% in areas of least disadvantage. Hospital separations involving Indigenous people were generally over-represented, and remarkably so in areas of most disadvantage. To a lesser, but still significant, extent residents from non-metropolitan areas were also over-represented.
Individuals
The separations data from public hospitals included Medicare number, 5.9% (4679) of which were missing. People identified as Indigenous were over-represented in such separations and accounted for 11.2% of those cases. After applying the automated procedure for identifying individuals, 387 separations were manually inspected and a further 313 individuals identified.
Of 54 573 individuals identified, 41 930 (76.8%) had a single separation. The remaining 12 643 (23.2%) accounted for 37 494 (47.2%) of separations.
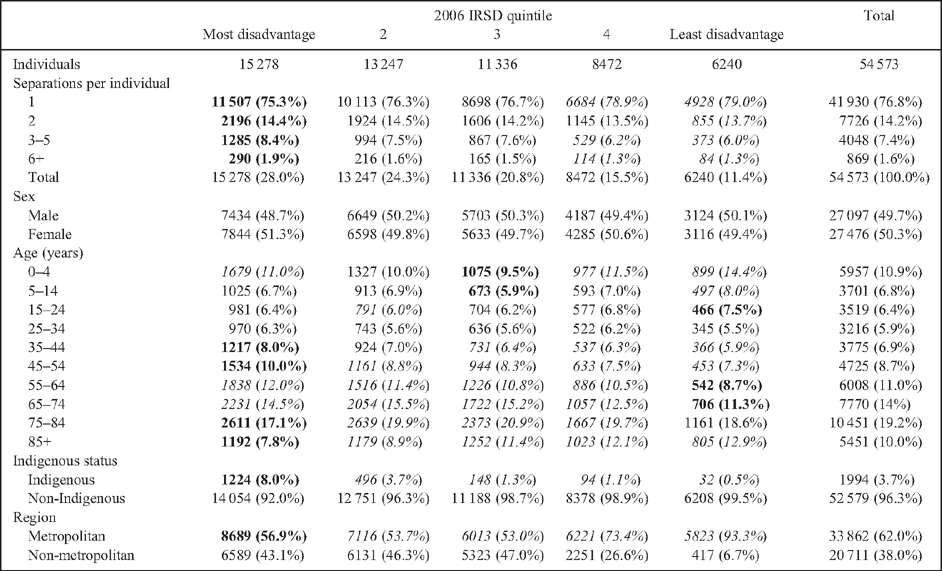
Twice the number of individuals from high disadvantage areas experienced a single separation compared with those from lowest disadvantage (Box 3). This increased to an almost threefold difference among individuals having multiple separations. There were no statistically significant sex differences in the number of individuals within each level of area disadvantage.
The absolute number of individuals in each age group generally decreased as disadvantage reduced. However, the relative distribution of individuals by age within each quintile varied. The 35 to 64 years age group from more disadvantaged quintile areas was significantly over-represented, whereas the opposite was the case for the 75 years and over age group. The association between individuals and area disadvantage reduced in the 85 years and over group such that the greatest number of individuals came from the middle quintile. Indigenous people continued to be significantly over-represented, as were non-metropolitan residents.
A gradient in SPPH rates for individuals was apparent across disadvantage quintiles (Box 4). Residents of most disadvantaged areas were two-and-a-half times more likely to be hospitalised compared with residents of least disadvantaged areas (4807.0 and 1906.5 persons per 100 000 respectively). The effect is more marked among people having more than one SPPH separation. In those cases, the difference in rates increased such that individuals experiencing two or more separations for SPPH conditions were almost three times greater in areas of most disadvantage compared with least disadvantage.
Multivariate analyses
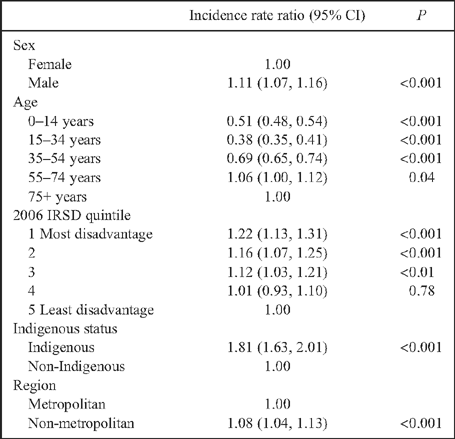
Each of the available variables (sex, age, IRSD, Indigenous status and region) contributed significantly to an initial Poisson regression model. Due to evidence of significant overdispersion (G2 > 26 000, P < 0.001), a subsequent binomial regression model (Box 5) was preferable for predicting the characteristics of individuals’ experiencing more than one SPPH separation.
Multiple SPPH separations were significantly more likely for patients who were male (P < 0.001), living in a more disadvantaged area (P < 0.001 for IRSD Quintiles 1 and 2, and P < 0.01 for Quintile 3, when compared with Quintile 5), for those in non-metropolitan areas (P < 0.001) and for those of Indigenous ancestry (P < 0.001). Although multiple SPPH separations among individuals aged 55 to 74 years were 6% more likely compared with those aged 75 or more (P = 0.04), lower age was generally associated with a reduced likelihood of multiple separations.

|
Discussion
Consistent with previously published research, South Australian inpatient data for public hospitals reveal substantial differences in the distribution of hospitalisations that might potentially be prevented with appropriate primary health care. Separations for potentially preventable conditions were more likely to involve residents from areas of increased relative disadvantage, with separation rates for patients from such areas being 2.7 times greater than for those from the least disadvantaged areas (Box 2; quintile 1 : quintile 5 ratio). Rates of potentially preventable separations for Indigenous persons and residents of non-metropolitan areas were also higher than for their non-Indigenous and metropolitan counterparts.
The results of this analysis at the individual patient level add to our understanding by showing that a relatively small, but nonetheless significant, number of public hospital patients experience multiple separations for conditions amenable to preventive intervention. Approximately three-quarters of individuals identified (41 930) had a single separation involving a potentially preventable condition, whereas the remaining quarter of individuals (12 643) accounted for almost half the separations (37 494).
These individuals experiencing multiple separations were even more likely to be from an area of greater disadvantage (quintile 1 : quintile 5 rate ratio of 2.9). Having developed a condition severe enough to result in hospitalisation, the odds of multiple admissions increased with age and also for males, Indigenous people and residents from areas of higher disadvantage and non-metropolitan areas.
In 2006–07, the SPPH rate ratio between most: least disadvantaged areas for all Australia was 1.6 (observed across all jurisdictions and including both private and public hospitals).6 In SA, when private as well as public hospital separations are used, the equivalent figure is also 1.6 for the 2006–07 and 2007–08 financial years. However, as noted above, when public hospital separations are considered alone, the rate ratio (quintile of most : least disadvantage) rises to 2.7.
Also in line with other Australian studies, non-metropolitan residents1,5,6 and Indigenous people10 were over-represented in separations for potentially preventable conditions.
Although conditions and definitions associated with SPPH or ACSC vary across published analyses, the existence of differences in separation rates by socioeconomic status and for Indigenous people observed in this study are consistent with international literature also. In the United States, higher separation rates exist in low versus high income areas7,12 and among black Americans compared with white.12 In Canadian analyses using income quintiles, the separation rate ratios of lowest : highest quintiles were around 2.08 and observed separations for Indigenous people were 2.5 times that of the general population.4
Exact identification of individuals and particularly of Indigenous individuals is not possible using the methods selected for this analysis. Aside from the obvious difficulties with a proxy individual identifier, a further potential bias arose because disproportionately more Indigenous hospital separation records were missing Medicare numbers. Greater accuracy in the identification of individuals from current local administrative health data sets will only be possible when a data linkage program such as that currently being established in SA is fully operational (see https://www.santdatalink.org.au/).
Anomalous results in the 75 years and over age group could be due to the concentration of residential aged care facilities within advantaged areas, particularly in the Adelaide metropolitan area.20 This would tend to lead to frailer, older individuals, regardless of their socioeconomic background, being recorded as resident in relatively advantaged areas. Separation rates among older people may also be influenced by relatively earlier death and/or a healthy survivor effect occurring in disadvantaged areas, leading to decreased hospitalisation for potentially preventable conditions. Additionally, it is possible that more complex cases in older age groups move from private to public hospitals for treatment.
As it stands, the SPPH indicator is a limited measure of hospitalisations that might be preventable, or avoidable. It includes all ages, with categorisation based on coding rather than individual history. In other respects it is limited, as it omits other preventable conditions in mental health, substance use, and injury. Additionally, without an individual level measure of disadvantage, it is not possible to examine the relative influence on these data of highly disadvantaged individuals living in low disadvantage areas and vice versa.
Conclusions
Within these limitations, using the ACSC indicator in the approach taken in this study offers a valuable perspective on system performance. In describing aspects of turnover (total separations) and population health outcomes (likelihood and frequency of hospitalisation) the study has uncovered the potential to improve health system performance by decreasing potentially preventable separations for residents of disadvantaged areas both in absolute and relative terms.
Not only were SPPH rates higher for individuals from disadvantaged areas, but so was their likelihood of having multiple separations once they were hospitalised. Preventing individuals from more disadvantaged areas experiencing a potentially preventable hospitalisation is more likely to avoid multiple separations.
To realise this potential, it may be appropriate to focus on particular target areas7 and subpopulations. Current South Australian responses to the population health need for better access to primary care include:
-
programs aimed at maintaining a healthy lifestyle;
-
‘GP Plus’ Health Care Centres to promote better health and manage chronic conditions; and
-
a range of ‘out of hospital care’ services for identified patients at high risk of hospitalisation.21
These policy and program initiatives are supported by monitoring and evaluation activities and the inclusion of potentially preventable hospital separations by area of disadvantage as a key performance measure.13
Competing interests
The authors declare that they have no competing interests.
Acknowledgement
The opinions expressed here do not necessarily reflect those of the South Australian Government or SA Health.
[1] Ansari Z, Barbetti T, Carson NJ, Auckland MJ, Cicuttini F. The Victorian ambulatory care sensitive conditions study: rural and urban perspectives. Soz Praventivmed 2003; 48 33–43.
| Crossref | GoogleScholarGoogle Scholar | PubMed |

[2] Caminal J, Starfield B, Sánchez E, Casanova C, Morales M. The role of primary care in preventing ambulatory care sensitive conditions. Eur J Public Health 2004; 14 246–51.
| Crossref | GoogleScholarGoogle Scholar | PubMed |

[3] Gusmano MK, Rodwin VG, Weisz D. A new way to compare health systems: avoidable hospital conditions in Manhattan and Paris. Health Aff 2006; 25 510–20.
| Crossref | GoogleScholarGoogle Scholar |

[4] Shah BR, Gunraj N, Hux JE. Markers of access to and quality of primary care for Aboriginal people in Ontario, Canada. Am J Public Health 2003; 93 798–802.
| Crossref | GoogleScholarGoogle Scholar | PubMed |

[5]
[6]
[7] DeLia D. Distributional issues in the analysis of preventable hospitalizations. Health Serv Res 2003; 38 1761–80.
| Crossref | GoogleScholarGoogle Scholar | PubMed |

[8] Roos LL, Walld R, Uhanova J, Bond R. Physician visits, hospitalizations, and socioeconomic status: ambulatory care sensitive conditions in a Canadian setting. Health Serv Res 2005; 40 1167–85.
| Crossref | GoogleScholarGoogle Scholar | PubMed |

[9]
[10] Stamp KM, Duckett SJ, Fisher DA. Hospital use for potentially preventable conditions in Aboriginal and Torres Strait Islander and other Australian populations. Aust N Z J Public Health 1998; 22(6): 673–8.
| Crossref | GoogleScholarGoogle Scholar | PubMed | CAS |

[11]
[12] Pappas G, Hadden WC, Kozak LJ, Fisher GF. Potentially avoidable hospitalizations: Inequalities in rates between US socioeconomic groups. Am J Public Health 1997; 87 811–6.
| Crossref | GoogleScholarGoogle Scholar | PubMed | CAS |

[13]
[14]
[15]
[16]
[17]
[18]
[19] Marascuilo LA, Slaughter RE. Statistical procedures for identifying possible sources of item bias based on χ2 statistics. J Educ Meas 1981; 18 229–48.
| Crossref | GoogleScholarGoogle Scholar |

[20]
[21]
A Throughout this report, ACSCs and SPPHs are taken to be coterminous and a full list of the relevant International Classification of Diseases, Version 10 codes applied are listed in table A1.9 at http://www.aihw.gov.au/publications/hse/ahs05-06/ahs05-06-x01.xls
B ICD-10 Principal diagnosis of renal dialysis (Z49) and any additional diagnosis in the range E10 to E14.9.


