

Design and phenotyping procedures for recording wool, skin, parasite resistance, growth, carcass yield and quality traits of the SheepGENOMICS mapping flock
Jason D. White A M , Peter G. Allingham B , Chris M. Gorman A , David L. Emery C , Philip Hynd D , John Owens E , Amy Bell F , Jason Siddell H K , Greg Harper B , Ben J. Hayes G , Hans D. Daetwyler G , Jonathan Usmar C , Mike E. Goddard A G , John M. Henshall F , Sonja Dominik F , Heather Brewer F , Julius H. J. van der Werf H , Frank W. Nicholas C , Robyn Warner G , Chris Hofmyer G , Terry Longhurst I , Troy Fisher J , Paul Swan J , Rob Forage I J L and V. Hutton Oddy H MA School of Veterinary Science, University of Melbourne, Vic. 3010, Australia.
B CSIRO Livestock Industries, Queensland Biosciences Precinct, 306 Carmody Road, St Lucia, Qld 4067, Australia.
C Department of Veterinary Science, University of Sydney, NSW 2006, Australia.
D Department of Animal Science, University of Adelaide, Roseworthy, SA 5371, Australia.
E Future Livestock, Yarraville, Vic. 3013, Australia.
F CSIRO Livestock Industries, Chiswick Laboratories, Uralla, NSW 2358, Australia.
G Biosciences Research Division, Department of Primary Industries Victoria, Bundoora, Vic. 3083, Australia.
H Environment and Rural Science, University of New England, Armidale, NSW 2351, Australia.
I Meat & Livestock Australia, Walker Street, North Sydney, NSW 2060, Australia.
J Australian Wool Innovation Ltd, George Street, Sydney, NSW 2001, Australia.
K Present address: Department of Primary Industries, Glen Innes, NSW 2370, Australia.
L Present address: University of New South Wales, Sydney, NSW 1466, Australia.
M Corresponding author. Email: hutton.oddy@une.edu.au; jasondw@unimelb.edu.au
Animal Production Science 52(3) 157-171 https://doi.org/10.1071/AN11085
Submitted: 24 May 2011 Accepted: 13 January 2012 Published: 2 March 2012
Journal Compilation © CSIRO Publishing 2012 Open Access CC BY-NC-ND
Abstract
A major aim of the research program known as SheepGENOMICS was to deliver DNA markers for commercial breeding programs. To that end, a resource flock was established, comprehensively phenotyped and genotyped with DNA markers. The flock of nearly 5000 sheep, born over two consecutive years, was extensively phenotyped, with more than 100 recorded observations being made on most of the animals. This generated more than 460 000 records over 17 months of gathering information on each animal. Here, we describe the experimental design and sample-collection procedures, and provide a summary of the basic measurements taken. Data from this project are being used to identify collections of genome markers for estimating genomic breeding values for new sheep industry traits.
Additional keywords: commercial traits, QTL screen, sheep phenotypes.
Introduction
Discovery of quantitative trait loci (QTL) associated with complex production traits has prompted many to establish populations of sheep for QTL mapping (see Crawford 2001 for a summary of sheep QTL studies to that time). Most of these studies were underpowered to detect QTL of even moderate effect. Furthermore, sheep-specific genomic resources were simply not available at the time to enable fine mapping, or candidate gene discovery. In part, this contributed to the observation that by 2001 only three gene mutations affecting production traits in sheep had been reported (Crawford 2001).
Meat and Livestock Australia and Australian Wool Innovation Ltd commissioned in 2003 a 5-year research program (SheepGENOMICS) to develop the resources (animal, phenotypes and genotyping capability) for the discovery of QTL and useful genes. It was anticipated that the identified QTL and useful genes could be put to work for the benefit of the Australian sheep industries (e.g. diagnostic tools, vaccines or novel treatments to improve sheep productivity and health).
As part of the development of SheepGENOMICS, the field was comprehensively reviewed and a research strategy developed to identify QTL and eventually DNA sequence variants (Goddard et al. 2003). This identified a three-step strategy, including (1) linkage analysis (LA) to map QTL to broad chromosomal regions, (2) linkage disequilibrium (LD) mapping to map the QTL more accurately and, (3) testing positional candidate genes and specific single-nucleotide polymorphisms (SNPs) within those genes.
To effectively utilise this strategy, it was considered impractical to solely exploit extant phenotyped resources and DNA, primarily because the power of such studies to discover QTL for a wide range of industry traits was low (Robinson and Goddard 2002), and obtaining access to the extant resources was in some cases not possible.
A new research flock (the SheepGENOMICS mapping flock) was designed to overcome limitations of past experiments in terms of power to detect QTL and a range of industry traits measured. It was designed to find QTL with a gene substitution effect >0.3 phenotypic standard deviations in the trait. To achieve this, 200 progeny per sire for industry sires and 400 progeny for sires with prior knowledge of segregating QTL were considered adequate. To improve the resolution of QTL mapping by LA and LD analysis, genetic diversity was introduced from the dam side. Dams as unrelated as possible to each other and the sires used were chosen as recipients for artificial insemination (AI) to generate the progeny. A wide range of traits that encompassed key attributes of meat and wool production, resistance to intestinal parasites, temperament and reproductive performance, was measured. The progeny from animals from this study have now been genotyped using the ovine SNP50 beadchip developed by the International Sheep Genomics Consortium (ISGC, www.sheephapmap.org, verified 31 January 2012) and Illumina (www.illumina.com, verified 31 January 2012). Results of genotype–phenotype association analyses will be reported elsewhere (see Kemper et al. 2011).
Here, we describe the mating plan and the generation and phenotyping of the progeny that constituted the SheepGENOMICS mapping flock. Preliminary data on the variation in selected phenotypes are presented.
Materials and methods
All procedures were carried out according to approval from the New South Wales (NSW) Department of Primary Industries, Director General’s Animal Care and Ethics Committee, project title ‘MLA/AWI Sheep Genomics Program Mapping Flock’. The flock was run entirely on the Falkiner Memorial Field Station (FMFS) near Deniliquin, NSW.
Experimental design
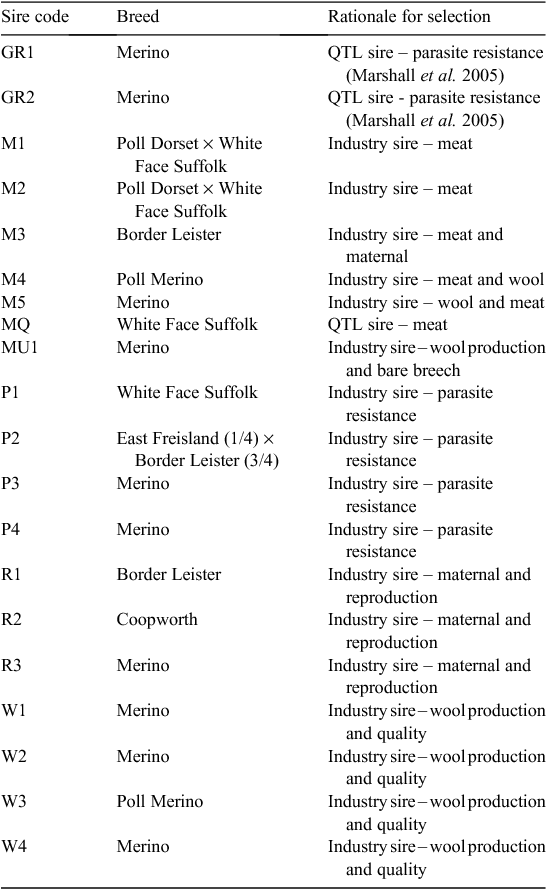
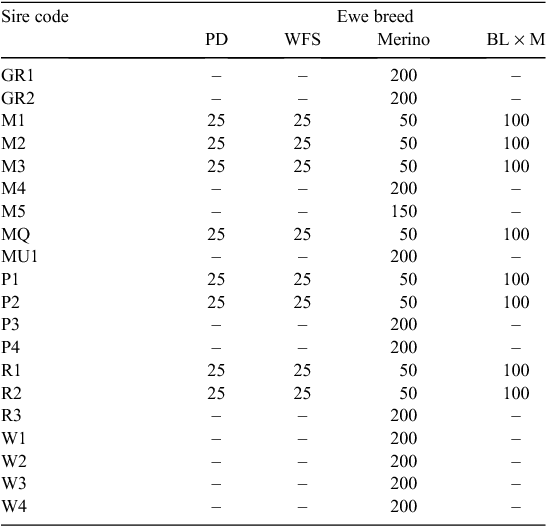
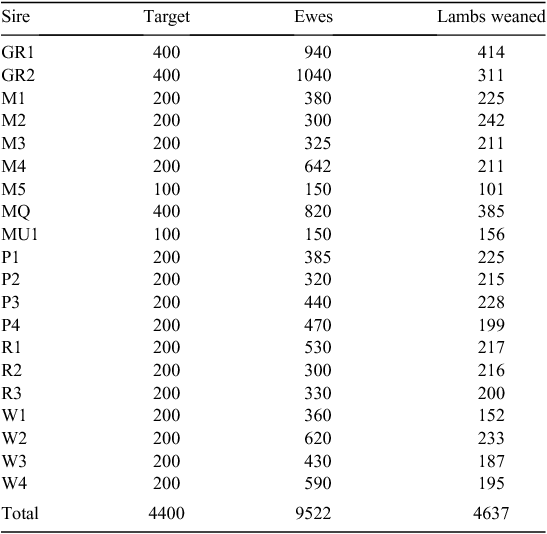
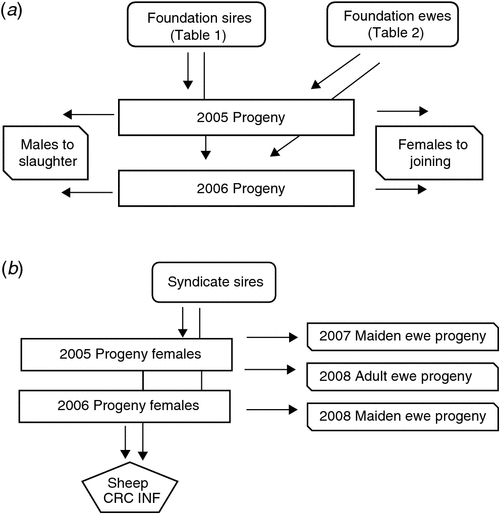
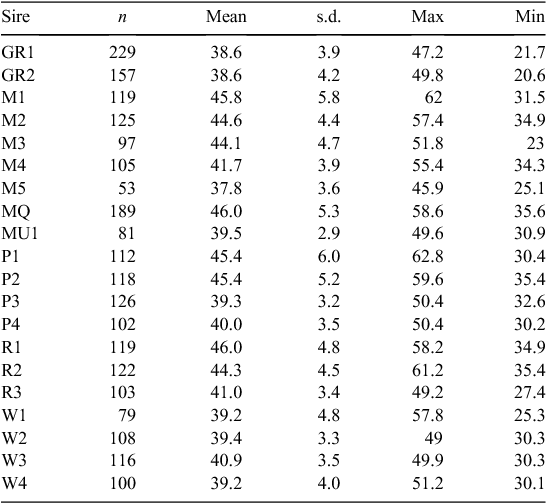
Twenty sires were selected on the basis of their contribution to the industry gene pool, and accuracy and magnitude of estimated breeding values for a range of traits including growth, muscle and fatness, resistance to internal parasites, reproductive rate (number of lambs weaned) and wool growth and quality (Table 1). Ewes were sourced from more than 60 different flocks (13 Poll Dorset, 7 White Suffolk, 3 Border Leicester × Merino and at least 37 Merino) that were as unrelated to each other as possible. Each ewe was inseminated using intrauterine laparoscopy, with semen from a known sire as follows. Merino sires were joined (by AI) only to Merino ewes and terminal and maternal sires were joined to Merino ewes and a selection of different breeds and crossbreeds of ewes (to approximate the structure of the Australian commercial sheep industry), as detailed in Table 2. Two cohorts of progeny were generated by AI in successive years (lambs were born in 2005 and 2006), with the aim of generating a minimum of 200 progeny per industry sire used in both 2005 and 2006 (n = 15), 100 progeny per sire for two sires (M5 and MU1) used only in 2006 and 400 progeny from each of the three sires (used in both 2005 and 2006) selected from past QTL studies. The numbers of lambs (progeny) generated in 2005 and 2006 are shown in Table 3. The general experimental design with respect to generation of progeny between years is represented schematically in Fig. 1.
|
|
|
|
Male progeny were slaughtered and the female progeny were retained and joined as maidens (2005 progeny in 2007 and 2006 progeny in 2008) and adults (2005 progeny in 2008). Joining was to selected industry sires in a syndicate (i.e. all sires put with all ewes) for a period of 6 weeks. Ewes were scanned and intensively lambed, providing records of lambs scanned, lambs born alive, lambs born dead, birthweights, maternal behaviour scores, lambs weaned and weaning weights. Cause of death was recorded where possible.
The chronology of management practices and measurements is shown in Table 4. The methods used to undertake measurements are detailed below. All samples were identified by a number, and the individual sheep electronic ear-tag number was recorded against this number. Abbreviations and definitions of traits measured are outlined in Table 5.

|

|
Measurement of live-animal traits
Lambs were weighed at birth (2006 progeny; trait = bwt) and at tagging (the first weight of the 2005 progeny and the second weight of the 2006 progeny) at ~3 weeks of age (trait = tag_wt), marking (6 weeks), weaning (10 weeks; trait = wn_wt) and at approximately monthly intervals thereafter. Eye muscle depth (trait = sc_emd), eye muscle width (trait = Sc_emw) and fat depth (trait = Sc_fat) were determined on all lambs by ultrasound scanning (Gilmour et al. 1994) at a minimum liveweight of 30 kg (trait = sc_wt). Growth rate was calculated for all progeny from 3 weeks of age (tagging) in the first year and from birth in the second year to the last liveweight collected before the kill day for wethers, and for the ewe population to the date of the last kill in each year (trait = lifegain). The difference in weight taken at these two times was divided by the number of days to generate growth rate in grams per day. At ~12 weeks of age, temperament was assessed by the following two methods: an agitation score (trait = agit) was measured by placement of lambs in an enclosed box (Murphy et al. 1994) and flight speed (trait = flight; Burrow et al. 1988). At ~6 months of age, visual scores of animal traits were assessed. Wool and skin traits were assessed at shearing, at ~12 months of age in ewe progeny.
Where traits on live animal were the same as those used in the Australian national sheep genetic evaluation service, methods recommended to industry by Sheep Genetics (http://www.sheepgenetics.org.au, verified 31 January 2012) were used.
Measurement of wool-related traits
Wool sampling protocol
Immediately before shearing the mid-side position on each individual sheep was identified on the fleece with a spray mark. The mid-side samples were collected at shearing. All mid-side samples were later subsampled as follows:
-
A 7–10-g sample for felt-ball testing (Greeff et al. 2005) and OFDA2000 testing (Baxter et al. 1993). The felt-ball test provides a quantitative measure of the propensity of a wool sample to shrink. The smaller the diameter of a ball of wool after mechanical agitation, the greater the shrinkage potential.
-
OFDA2000 measures the fibre-diameter frequency-distribution profile of the wool sample, and traits associated with this distribution such as mean fibre diameter, standard deviation of fibre diameter, coefficient of variation of fibre diameter, and the proportion of fibres <30 microns (‘comfort factor’). Fibre curvature (deg/mm) was also quantified.
-
A 50–70-g sample for Laserscan testing (Stobart et al. 1998) by AWTA Ltd Laserscan (CSIRO, Australia) provides fibre parameters similar to those from OFDA2000 (see above). A minimum of 50-g sample was sealed in aluminium foil and stored for future use.
The belly and fleece wool were weighed separately for all animals. The shearer was also recorded for each sheep. This is particularly important when analysing belly-weight data because shearers varied in the amount of belly wool they removed. The greasy fleece weight data were collected.
Skin sampling protocol
Four skin biopsies were taken under local anaesthesia from the mid-side of each sheep. Wool on the mid-side site was clipped close to the skin with fine animal clippers (Oster No. 40, John Oster Manufacturing, Milwaukee, WI, USA) and 0.25 mL Lignocaine – 2% with adrenaline (Troy Laboratories Pty Ltd, Smithfield, NSW, Australia) was injected intra-dermally. The skin was cut with a sharp 1-cm-diameter circular knife (trephine), lifted with forceps and excised with curved scissors. Two samples were fixed and stored in 10% neutral buffered formalin for future histological examination (Maddocks and Jackson 1988). The remaining two samples were stored in 1.5 mL of RNA Later (Ambion, Cambridgeshire, UK). Samples for RNA were immediately placed on ice then stored at −20°C.
Sheep conformation and subjective wool-scores protocols
Conformation and subjective wool scores were initially collected after weaning, and thereafter at approximately 6-month intervals. The subjective scoring protocols used were as recommended to industry (Visual Sheep Scores, AWI 2008), with the exception that breech scores were reversed (see below), the horn-scoring system of Dolling (1956) with subsequent modification was used. Details of the traits recorded and scoring system used are presented in Table A1, available as Supplementary Material.
Bare-area measurement protocol
Bare-area width is defined as the maximum width of bare area measured across the anus with Vernier calipers. Bare-area depth (trait = ba_depth) is a measurement taken from the base of tail to a point where the wool cover starts, or in those lambs where a pronounced bare channel extends towards the scrotum/udder, to a point deemed to be the apex of a triangle formed by tail attachment ligaments running down either side of the perineal bare area, using Vernier calipers. Bare-area vulva width (trait = ba_anus_width) is the width of bare skin measured across the vulva in ewes (or where the vulva is assumed to have been in males), using Vernier calipers.
Bare breech scoring protocol
The scoring system devised by Edwards et al. (2009) was used. In this system, the highest score (5) reflects the barest breech animal. Note that this is opposite to the system subsequently adopted by Australian Wool Innovation Ltd as the industry standard (Visual Sheep Scores brochure, AWI 2008).
Measurement of parasite-resistance traits
A single oral (challenge) infection of gastrointestinal nematode parasites was used rather than continuous dosing with small doses of larvae because of the large numbers of progeny to be sampled. Infections were terminated after response to challenge was measured so that production traits were not significantly compromised by chronic parasitism.
Parasite-challenge protocol
All lambs were drenched at weaning with levamisole (10 mg/kg; Nilverm, Coopers Animal Health, Sydney, Australia). To avoid inadvertent deaths from prolonged parasite infection, a staged challenge was given with the gastrointestinal nematode parasites Trichstrongylus colubriformis (McMaster strain) and Haemonchus contortus (Kirby strain). One month after weaning, all lambs were dosed orally with a single dose of 20 000 third-stage larvae (L3) of T. colubriformis (TcL3) in 5 mL of water. At the same time, blood was taken in Vacutainers (Beckton Dickinson, North Ryde, NSW, Australia) containing EDTA for plasma and leukocyte counts. This first infection was terminated after 5 weeks by oral administration of levamisole (10 mg/kg; Nilverm) in 2005 and after 6 weeks in 2006. One week after this second drench, all lambs were dosed orally with 8000 L3 of H. contortus (HcL3). After 5-week duration, the second infection was terminated with oral ivermectin (10 ml/kg; Cydectin, Virbac, Sydney, Australia).
Preparation of infective L3
Infective L3 from both parasites were purchased from CSIRO Livestock Industries (Chiswick, Armidale, NSW, Australia) as 100% pure worm species. The L3 were amplified in donor sheep to produce sufficient numbers and checked for purity by taxonomic differentiation. TcL3 were stored in water at 1000/mL at 4°C, while HcL3 were stored at 1000/mL at 12°C. Both stocks of L3 were stored for 4–6 weeks, before being concentrated to 10 000/mL and transported to FMFS where they were diluted to 5000 TcL3/mL or 2000 HcL3/mL with water, and administered within 24 h.
Sampling regime, sample transport and trait measurement
Blood samples (5 mL/animal) were taken from all lambs at weaning, immediately before infection with TcL3, and at the time of chemical termination of each nematode infection. Blood samples were collected into Vacutainers containing EDTA. Worm egg counts (WECs) were performed on faecal samples collected from 200 progeny of parasite sires at weaning to gain an appreciation of the resident worm populations at FMFS. Following infection, WEC was determined in faeces sampled from all lambs at 4 and 5 weeks after infection with TcL3 in 2005 and at 4, 5 and 6 weeks after infection with TcL3 in 2006 (trait = TotalTFec). Similarly, WEC was determined in faecal samples collected from each lamb at 3 and 4 weeks after the infection with HcL3 (trait = TotalHFec).
Blood and faecal samples were transported at 4°C, to reach diagnostic laboratories by the following morning. During the parasite challenge, lambs were weighed monthly and the growth rate during the period of infection was calculated by the following subtraction: final – weaning weight (trait = fec_lwt_gain).
Whole-blood parameters measured included haematocrit (packed cell volume, PCV) and haemoglobin measures, and red blood cell (erythrocyte) and manual differential white cell counts (trait = mdeos for eosinophils; trait = mdlym for lymphocytes) from samples taken on three occasions, namely before the start of infection (trait = pcv1), before infection with HcL3 (trait = pcv2) and 4 weeks after HcL3 infection (trait = pcv3). Assays were performed in a ‘Cell-dyne’ (Beckman-Coulter Laboratories, Sydney, Australia) using veterinary haematology software (Abaxis, Union City, CA, USA). Differential white cell counts were also performed on Leishman-stained smears, where on average 200 leukocytes per animal were counted. Following analysis, the remaining blood sample was frozen and stored at −20°C, for later use. Differences in PCV resulting from parasite infection were calculated by the subtraction pcv1 – pcv3.
Faecal WEC was enumerated using the McMaster faecal flotation method (Whitlock 1948), with 10% of samples being counted by a second technician to ascertain operator variation. Correlations between counts performed on the same samples by different operators were >85%. For each sampling time, a pool of 10 faecal samples was incubated to L3, to determine the proportions of nematodes in the pool. In the weaning samples, these were principally Ostertagia (Telodorsagia) circumcincta and Nematodirus species, while >99% of L3 in samples taken after infection were the infecting nematode.
Measurement of carcass and meat traits
Sample collection
Numbers of wether progeny slaughtered per sire family are shown in Table 6. Wethers were grown to a minimum target liveweight of 38 kg before slaughter. Kill groups were selected so that there was no confounding of kill day with sire family. The final kill groups in each year (Kills 8 and 20) were made on the basis of age, and before permanent tooth eruption. A final liveweight was measured on each animal before transport to the abattoir (trait = kill_wt). Where possible, all animals were processed at the same abattoir on the same day of the week to minimise kill-day effects. As part of normal processing, all carcasses were electrically stimulated before being moved to the chiller. One cohort of animals (Kill 4) was processed at a different abattoir, where electrical stimulation was not applied. Hot carcass weight was measured before carcasses entered the chiller (trait = hcwt). After chilling overnight, all carcasses were transported to the Meat Research and Training Centre (Werribee, Victoria, Australia, for subsequent measurements. Cold carcass weight was recorded (trait = ccwt). The fat depth at the GR site (over the 12th rib, 110 mm from the backline) was measured using a graduated GR knife (trait = gr). Each carcass was then split along the spine (cranial to caudal) with a band saw. The left side of the carcass was weighed and scanned using dual-emission X-ray (DXA) for body composition analysis. The entire m. longissimus dorsi (loin) was removed from the right side and cleaned of fascia. The muscle was then partitioned from cranial to caudal ends as follows. A 5-mm slice was taken ~3 cm from the cranial end and processed for frozen histology (described below); the cranial 3-cm trim was vacuum-packed and frozen at −20°C. A sample of 70 g was vacuum-packed and frozen at −20°C for measurement of compression (trait = comp); a further 70 g was vacuum-packed and frozen at −20°C for measurement of shear force at 1 day post-slaughter (trait = wb_1); 70 g was vacuum-packed and stored at 4°C for 4 days, before being frozen at −20°C for measurement of shear force 5 days post-slaughter (trait = wb_5). In a limited number of cases, a further 40–50 g were taken and frozen at −20°C for subsequent analysis of intra-muscular fat content (trait = imf).
|
Measurement of carcass traits
Eye muscle area (EMA) was determined on the left-side loin of each carcass after cutting between the 12th and 13th rib. A trace of the perimeter of the loin eye muscle was drawn on a sheet of clear plastic. The loin trace area was determined by computerised planimetry using Image Pro Plus 4.1 (Media Cybernetics Inc., Bethesda, MD, USA) (trait = cEMA) and verified against the area calculated using length and width of the cross-section of the loin (where EMA = length × width × 0.765). Fat depth (mm) was measured between the 12th and 13th rib with a ruler (trait = cFAT).
Carcass composition by DXA
Dual-energy X-ray absorptiometry (i.e. DXA) was performed at the Meat Research and Training Centre. A half-carcass from each animal was cut into primals (shoulder, loin, belly and leg) and each primal was weighed. The chemical composition of the primal cuts was determined using a Hologic QDR4500 DXA instrument (Dunshea et al. 2007). Chemical components were estimated as follows: lean tissue = crude protein (Kjeldahl N × 6.25)% / 0.2021; fat tissue = chemical fat measured by chloroform (CHCl3) extraction; and bone mineral content = ash remaining after combustion at 600°C of each primal cut. In the 64 lambs used for calibration of chemical composition of each primal cut, the primal cuts were broken down to retail cuts by skilled butchers, weighed and used to generate a set of equations from which to predict retail cut weight from DXA output (Table 7).

|
Calibration/prediction equations relating DXA measurements to measured chemical composition to retail weight were generated for a sample of 64 half-carcasses (and each primal from each of the 64 carcasses) over the full range of carcass weight and fatness observed in the study. The prediction equations developed using this dataset are shown in Table 7. Prediction equations were applied to DXA data to estimate total weight of lean (trait = total_lean), total weight of fat tissue (trait = total_fat) and total bone mineral content (trait = total_bmc), as well as for total carcass weight (dxa_c_wt) and for retail yield (trait = retail_yield) for each carcass.
Objective measures of meat quality
Meat colour and ultimate pH
Surface colour was measured following exposure of the cut surface to air (blooming) for 20 min, with the following two instruments: a BYK-Gardner Colour Spectrophotometer (BYK-Gardner GMBh, Sphere Spin Model 6830, Geretsried, Germany) and a Hunter Laboratory Mini Scan XE Plus (Cat. No. 6352, Model 45/0-L, Hunter Associates Laboratory Inc., Reston, VA, USA). For the Hunter Laboratory, the light source was set at ‘C’, with the aperture set to 10. Both instruments were calibrated according to manufacturer’s instructions. Each sample was measured three times to report the average of L*,a*,b* tri-stimulus scale where ‘L’ is a measure of darkness–lightness (trait = l_hlab), ‘a’ (trait = a_hlab) a measure of redness–greenness and ‘b’ (trait = b_hlab) a measure of yellowness–blueness.
Ultimate pH (trait = pHu) of the loin was measured 24 h post-slaughter with a digital pH meter (Model WP-80 TPS, Springwood, NSW, Australia), with a combination electrode (glass body with a spear tip; Model IJ44C Ionode, Tennyson, Qld, Australia) calibrated according to manufacturers instruction.
Texture measurements
Weighed loin samples (~65 g) were prepared in sealed bags for estimating cooking loss after 35 min in a water bath at 70°C. The difference in weight after cooking was expressed as a percentage (trait = cookloss).
Cooked samples were stored overnight at 1°C, before objective measures of tenderness were performed. Warner–Bratzler (WB) shear force and compression (trait = comp) was estimated on a Lloyd Instruments LRX Materials Testing Machine fitted with a 500N load cell (Lloyd Instruments Ltd, Hampshire, UK), as previously described (Bouton et al. 1971; Bouton and Harris 1972). The sample was oriented such that the long axis of the myofibres was perpendicular to the shear force as described by Perry et al. (2001). The shear force was recorded as the mean of six samples from 1-day-aged (trait = wb_1) and 5-day-aged (trait = wb_5) samples that had been stored at 2−4°C before cooking.
Muscle fibre characteristics
Loin muscle samples were mounted onto cork blocks in a transverse orientation using tragacanth gum (5%w/v). The tissue block was snap-frozen in liquid nitrogen-quenched isopentane and stored at −80°C until required. Serial sections (8 µm) of frozen tissue were collected onto slides and stored at −20°C until required.
Histochemistry
Tissue sections were stained to detect activity of mitochondrial reduced nicotinamide adenine dinucleotide (NADH) as indicated by positive nitro-blue tetrazolium reaction (Vuocolo et al. 2007). The phenotype of an individual myofibre was inferred from the intensity of the staining; e.g. a darker stain was considered more oxidative. A series of digital images was collected randomly from each stained section at ×400 magnification. Collection of images proceeded until 10 complete images were collected, with transverse myofibres filling the entire image area. Images were non-contiguous. All images were collected in 8-bit grayscale, and used for estimation of cross-sectional area of myofibres, number of myofibres and oxidative capacity of muscle as described below.
Fibre cross-sectional area and number
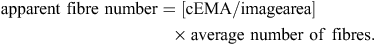
All image analysis was completed using Image Pro Plus Version 4.2.1 (Media Cybernetics Inc., Bethesda, MD, USA). To calculate the average cross-sectional area (CSA, trait = csa) of muscle fibres in the loin, the number of fibres was manually counted in a given area. The number of fibres was then divided by the total image area analysed giving a final value for CSA in μm2. Fibre number (trait = fibre_no) was calculated by first calculating the number of digital images (image area) that would cover the EMA (cEMA) and then multiplying by the average number of fibres in the digital images (image area) using the following formula:
Oxidative capacity
An indirect measure of oxidative capacity was developed by using a histochemical stain specific for mitochondria. The basis for this technique was that the darker the staining across the entire section, the more mitochondria and thus the greater the oxidative nature of the muscle sample. From the pixel-intensity distribution data, the mode (pixel intensity with highest frequency) was calculated (trait = peakpixel).
Measurement of reproductive traits
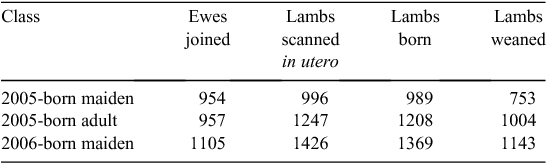
Ewes born 2005 were naturally joined to rams in 2007 and 2008, while 2006-born lambs were naturally joined to rams in 2008. Mature rams from terminal sire breeds were used as syndicates (~15 rams/1000 ewes). Rams were allowed access to ewes for 6 weeks. The number of lambs in utero was determined by ultrasound scanning of pregnant ewes between 50 and 80 days after joining. For 2005-born ewes as maidens and adults, lambing took place over 40 days and 38 days, respectively. For 2006-born ewes as maidens, lambing took place over 43 days. Lambing ewes were closely supervised and traits were recorded on both the lamb and the ewe. Traits measured at lambing included number of lambs born (for each ewe), birthweight of lamb, maternal behaviour score and, if a lamb was found dead on a lambing round, the reason for death, if known. Presence at marking and at weaning was used to estimate the number of lambs weaned per ewe. The number of records available for the number of lambs scanned in utero, born (both alive and dead) and alive at weaning is summarised in Table 8.
|
Reproductive traits are those used in the Australian sheep national genetic information and evaluation service (Sheep Genetics, http://www.sheepgenetics.org.au, verified 31 January 2012) and are as follows in Year 1 and Year 2: the number of lambs scanned at ~60 days post-conception (trait = nls1 for maiden ewes, nls2 for adult ewes), born (trait = nlb1 for maiden ewes, nlb2 for adult ewes) and weaned (trait = nlw1 for maiden ewes and nlw2 for adult ewes). Counts are for each ewe joined. A ewe could, thus, have a record of zero. Birthweight (trait = bwt) and weaning weight (trait = wn_wt) were recorded on lambs at birth or weaning. The traits were summarised as traits of the dam after adjustment for sex, year and age. In addition, fertility (ewes lambed/ewes joined), fecundity (lambs born/ewes lambed) and lamb survival (lambs weaned/lambs born) were expressed as percentages and derived for each sire of dams.
Statistical analyses
Summary statistics for all traits (overall and within-sire family were generated using R Version 2.10.1 (R for Statistical Computing 2009). In preparation for analysis of associations between phenotypes and single nucleotide polymorphisms (SNPs) (by methods described in Hayes et al. 2010), residuals were calculated taking account of the following fixed effects for all traits except reproduction: year of birth, sex, birth type and rear type. In addition, for carcass and parasite traits, age at trait recording or slaughter and management or slaughter groups were fitted. Additional fixed effects fitted to wool traits were age at recording and to reproduction traits were join year and bdt1 or bdt2. Correlations were computed in R using residuals. Sire was not fitted in the summary data reported here. In the 2005-born ewes, it was not possible to account for birth type and rear type. Dam breed was derived retrospectively using imputed maternal alleles from the SNP analysis. Sire identity (of progeny) was corrected on the basis of paternal alleles obtained from genotyping the FMFS mapping flock (>4200 sheep were genotyped) and all sires used with the Illumina Ovine 50SNP bead chip (Illumina Inc., San Diego, CA, USA). More than 48640 SNP markers passed quality control (www.sheephapmap.org, verified 31 January 2012).
Results
The purpose of the present study was to generate and phenotype sufficient progeny per sire to permit the intended genetic and genomic analyses. This was achieved. The results of associations between genotypes and phenotypes will be published elsewhere (see e.g. Kemper et al. 2011).
The number of progeny weaned was 2507 and 2748 in 2005 and 2006, respectively. The total size of the FMFS mapping flock was 5255; of these, 2360 castrated male progeny were slaughtered and measured for the range of carcass, meat and muscle traits described above (Table 5). The number of observations, mean and standard deviation for each trait for each sire family, and overall, are shown in Supplementary Material Tables A2–A7.
Phenotypic correlations
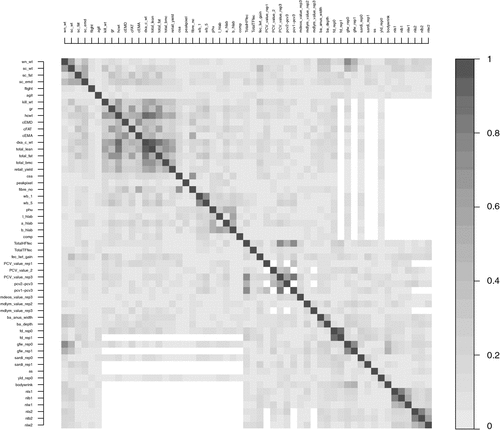
Phenotypic correlations within trait classes are shown in Tables 9–14 for live-animal, carcass and meat, parasite-resistance, wool and reproduction traits. A summary of the phenotypic correlations among traits shown in Tables 9–14, across all trait classes, is shown in Fig. 2 (Supplementary Material Table A8 shows correlations and P-values for all traits). Not surprisingly, the strongest phenotypic correlations were within, rather than across, trait classes.
|
|
Carcass and meat traits
As expected, measures of weight, fat thickness and eye muscle depth were significantly correlated in live animals (Table 9), and in the carcass (Table 10). However, a significant phenotypic relationship between muscle fibre number and EMA (r = 0.54, P < 0.001) and eye muscle depth (r = 0.34, P < 0.001) has not been observed previously. Muscle fibre number was negatively correlated with fibre cross-sectional area (r = 0.69, P < 0.001).

|

|
Parasite resistance
It was expected that there would be a significant phenotypic correlation between total faecal WEC (TotalHFec) following challenge with Haemonchus contortus (Hc) and response in PCV (pcv2 – pcv3) in blood to infection (Table 12).

|
Fixed-duration infections with single-dose oral infections with T. colubriformis (Tc, 5–6 weeks) and H. contortus (Hc, 4–5 weeks) produced the expected wide range of WECs within sires and between sires towards the end of the challenge period of 3–4 weeks (Supplementary Material Table A6). WECs from progeny from Merino and non-Merino sires were not significantly different. Repeatability of the WEC assay within laboratories and operators in both years was >0.85. Due to management and seasonal differences between the successive lambings in 2005 and 2006, there was a significant (P < 0.0001) difference in WEC between the years. Significant positive correlations (r2 = 0.14, P < 0.001) were exhibited between individual and sire-group WECs for both parasites, while stronger correlations (r2 = 0.72; P < 0.0001) were found between pcv_2 – pcv_3 (haematocrit drop) and TotalHFec (total WEC, H. contortus). In each year, a group of lambs reached slaughter weight by early December (325 in 2005 and 591 in 2006) and did not receive any Hc challenge.
Overall, WECs following Tc and Hc infections (TotalTFec and TotalHFec, respectively) were significantly and negatively correlated (r = –0.08, –0.15; P < 0.0001) with liveweight gain (fec_lwg_gain) during the period from weaning to the end of the parasite challenge period. Blood leucocyte counts and eosinophil counts were not significantly correlated with WEC during the challenge period.
Wool-production traits
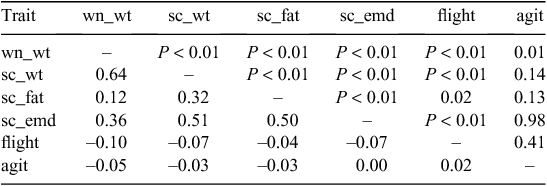
While peri-anal bare area depth and width were strongly correlated, surprisingly, they were poorly related to the SARDI bare area score. Bare area dimensions were moderately related (positively) to greasy fleece weight. Body wrinkle was strongly related to greasy fleece weights but poorly to mean fibre diameter (Table 13).

|
Reproduction traits
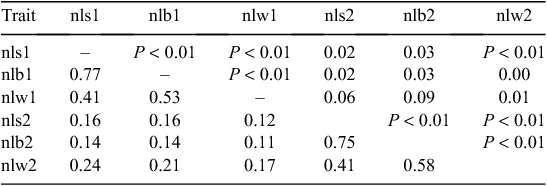
As expected, there were very strong positive phenotypic correlations between nls and nlb (0.90 both for ewes as maidens and for ewes as adults, after adjusting for sire), and strong, positive phenotypic correlations between nlb and nlw, and to a lesser extent, between nls and nlw (Table 14).
|
Across-trait classes
There were some significant correlations among traits across trait classes (Fig. 2; see Table A8 for correlations and P-values). For example, there was a positive correlation between both gfw_rep0 and gfw_rep1 and wn_wt and sc_wt, suggesting that those that grew quickest (i.e. larger animals with heavier mature weight) had more wool. The modest correlation between fec_wt_gain and sc_wt would suggest that heavier animals continue to grow faster than their lighter peers during worm challenge and are thus more resilient. High correlations (r = 0.47–0.74) were observed between fec_lwt_gain and PCV during worm challenge. In addition, high correlations (r = 0.5–0.9) were observed for PCV during worm infection with muscle shear force at Day 1 (wb_1) and Day 5 (wb_5) after slaughter. These observations suggest that animals that were more susceptible to change in PCV during parasite challenge may produce tougher meat.
With respect to the reproduction traits, number of lambs scanned, born and weaned, there were positive correlations with wn_wt, sc_wt and fec_wt_gain, which suggest that larger lambs were more resilient to the effects of infestation by gastrointestinal nematode parasites.
Discussion
The purpose of the present study was to provide data on a wide range of traits that affect all production dimensions of Australian sheep. The family sizes were selected to ensure that if genes of a moderate to major effect (size of effect >0.3 phenotypic standard deviations) were present, they could be detected and their location dissected to a chromosomal region of less than 10% of the length of a chromosome. During the course of the study, there was a paradigm shift from discovery of genes of a modest to major effect to the use of many SNP markers to estimate genome-wide breeding values (Meuwissen et al. 2001). The population structure used here (many progeny/few sires) was less suitable for estimation of genome-wide breeding values than structures involving many sires with fewer progeny per sire, as subsequently used in the Australian Sheep Industry CRCs Information Nucleus (Fogarty et al. 2007). However, the datasets are complementary especially with measures of meat quality (Warner et al. 2010; Mortimer et al. 2010) and our expectation is that when used together, they provide the Australian sheep industry with a rich ground for discovery of markers that can enhance the effectiveness of selection and new genes affecting traits of commercial interest (e.g. Daetwyler et al. 2010; Kemper et al. 2011). They will also provide information about experimental design that will provide the framework for future studies in this field.
The study was designed for the purposes of providing the data necessary for QTL discovery, but because of the number of traits measured on each animal, the data provide a rare opportunity to investigate phenotypic correlations between a very wide range of traits in animals raised in the same environment. It was interesting, but perhaps not surprising, that the strongest phenotypic correlations were among traits in the same trait classes. Safari et al. (2005) summarised data from several publications (populations and environments) to that time and reported a range of phenotypic (and genetic) correlations between wool, growth, meat and reproduction traits that would support this general observation.
Consecutive infections with L3 larvae of T. colubriformus and H. contortus generated wide phenotypic variation in key parasite-resistance measures (WEC, change in PCV and LWtG). The level of significance and the direction of correlations exhibited between TFec and HFec, and change in PCV during infection (pcv1 – pcv3) and HFec were consistent with and confirm previous reports (Barger 1988; Adams et al. 1989), suggesting that the relationships were valid. Of those sires selected for parasite resistance (e.g. sires P1, P2, P3, P4 and GR), some did not fulfill expectations, in that phenotypic measures of WECs and blood parameters were not necessarily superior to those exhibited by sires with lower parasite Australian Sheep Breeding Values.
We recognise the potential for a single dose of infective larvae to overwhelm constitutive defences that restrict parasite establishment (Emery 1996), which could bias genetic analyses for innate immunity in favour of acquired immune responses. Nonetheless, for practical purposes, we chose to use a single-dose infection because it was simpler to implement. The alternative of repeated dosing with low numbers of L3 (continuous infection, similar to field challenge) would have required regular mustering of weaners for repeated dosing, with consequent detrimental effects on performance. In addition, the protocol conformed with infection regimes used for concurrent genomic studies in experimental resource flocks (Ingham et al. 2008) and did not compromise selection for resistance, as demonstrated in previous research (Windon and Dineen 1981).
With respect to meat and muscle traits, sire families with EMA greater than the population average were below average for muscle fibre CSA (see Supplementary Material Appendix A5). It had previously been thought that an increase in CSA of muscle fibres in the loin was the driving mechanism for increased EMA (Rehfeldt et al. 2004). The data reported here do not support this, instead showing smaller variation in the muscle-fibre CSA than the variation in the number of muscle fibres. The correlation between fibre number and EMA was stronger (r = 0.54) than the correlation of EMA with CSA (r = 0.16). Furthermore, there were differences in the mean CSA between years, with lambs born in the first year having a significantly lower average CSA with a larger variance, than those born in the second year. This is likely explained by differences between years in the level of nutrition experienced during early life (to weaning and for 3 weeks following weaning). For example, lambs born in the first year (2005) experienced poorer seasonal conditions than did those born in the second year. Indeed, a positive relationship between the liveweight of an animal and the CSA of its muscles has been documented previously (Yamaguchi et al. 1993).
The means, variances and correlations observed for the reproduction traits were consistent with other published estimates (Safari et al. 2005; Brien et al. 2010). Although the study was not designed, nor suitable, for breed comparisons (having too few, non-randomly chosen sires of each breed), sire means by breed show the expected trends, with lower values for number of lambs scanned, born and weaned in Merino ewes. The consistency with expectation and measurable variation between and within sire families provides confidence that the phenotypes recorded in the present study are suitable for use in further genomic studies.
The objective of achieving a wide variance in wool and wool-related body traits, such as bareness and body wrinkle, was achieved, as indicated by the between- and within-sire variances in Supplementary Material Table A7. The phenotypic correlations between wool and traits and wool-related body traits were generally in line with those reported previously (Mortimer 1987; Davis and McGuirk 1987). The strong positive phenotypic correlation between body wrinkle score and greasy fleece weight is in accord with the relationship described by Hatcher et al. (2009) and is relevant to the breeding of plain-bodied sheep with resistance to fly strike. While the positive relationships observed between bare area dimensions and greasy fleece weight are consistent with selection for plainer animals with heavier fleeces (Hatcher et al. 2009), the weak correlations observed between the subjectively-scored bare area and objectively measured bare area dimensions are difficult to explain.
The initial idea of generating large family groups of progeny within the sheepGENOMICS flock was to accommodate a paradigm involving discovery of QTL of moderate–large effect affecting traditional and new production traits. This approach worked well in that a mutation at a single locus for a horns/polled trait in Merinos was identified using phenotype data generated from this flock. A single DNA marker that predicts genotype for horns/polled with 99.8 accuracy was identified from the SNP data (Dominik et al. 2012). A myostatin gene known to affect muscling (Kijas et al. 2007) and known to be segregating in the FMFS population was identified, albeit with precision of ~15 cM. The lower precision of detecting location for a gene known to affect muscling (a multi-locus trait) was not a function of poor SNP density in the region but rather a consequence of the low number of recombinations observed around particular loci.
For most traits investigated, the effect of individual markers was small. Therefore, we tried an approach called genomic selection (Goddard and Hayes 2009). This approach used all 48 640 markers simultaneously to predict breeding values. The accuracy of the genomic breeding values (GEBVs) was assessed in Merino, maternal and terminal industry sires. The accuracies of the GEBV for Merinos were moderate for most traits and high for a few of them. The accuracy of the GEBV for WEC traits was particularly encouraging, given the low heritability of this trait (see also Kemper et al. 2011). However, for families derived from terminal and maternal sires, accuracies of the GEBV were low, reflecting the fact that FMFS is largely based on Merino genetics. When the data described here are combined with those generated through the Sheep CRC Information Nucleus (Fogarty et al. 2007), where there are more sires with fewer progeny per sire, there is an opportunity to increase accuracy of GEBVs for new and important traits. Moreover, the larger combined resource is more likely to provide an opportunity to discover new QTL of moderate to large effect that will be of value to the Australian sheep industry for years to come.
Estimates of parameters for GEBVs for traits derived from the FMFS data, such as parasite resistance, are beginning to emerge (Kemper et al. 2011). An additional benefit of the FMFS design with many progeny per sire has been the ability to use the population for linkage mapping of SNPs to a higher accuracy than possible with any other resource (J. F. Maddox, pers. comm.). This linkage mapping has greatly facilitated the assembly of the first reference genome for sheep, which can be found at http://www.livestockgenomics.csiro.au/sheep/oar2.0.php (verified 31 January 2012).
Acknowledgements
This work would not have been possible without the financial support of Meat & Livestock Australia and Australian Wool Innovation Limited under the jointly funded Sheep Genomics Program. The following individuals provided semen from key rams for use in the experiment: George Carter, Robert Mortimer, Kim Barnett, Guy Bowen, Andrew Burgess, Don Peglar, Graeme Golder, Neil Johnson, Phil Clothier, John Karlson, Lynton Arney, Jim Litchfield, Ian Purvis, Julius van der Werf and Niel Smith. We especially thank staff at the Falkiner Memorial Field Station for their tireless work to implement the protocols described in this paper: Nigel Strutt, George Nichols, John Murray, Alastair Donaldson and numerous contractors. Without the input of all the above, the work described here would not have taken place.
References
Adams DB, Anderson BH, Windon RG (1989) Cross-immunity between Haemonchus contortus and Trichostrongylus colubriformis in sheep. International Journal for Parasitology 19, 717–722.| Cross-immunity between Haemonchus contortus and Trichostrongylus colubriformis in sheep.Crossref | GoogleScholarGoogle Scholar | 1:STN:280:DyaK3c%2FnslOhtw%3D%3D&md5=e3cc4fb134aafa24769b7c2ffeea2474CAS |
AWI (2008) ‘Visual sheep scores.’ (Australian Wool Innovation Ltd: Sydney)
Barger IA (1988) Resistance of young lambs to Haemonchus contortus infection, and its loss following anthelmintic treatment. International Journal for Parasitology 18, 1107–1109.
| Resistance of young lambs to Haemonchus contortus infection, and its loss following anthelmintic treatment.Crossref | GoogleScholarGoogle Scholar | 1:STN:280:DyaL1M7it1CitQ%3D%3D&md5=2e0b0a5b2efead347bca9cb8c540825eCAS |
Baxter BP, Brims MA, Teasdale DC (1993) The optical fibre diameter analyser: new technology for the wool industry. Wool Technology and Sheepbreeding 40, 131–134.
Bouton PE, Harris PV (1972) A comparison of some objective methods used to assess meat tenderness. Journal of Food Science 37, 218–221.
| A comparison of some objective methods used to assess meat tenderness.Crossref | GoogleScholarGoogle Scholar |
Bouton PE, Harris PV, Shorthose WR (1971) Effect of ultimate pH upon the water-holding capacity and tenderness of mutton. Journal of Food Science 36, 435–439.
| Effect of ultimate pH upon the water-holding capacity and tenderness of mutton.Crossref | GoogleScholarGoogle Scholar | 1:CAS:528:DyaE3MXhtl2ltr0%3D&md5=dad3c30117078c44776faca6c1270caaCAS |
Brien FD, Hebart ML, Smith DH, Hocking-Edwards JE, Greef JC, Hart KW, Refshauge G, Bird-Gardiner TL, Gaunt G, Behrendt R, Robertson MW, Hinch GN, Geenty KG, van der Werf JHJ (2010) Opportunities for genetic improvement of lamb survival. Animal Production Science 50, 1017–1025.
| Opportunities for genetic improvement of lamb survival.Crossref | GoogleScholarGoogle Scholar |
Burrow HM, Seifert GW, Corbet NJ (1988) A new technique for measuring temperament in cattle. Proceedings of the Australian Society of Animal Production 17, 154–157.
Crawford AM (2001) A review of QTL experiments in sheep. Proceedings of the Association for Advances in Animal Breeding and Genetics 14, 33–38.
Daetwyler HD, Hickey JM, Henshall JM, Dominik S, Gredler B, van der Werf JHJ, Hayes BJ (2010) Accuracy of estimated genomic breeding values for wool and meat traits in a multi-breed sheep population. Animal Production Science 50, 1004–1010.
| Accuracy of estimated genomic breeding values for wool and meat traits in a multi-breed sheep population.Crossref | GoogleScholarGoogle Scholar |
Davis GP, McGuirk BJ (1987). Genetic relationships between clean wool weight, its components and related skin characters. In ‘Merino improvement programs in Australia. Proceedings of a national symposium, Leura, NSW’. (Ed. BJ McGuirk) pp. 189–206. (Australian Wool Corporation: Melbourne)
Dolling CHS (1956) The inheritance of horns in sheep. Proceedings of the Australian Society of Animal Production 1, 161–164.
Dominik S, Henshall JM, Hayes BJ (2012) Identification of a SNP on sheep chromosome 10 which is highly predictive of Poll in Australian Merino. Animal Genetics
| Identification of a SNP on sheep chromosome 10 which is highly predictive of Poll in Australian Merino.Crossref | GoogleScholarGoogle Scholar |
Dunshea FR, Suster D, Eason PJ, Warner RD, Hopkins DL, Ponnampalam EN (2007) Accuracy of dual energy X-ray absorptiometry, weight, longissimus lumborum muscle depth and GR fat depth to predict half carcass composition in sheep. Australian Journal of Experimental Agriculture 47, 1165–1171.
| Accuracy of dual energy X-ray absorptiometry, weight, longissimus lumborum muscle depth and GR fat depth to predict half carcass composition in sheep.Crossref | GoogleScholarGoogle Scholar | 1:CAS:528:DC%2BD2sXhtVOisb3K&md5=931a4932cf9fc0c804510e4f89bca47bCAS |
Edwards NM, Hebart M, Hynd PI (2009) Phenotypic and genotypic analysis of a barebreech trait in Merino sheep as a potential replacement for surgical mulesing. Animal Production Science 49, 56–64.
| Phenotypic and genotypic analysis of a barebreech trait in Merino sheep as a potential replacement for surgical mulesing.Crossref | GoogleScholarGoogle Scholar |
Emery DL (1996) Vaccination against worm parasites of livestock. Veterinary Parasitology 64, 31–45.
| Vaccination against worm parasites of livestock.Crossref | GoogleScholarGoogle Scholar | 1:STN:280:DyaK2s%2FkvVKgsw%3D%3D&md5=05ea527d58d04e796f1b6390476fc0b1CAS |
Fogarty NM, Banks RG, van der Werf JHJ, Gibson JP (2007) The information nucleus – a new concept to enhance sheep industry genetic improvement. Proceedings of the Association for Advances in Animal Breeding and Genetics 17, 29–32.
Gilmour AR, Luff AF, Fogarty NM, Banks R (1994) Genetic parameters for ultrasound fat depth and eye muscle measurements in live poll Dorset sheep. Australian Journal of Agricultural Research 45, 1281–1291.
| Genetic parameters for ultrasound fat depth and eye muscle measurements in live poll Dorset sheep.Crossref | GoogleScholarGoogle Scholar |
Goddard ME, Hayes BJ (2009) Mapping genes for complex traits in domestic animals and their use in breeding programs. Nature Reviews. Genetics 10, 381–391.
| Mapping genes for complex traits in domestic animals and their use in breeding programs.Crossref | GoogleScholarGoogle Scholar | 1:CAS:528:DC%2BD1MXmtVKrsLw%3D&md5=5318e6beaf602f17794e33ee2b300564CAS |
Goddard M, van der Werf J, Henshall J (2003) Final report to MLA/AWI on design of gene mapping experiments. Report to Meat & Livestock Australia, Sydney.
Greeff JC, Schlink AC, Dowling ME (2005) Inheritance of yarn shrinkage of Merino wool. Proceedings of the Association for the Advancement of Animal Breeding and Genetics 16, 318–321.
Hatcher S, Atkins KD, Thornberry KJ (2009) Breeding plain-bodied fine wools – no problem! Association for the Advancement of Animal Breeding and Genetics 18, 330–333.
Hayes BJ, Henshall J, Dominik S, van der Werf J (2010) Genomic breeding values and genome wide association in the Falkiner Flock – SheepGenomics biostatistics support. Final report to Meat & Livestock Australia on Project SGP561, Sydney.
Ingham A, Reverter A, Windon R, Hunt P, Menzies M (2008) Gastrointestinal nematode challenge induces some conserved gene expression changes in the gut mucosa of genetically resistant sheep. International Journal for Parasitology 38, 431–442.
| Gastrointestinal nematode challenge induces some conserved gene expression changes in the gut mucosa of genetically resistant sheep.Crossref | GoogleScholarGoogle Scholar | 1:CAS:528:DC%2BD1cXitVeitrc%3D&md5=1cc1f1ad8ad0d499cc7412d6be4a592fCAS |
Kemper K, Emery DL, Bishop SC, Oddy H, Hayes BJ, Dominik S, Henshall JM, Goddard ME (2011) The distribution of SNP marker effects for faecal worm egg count in sheep, and the feasibility of using these markers to predict genetic resistance to worm infections. Genetical Research 93, 203–219.
| The distribution of SNP marker effects for faecal worm egg count in sheep, and the feasibility of using these markers to predict genetic resistance to worm infections.Crossref | GoogleScholarGoogle Scholar | 1:CAS:528:DC%2BC3MXmtlWrtbc%3D&md5=4381ff9397178a39fcd390c7c0ca4e3fCAS |
Kijas JW, McCulloch R, Hocking-Edwards JE, Oddy VH, Lee SH, van der Werf J (2007) Evidence for multiple allelles affecting muscling and fatness at the Ovine GDF8 locus. BMC Genetics 8, 80
| Evidence for multiple allelles affecting muscling and fatness at the Ovine GDF8 locus.Crossref | GoogleScholarGoogle Scholar |
Maddocks IG, Jackson N (1988) ‘Structural studies of sheep, cattle and goat skin.’ (CSIRO Division of Animal Production: Sydney)
Marshall K, van der Werf J, Maddox JF, Graser HU, Zhang Y, Walkden-Brown SW, Kahn L (2005) A genome scan for quantitative trait loci for resistance to the gastrointestinal parasite Haemonchus contortus in sheep. Proceedings of the Association for the Advancement of Animal Breeding and Genetics 16, 115–118.
Meuwissen TH, Hayes BJ, Goddard ME (2001) Prediction of total genetic value using genome-wide dense marker maps. Genetics 157, 1819–1829.
Mortimer SI (1987) Australian estimates of genetic parameters for wool production and quality traits. In ‘Merino improvement programs in Australia’: Proceedings of a national symposium, Leura, NSW. (Ed. BJ McGuirk) pp. 159–176. (Australian Wool Corporation: Melbourne)
Mortimer SI, van der Werk JHJ, Jacob RH, Pethick DW, Pearce KL, Warner RD, Geesink GH, Hocking Edwards JE, Gardiner GE, Ponnampalam EN, Kitessa SM, Ball AJ, Hopkins DL (2010) Preliminary estimates of genetic parameters for carcass and meat quality traits in Australian sheep. Animal Production Science 50, 1135–1144.
| Preliminary estimates of genetic parameters for carcass and meat quality traits in Australian sheep.Crossref | GoogleScholarGoogle Scholar |
Murphy PM, Purvis IW, Lindsay DR, le Neindre P, Poindron P (1994) Measures of temperament are highly repeatable in Merino sheep and some are related to maternal behaviour. Proceedings of the Australian Society of Animal Production 20, 247–250.
Perry D, Shorthose WR, Ferguson DM, Thompson JM (2001) Methods used in the CRC program for the determination of carcass yield and beef quality. Australian Journal of Experimental Agriculture 41, 953–957.
| Methods used in the CRC program for the determination of carcass yield and beef quality.Crossref | GoogleScholarGoogle Scholar |
R for Statistical Computing (2009) ‘R version 2.10.1 (2009-12-14). (The R Foundation for Statistical Computing)
Rehfeldt C, Fiedler I, Stickland NC (2004) Number and size of muscle fibres in relation to meat production. In ‘Muscle development of livestock animals: physiology, genetics and meat quality’. (Eds MFW te Pas, ME Everts, HP Haagsman) pp. 1–38. (CABI Publishing: Cambridge, MA)
Robinson N, Goddard M (2002) Review of sheep gene mapping resource flocks in Australia. Report to Meat & Livestock Australia, Sydney.
Safari E, Fogarty NM, Gilmour AR (2005) A review of genetic parameter estimates for wool, growth, meat and reproduction traits in sheep. Livestock Production Science 92, 271–289.
| A review of genetic parameter estimates for wool, growth, meat and reproduction traits in sheep.Crossref | GoogleScholarGoogle Scholar |
Stobart RH, Townsend RS, Russell WC (1998) Evaluation of the Sirolan for measuring wool fiber diameter and standard deviation. Sheep & Goat Research Journal 14, 168–172.
Vuocolo T, Byrne K, White J, McWilliam S, Reverter A, Cockett NE, Tellam RL (2007) Identification of a gene network contributing to hypertrophy in callipyge skeletal muscle. Physiological Genomics 28, 253–272.
| Identification of a gene network contributing to hypertrophy in callipyge skeletal muscle.Crossref | GoogleScholarGoogle Scholar | 1:CAS:528:DC%2BD2sXit1ajt7k%3D&md5=654578fd32bde6d9571c56cf6ed63c02CAS |
Warner RD, Jacob RH, Hocking Edwards JE, McDonagh M, Pearce K, Geesink G, Kearney G, Allingham P, Hopkins DL, Pethick DW (2010) Quality of lamb meat from the information nucleus flock. Animal Production Science 50, 1123–1134.
| Quality of lamb meat from the information nucleus flock.Crossref | GoogleScholarGoogle Scholar |
Whitlock HV (1948) Some modifications of the McMaster helminth egg counting technique and apparatus. Journal of the Council for Scientific and Industrial Research in Australia 21, 177–180.
Windon RG, Dineen JK (1981) The effect of both sire and dam selection on the response of Fl generation lambs to vaccination with irradiated Trichostrongylus colubriformis larvae. International Journal for Parasitology 11, 11–18.
| The effect of both sire and dam selection on the response of Fl generation lambs to vaccination with irradiated Trichostrongylus colubriformis larvae.Crossref | GoogleScholarGoogle Scholar | 1:STN:280:DyaL3M7ptFWmtQ%3D%3D&md5=0709f319f582386d40d1bb617d1e5974CAS |
Yamaguchi A, Horio Y, Sakuma K, Katsuta S (1993) The effect of nutrition on the size and proportion of muscle fibre types during growth. Journal of Anatomy 182, 29–36.