

Effects of available nutrition and sire breeding values for growth and muscling on the development of crossbred lambs. 1: Growth and carcass characteristics
R. S. Hegarty A G , C. Shands B , R. Marchant C , D. L. Hopkins D , A. J. Ball E and S. Harden FA Beef Industry Centre of Excellence, NSW Department of Primary Industries, Armidale, NSW 2351, Australia.
B NSW Department of Primary Industries, Glen Innes ARAS, Glen Innes, NSW 2370, Australia.
C NSW Department of Primary Industries, Armidale, NSW 2350, Australia.
D NSW Department of Primary Industries, Centre for Sheep Meat Development, Cowra, NSW 2794, Australia.
E Meat and Livestock Australia, Armidale, NSW 2351, Australia.
F NSW Department of Primary Industries, Tamworth Agricultural Institute, Tamworth, NSW 2340, Australia.
G Corresponding author. Email: roger.hegarty@dpi.nsw.gov.au
Australian Journal of Agricultural Research 57(6) 593-603 https://doi.org/10.1071/AR04275
Submitted: 12 November 2004 Accepted: 18 June 2005 Published: 20 June 2006
Abstract
The growth and development of 387 crossbred lamb progeny from 9 Poll Dorset sires representing muscle (M), control (C), and growth (G) sire-types was studied. Sires were selected on the basis of their LAMBPLAN estimated breeding values (EBVs) for post-weaning growth (PWWT) and depth of loin muscle (PEMD). Lambs were provided with either LOW or HIGH levels of available grazing nutrition from 10 days of age onwards. Liveweight gain (LWG) throughout the study was less on LOW nutrition than on HIGH nutrition, leading to a 9.5 kg lower weaning liveweight (LW) and a 14.9 kg lower final LW in LOW lambs. After adjustment for final LW, HIGH lambs had significantly greater fat depth at the C-site (approximately 40 mm from the midline over the 12th rib) and tissue depth at the GR site (110 mm from the midline over the 12th rib) than did LOW lambs. This effect was consistent across sire-types. Depth of fat at the C-site was positively associated with the EBV of the sire for fat depth. The improvement in pre-weaning LWG, weaning weight, and final weight of lambs resulting from use of sires with a greater PWWT EBV was dependent upon the level of nutrition. This interaction was identified as different slopes (coefficients) for the regression between PWWT and trait for the 2 nutrition levels, indicating that the expression of the sire’s genetic potential for growth at these times was significantly moderated by nutrition. The additional depth of lamb loin muscle resulting from use of sires of higher PEMD EBV was consistent across both LOW and HIGH nutrition treatments, with 1 mm of PEMD leading to a 0.6-mm increase in loin depth. Other consequences of sires having a high genetic capacity for loin muscle depth were reduced carcass C-fat depth with increasing sire PEMD and a tendency for conformation score to improve with the PEMD of the sire. The wool-growth response to improved nutrition was less in M lambs than in lambs of other sire-types, suggesting a difference in priority for protein partitioning between muscle and wool in lambs differing in genetic propensity for muscle growth.
Additional keywords: lamb, sheep, genetics, nutrition, carcass, muscling.
Introduction
Genetic selection of terminal sires has been a major contributor to the progressive reduction in carcass fatness and increase in carcass weight achieved by the Australian lamb industry (Banks 1995; Fogarty et al. 1997). Effects of nutrition on the expression of genetic potential for growth and fatness (Hall et al. 2002; Lewis et al. 2002) have been partially evaluated, but studies of nutritional effects on muscle development have not looked for genetic effects in a quantitative manner. High levels of muscle development due to specific genes such as the Callipyge (Freking et al. 1998) and Carwell (Jopson et al. 2001) are known, and the impact of these genes on quality traits such as tenderness has been assessed (Hopkins et al. 1997; Shackelford et al. 1998). The potential for nutrition of the lamb to moderate effects of these specific genes has not been well evaluated, nor have nutritional effects on other genetically high-muscling lambs which do not carry these specific genes. Adverse effects of nutritional restriction on growth rate and body composition of lambs and sheep have been described throughout most phases of growth (Hodge and Star 1984; Hopkins and Tulloh 1985; Hegarty et al. 1999; Greenwood and Bell 2003). The scale of effects in lambs with different genetic potential for growth and muscling as defined by their estimated breeding values (EBVs), however, has not been quantified. This study was conducted to determine the effect of level of available nutrition on the growth, development, and carcass characteristics of lambs from sires differing in their genetic potential for muscle development or differing in their genetic potential for rate of live weight gain.
Material and methods
In order to establish the effect of plane of available nutrition on growth and carcass characteristics of lambs of diverse growth potential, a 3 × 2 factorial experiment was designed in which 3 sire-types were evaluated over 2 whole-of-life nutrition planes. The experiment was conducted at the University of New England’s ‘Kirby’ research station, Armidale, NSW, with lambs being born in September 2001 and slaughtered in May 2002.
Ewe and sire selection, insemination and management during pregnancy
A first-cross (Border Leicester × Merino) flock of ewes (n = 394) comprising 113 maiden and 281 mature ewes was used in this study. Ewes were allocated to individual sires using stratified randomisation such that the proportion of maiden ewes joined to each sire was the same and the mean pre-joining weights of maiden and mature ewes were the same for each sire (40.2 kg ± 4.8, 59.5 kg ± 5.3), as was the mean fat score assessed 110 mm from the midline over the 12th rib (FS; 3.5 ± 0. 60, 3.6 ± 0.86).
In preparation for artificial insemination by a commercial operator, all ewes were treated using a standard protocol as described below. Intravaginal progesterone releasing devices (Eazi-breed sheep and goat device CIDR, Pharmacia, Australia) were inserted into ewes for 16 days then removed and each ewe injected with Folligon (Intervet Australia Pty Ltd; 1.2 mL maidens, 1.5 mL mature ewes). Teaser wethers were prepared by weekly injection with Ropel (2 mL) for 2 weeks before use. Teaser wethers were introduced (20/100 ewes) and ewes left without food or water overnight, being inseminated approximately 25 h after CIDR removal.
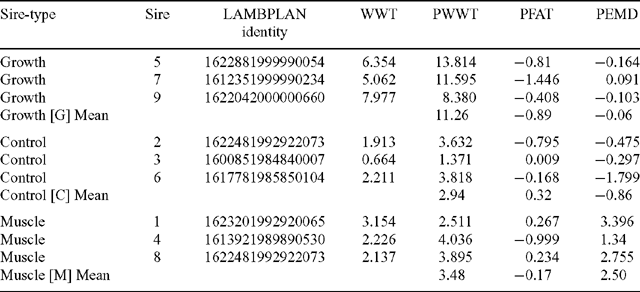
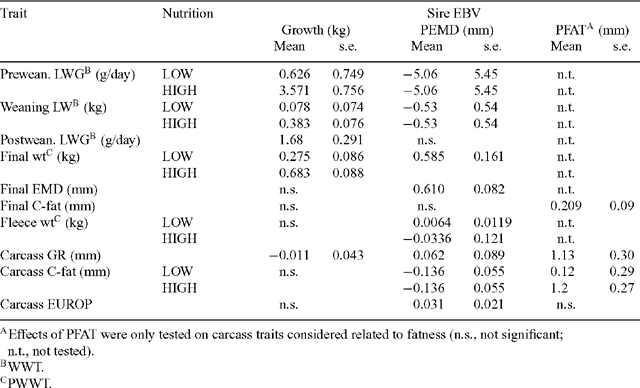
Semen from 9 Poll Dorset sires, representing 3 sires of each sire-type, was used for an insemination program conducted over 2 days (Table 1). The sire-types differed in EBVs for post-weaning eye muscle depth (PEMD), and post-weaning liveweight (PWWT) as supplied by LAMBPLAN (MLA 2004, Terminal sire report October 2002). Three sires with high PWWT EBVs provided the growth (G) sire-type, 3 sires with high PEMD EBVs provided the muscle (M) sire-type, and 3 sires with PWWT and PEMD EBVs average of those used by the Australian lamb industry in 1990 provided the control (C) sire-type. One of the M sires (sire 1) was known to be homozygous for the Carwell gene. Correlations between EBVs for fat (PFAT; post-weaning fat depth at the C-site), PWWT, and PEMD indicated that substantial correlation existed between PWWT and PFAT (r = 0.69), while there was little association between PWWT and PEMD or PEMD and PFAT. Due to the correlation between PFAT and PWWT EBVs, and because the range in PFAT present had been intentionally minimised, only PWWT and PEMD breeding values were used in most analyses, PFAT was only included in models for fat-related traits. In evaluating the effects of growth EBV on preweaning growth, the weaning weight EBV (WWT) was used rather than PWWT EBV as a measure of genetic potential of the sire for growth (see Table 5).
|
Ewes were ultrasonically scanned for pregnancy and litter size 65 days after insemination and non-pregnant ewes removed. All pregnant ewes were run as a single flock until 14 days before the expected lambing date. Pregnant ewes were supplemented with sorghum grain and lupin for approximately 12 weeks prior to lambing. All ewes were also treated with Eweguard® long-acting anthelmintic (Fort Dodge Animal Health) prior to lambing and were drafted into 9 sire-groups and each group lambed in a separate paddock. Ewes were checked twice daily during lambing and each lamb identified to its mother, weighed, and ear-tagged within 24 h of birth.
Lambing and post-lambing management
Lambing occurred over a 16-day period, after which ewes and lambs were allocated to either a LOW or HIGH plane of nutrition, with each plane of nutrition being replicated across 3 paddocks. Allocation of ewes to nutrition groups and within replicates was by stratified randomisation, such that each sire was equally represented in each nutrition group and the number of maiden v. mature ewes was balanced across nutrition levels and their replicates, as were the number of twins and single-born lambs.
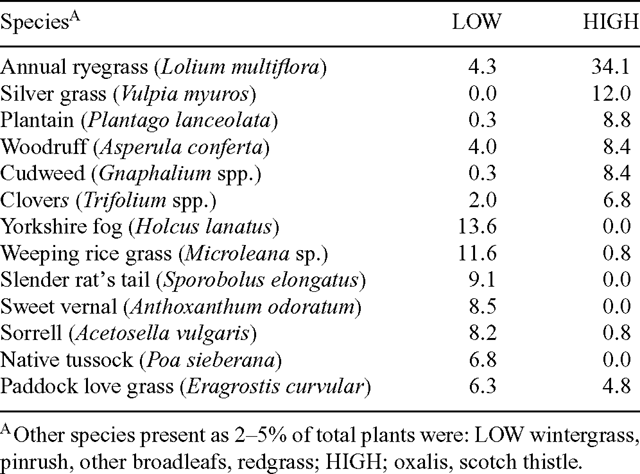
At a mean of 10 days of age, HIGH ewes and lambs were moved to a paddock of high performance ryegrass (Lolium multiflora) sown approximately 6 months previously. The pasture also contained high levels of Vulpia spp. and low levels of plantain (Plantago lancelota) and white clover (Trifolium repens) growing on heavy red basalt soil (Table 2). The paddock was fenced into 3 sub-paddocks of approximately 14 ha, each of which accommodated 1 of the 3 replicates of HIGH nutrition. LOW nutrition ewes and lambs were rotated among 6 of the lambing paddocks for the duration of the study. The pasture in the LOW paddocks was predominantly native species containing mostly Microleana, Poa, and Sporobolus species and Yorkshire fog (Holcus lanatus) with low levels of white clover, growing on a shallow granitic soil.
|
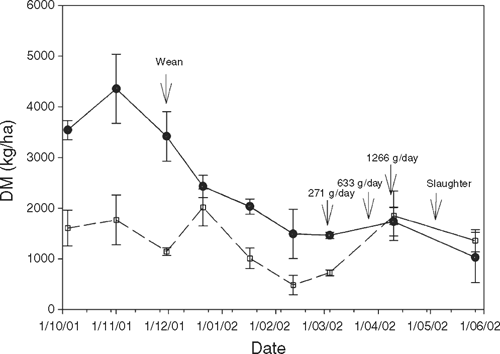
Ewes with lambs and, subsequently, weaned lambs were rotated at approximately 3-weekly intervals among the paddocks they grazed in order to control pasture intake and growth rate. At approximately 4 weeks of age, lambs were marked, vaccinated, and drenched for internal parasites and subsequently weaned at approximately 100 days of age. The replicated nutrition groups were grazed separately at all times except for the first 14 days post-weaning, when all HIGH lambs grazed in a single paddock, as did all LOW lambs, in order to keep them distant from their dams. All lambs were treated routinely for internal parasites in anticipation of LOW lambs grazing close to the soil. At approximately 4 months of age, HIGH lambs were briefly moved from the ryegrass paddock onto 3 replicate paddocks of native pasture which had a flush of growth, in order to allow cattle to reduce the pasture height of the ryegrass paddock and prevent rank growth. Due to an extremely dry summer, legume content of the pastures was very low, and HIGH lambs were supplementary fed in the paddock when pasture availability fell below 1.5 t DM/ha (Fig. 1) for the final 3 months of the study. The supplement was a cereal-based pellet (18.4% CP; 12.2 MJ ME/kg DM), with the feeding rate increasing to reach 1.2 kg/lamb.day prior to slaughter.
|
Measurements
Pasture assessment
Pasture availability was determined at approximately 3-week intervals during the study using the median quadrat technique, with 9 quadrats cut per treatment per sampling. All plant material above ground was removed during sampling. Samples were dried at 60°C and the proportions of green, dead, and legume in the dry matter determined. Mixed subsamples were assessed for the proportions of green and dead DM, and the crude protein (N% ×6.25) and acid detergent fibre (ADF) content of each sample determined. DM digestibility (%) was calculated as 83.58 – 0.824ADF% + 2.626N% (Oddy et al. 1983). Species composition of the pastures was determined in autumn by walking at random through each paddock and determining the plant species present immediately in front of the sampler’s boot after every 10 steps. One hundred observations were made in each paddock.
Live animal assessment
Ewes were weighed and assessed for fat score (FS) over the long ribs at approximately 3-week intervals from pre-lambing until weaning. Lambs were weighed at approximately 3-week intervals, and after weaning, tissue depth at the GR site (110 mm from the midline over the 12th rib) of all lambs was also manually determined during weighing. Once lambs reached 30 kg LW, an Aloka 500 ultrasound scanner with a 3.5 MHz probe was used every 6 weeks to determine eye muscle depth (EMD) at the 12th rib and fat depth at the C-site (40 mm from the midline over the 12th rib).
Slaughter and abattoir measurements
Ten days prior to slaughter, lambs in the 3 HIGH paddocks were combined to provide a single HIGH nutrition group, and the 3 paddocks of LOW group lambs were similarly combined. This was done to limit social stress caused by grouping lambs during mustering, transport, and lairage at the abattoir. The slaughter was conducted over 3 kill days spread over a total period of 7 days. The lambs for each kill were transported approximately 1.5 h by truck to the abattoir the day prior to slaughter. A balance of LOW and HIGH lambs from each sire were allocated to each kill day, but the majority of ewe-lambs (n = 140) were killed over 2 of the slaughter days. This was done to allow assessment of eating quality of these ewe lambs (Hopkins et al. 2005). Groups of LOW and HIGH nutrition lambs were drawn from each pooled nutrition group, trucked to the abattoir in separate pens, and killed in random order within these balanced groups. This prevented remixing of animals at the abattoir and avoided confounding treatments with time of kill. A subset of 56 lambs containing single-born males from each treatment and from each sire was killed on the third slaughter day, and these carcasses were retained for yield and compositional studies (Hegarty et al. 2006).
Hot standard carcass weight (HSCW) was determined in the abattoir for all carcasses, and tissue depth at the GR site was measured using a GR knife. The carcass was cut between the 12th and 13th rib and fat cover at the C-site measured with a metal ruler for most lambs, but 56 carcasses of males and 140 carcasses of females were taken for eating quality and carcass yield studies, respectively, without being cut. C-fat depth was subsequently measured on females at the same site when racks were being boned out for testing, but C-site fat depth was not measured on the 56 males taken for yield studies. For the lambs taken for eating quality and yield assessment, a stab-type WPS temperature compensated pH meter (TPS, WP-80 PTS Pty Ltd, Brisbane) was used to measure final pH in all carcasses in the m. longissimus thoracis et lumborum (LL). The meat colour of the LL was measured on the cut surface using a Minolta Chromameter (Model CR-300) set on the L*, a*, b* system (where L* measures relative lightness, a* relative redness, and b* relative yellowness). The chromameter was operated using Illuminant C and a white tile standard (Y = 93.1, x = 0.3135, y = 0.3197). Three replicate measurements were taken at the same position with special effort to avoid areas of connective tissue or intramuscular fat. Carcass conformation was assessed using the EUROP system of de Boer (1992) transformed into a 5-unit scale with 5 being the best conformation.
Statistical procedures
For the ewe data, a linear mixed model was used to analyse each variable. The fixed terms included nutrition, sire-type, and their interaction, plus terms to account for multiple or single births and ewe age (maiden or mature). Interactions of these terms with nutrition were also included. Terms that were not significant were removed from the model, except for nutrition and sire-type, which were always retained. A random term (nutrition replicate) was also included in the model, to account for the initial allocation of ewes into 6 groups including 3 groups within each nutrition class. A similar model was used for the lamb data, with the addition of variables to account for sex of the lamb and its interaction with nutrition. In subsequent analyses, EBVs for growth (WWT or PWWT) and muscling (PEMD) and their interactions with nutrition were included in place of sire-type and its interaction with nutrition, and the regression coefficients derived for interactions.
The weight of a carcass was strongly correlated with most variables in the kill data, and hence, HSCW and its interaction with nutrition were included in the model as covariates. A random term (slaughter day) was also included in the model to account for differences due to the day on which the lambs were killed. These analyses were conducted using ASREML (Gilmour et al. 2002), a software program suited to linear mixed models.
Results
Effects on ewe performance
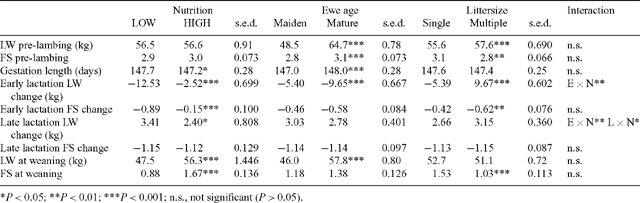
Of the 394 ewes inseminated, 67% were assessed as being pregnant on day 65. Between 25 and 34 ewes were pregnant to each sire, and the mean LW and FS of ewes prior to lambing was 56.6 kg and 2.9, respectively (Table 3), with an average of 1.52 lambs born per pregnant ewe.
|
Neither ewe age (maiden v. mature) nor sire affected the percentage of ewes conceiving to artificial insemination. There was a tendency for conception to be affected positively by condition score (P = 0.06), but not by LW of the ewe prior to insemination (P > 0.05). Mature ewes produced more lambs per pregnancy than did maiden ewes (1.6 v. 1.4; P < 0.05). Sire did not significantly affect lambs born per pregnant ewe.
Maiden ewes were significantly lighter with a significantly lower FS than mature ewes before lambing. Ewes bearing twins or multiple lambs were heavier, but with lower FS than single-bearing ewes before lambing (Table 3). Gestation period was shorter for maiden ewes by 1 day and was significantly affected by sire and sire-type, such that gestation was 147.6, 146.8, and 148.0 days for ewes conceiving to G, C, and M sires, respectively (C < G = M, s.e.d. = 0.30). The decline in ewe LW from approximately 5 days before lambing until 40 days into lactation was significantly greater for ewes on LOW nutrition than those on HIGH nutrition. There was a significant nutrition × ewe age interaction (P < 0.05) such that the difference in weight loss when on LOW relative to HIGH nutrition was significantly less for maiden (9.6 v. 1.2 kg; s.e.d. = 0.96) than for mature (15.5 v. 3.8 kg; s.e.d. = 0.96) ewes. The decline in FS of maiden ewes in early lactation was also less than for mature ewes and this was consistent across nutrition levels. Although all ewes regained LW during late lactation, ewes that reared multiple lambs regained more LW than did ewes rearing singles. Mature ewes regained more weight on HIGH than LOW nutrition, whereas LW gain (LWG) of maidens in late lactation was not affected by nutrition. At weaning, ewes on HIGH nutrition were 8.8 kg heavier than LOW ewes and had a significantly higher FS (Table 3).
Lamb growth
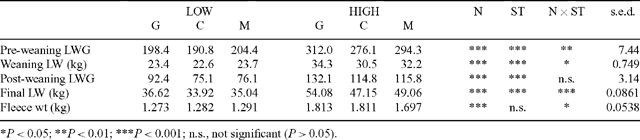
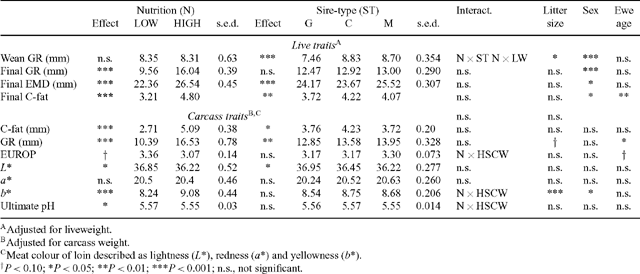
Plane of nutrition had a dramatic effect on lamb LW, with LOW and HIGH lambs differing in weight by 9.1 kg (P < 0.001) at weaning and by 14.9 kg at slaughter (P < 0.001; Table 4). While the effect of sire-type on lamb LW was of lower magnitude than that of nutrition (final LW of G lambs being 4.8 kg heavier than C lambs), there were significant sire-type × nutrition interactions for pre-weaning LWG, weaning weight, and final LW. The interactions were such that the increase in LW or LWG due to HIGH nutrition was greater for G lambs than for M and C lambs (Table 4).
|
Singleton lambs were heavier at birth than multiple-born lambs (5.24 v. 4.24 kg) and had faster pre-weaning growth (278 v. 212 g/day; s.e.d. = 5.3) resulting in a greater weaning weight (31.3 v. 24.2 kg; s.e.d. = 0.80). After weaning, multiple-born lambs grew faster than single-born lambs (109 v. 97 g/day; s.e.d. = 4.3) but remained lighter at slaughter (40.2 v. 45.5 kg; s.e.d. = 0.90). Lambs born as twins or triplets, but reared as singletons due to sibling mortality, had pre-weaning LWG and weaning weights intermediate to those born and raised as singletons or twins. Their post-weaning LWG was not different to that of single-born lambs (97.5 v. 97.2 g/day; s.e.d. = 4.3) but was less than the multiple-born and reared lambs which compensated after weaning (97.5 v. 108.5 g/day; s.e.d. = 4.3). Lambs born to mature ewes were heavier at birth (4.97 v. 4.30 kg) and grew faster pre-weaning (263 v. 229 g/day; s.e.d. = 5.4), although not post-weaning. Final weight of lambs from mature ewes was greater (45.5 v. 40.1 kg; s.e.d. = 0.60), but there was no effect of ewe age on final GR depth or EMD that was not attributable to LW. Male lambs were born heavier (4.77 v. 4.50 kg), grew faster to weaning (251 v. 243 g/day; (P < 0.10), and had less GR tissue depth (7.4 v. 9.3 mm; s.e.d. = 0.29). Male lambs also had significantly greater final weights (43.3 v. 41.9 kg; s.e.d. = 0.48), but lower GR depth (12.0 v. 13.3 mm; s.e.d. = 0.23) and EMD (24.2 v. 24.7 mm; s.e.d. = 0.24) than did ewe lambs when adjusted for final LW.
Significant nutrition × PWWT EBV interactions occurred for pre-weaning LWG, weaning weight, and final weight of the lambs. These interactions were identified as different slopes (coefficients) for the regression between the EBV and trait for the 2 nutrition levels (Table 5), indicating that the expression of the sire’s genetic potential for growth at these times was significantly moderated by nutrition. Post-weaning LWG was affected by sire-type and this effect was consistent over nutrition levels. While PWWT and PEMD EBVs were not correlated across the sires, growth of the lambs was significantly affected by both sire PWWT and PEMD (Table 5). Each millimetre of additional PEMDEBV was associated with small reductions (5.06 ± 5.45 g/day) in pre-weaning LWG and 532 g of weaning weight, but conversely a 585 g increase in final weight indicating a change in effect as lambs matured.
|
Fat development
GR tissue depth as measured at weaning was significantly affected by nutrition, being 4.8 mm less in LOW than HIGH nutrition lambs. When adjusted for weaning LW, the GR depth of LOW and HIGH lambs at weaning did not differ, but there was a significant nutrition × sire-type interaction such that lambs of all sire-types on LOW nutrition, had similar GR depths, whereas on HIGH nutrition the GR depth of G lambs was less than that of C or M lambs (Table 6). Immediately prior to slaughter, LOW nutrition lambs had 9.4 mm less tissue depth at the GR site than HIGH lambs, and a 6.2-mm difference in GR depth was still apparent after adjusting for final LW (P < 0.001).
|
PFAT of the sire significantly increased the carcass GR tissue depth (1.13 mm GR/mm PFAT) and C-site fat thickness (0.68 mm C-site/mm PFAT). The expression of genetic potential for fat accretion at the C-site was moderated by nutrition such that carcass C-site fat increased by 0.12 mm/mm PFAT on LOW nutrition, but by 1.23 mm/mm PFAT on HIGH nutrition (Table 5).
Loin development
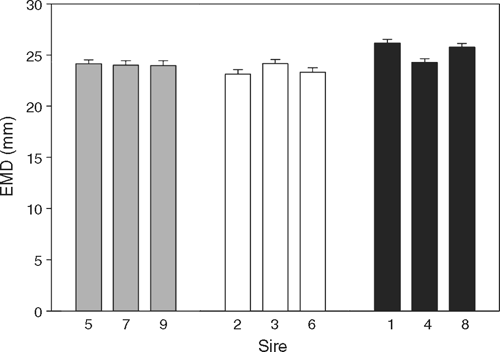
Measurement of EMD only commenced when lambs reached 30 kg LW, so very few of the LOW lambs had reached this weight by weaning and no analyses of EMD at weaning are presented. Progressive assessment of EMD in HIGH lambs showed that their EMD was largely developed by weaning (mean 23.2 mm), with EMD only increasing a further 20% by slaughter, while LW increased by a further 57% to slaughter. Final EMD was significantly greater in HIGH than LOW nutrition lambs and this effect was consistent across sire-types and individual sires (Table 6). There was no nutrition × PEMD-EBV interaction for final EMD and the regression coefficient between final EMD and PEMD was 0.61 mm/mm PEMD (s.e. = 0.082) applied across nutrition levels (Table 5). There were significant individual sire differences in final EMD (P < 0.001; Fig. 2), but there were no sire × nutrition interactions for final EMD.
|
Wool growth
The effect of nutrition on greasy fleece weight of the lambs was significantly affected by sire-type (P < 0.05), such that the increase in fleece weight due to HIGH nutrition was less for M lambs than for G and C lambs (406 g v. 540 and 530 g, respectively). This was also evidenced by a significant PEMD-EBV × nutrition interaction for fleece weight (Table 4, Fig. 3). On LOW nutrition, the regression coefficient between wool growth and PEMD was 0.0064 kg wool/mm PEMD, whereas on HIGH nutrition, higher EBVs for PEMD actually suppressed fleece weight (regression coefficient = –0.0336 kg wool/mm PEMD). Single-born lambs had higher fleece weights than multiple-born lambs (1.63 v. 1.40 kg; s.e.d. 0.50; P < 0.001); lambs born to maiden ewes produced less wool than progeny of mature ewes (1.47 v. 1.58 kg; s.e.d. 0.034; P < 0.01), and there was a significant ewe age × nutrition interaction for lamb wool growth, with lambs born to mature ewes increasing their fleece weight in response to HIGH nutrition more than lambs of maiden ewes.

|
Dressing and carcass characteristics
Dressing percentage (100 × HSCW/LW prior to transport to abattoir) was markedly affected by LW of the lamb (Dress% = 32.7 + 0.27LW; r2 = 0.77). Dressing percentage (without adjustment for carcass weight) was greater in HIGH nutrition lambs in keeping with their heavier body weight, and tended to be greater in M lambs than other sire-types (P < 0.1). Dressing percentage was higher in male lambs than females (44.2 v. 43.7%; P < 0.01), in singleton than multiple-born lambs (45.3 v. 42.9%; P < 0.001), and in progeny from mature ewes compared with maiden ewes (44.4 v. 43.5%; P < 0.001).
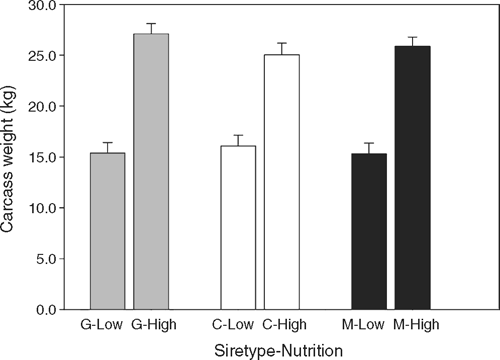
The nutrition × sire-type interactions for weaning weight and pre-slaughter weight were repeated in HSCW at slaughter, such that the increase in HSCW achieved by G lambs in response to HIGH nutrition was approximately 2 kg greater than that achieved by C or M lambs (Fig. 4).
|
Conformation of the lamb carcasses assessed by the EUROP system showed significant nutrition, sire-type, and individual sire effects, but no nutrition × sire interactions. Of the individual sires, Sire 1 had the highest score (3.44), well above the mean for the other 8 sires (3.14). HSCW explained 38% of the variation in EUROP score, and when adjusted to a common HSCW, there was a significant nutrition × HSCW interaction, such that the increase in EUROP score resulting from every additional kg of HSCW was greater for LOW lambs (mean HSCW 14.6 kg), than for HIGH lambs (mean HSCW 25.5 kg). Nutrition level positively affected EUROP (3.37 v. 2.95; P < 0.05) and EUROP improved with PEMD of the sire (Table 5). Sire PEMD also significantly affected carcass EMD of lambs, with 1 mm of PEMD contributing 0.61 mm of carcass EMD. The only traits for which PWWT and PEMD interacted were preweaning LWG, weaning weight, and carcass GR. PFAT of the sire was positively associated with GR depth and fat depth at the C-site, with PFAT effects on C-site fat being greater on HIGH than LOW nutrition (Table 5).
The GR depth of carcasses from LOW nutrition lambs was significantly less than from HIGH nutrition lambs, being 13 mm leaner at slaughter and 5.1 mm leaner when adjusted for HSCW. The PWWT EBV, PEMD EBV, and PFAT EBV of the sire all affected GR depth in the lamb carcass, with 1 kg PWWT reducing GR depth by 0.01 mm and 1 mm of PEMD increasing GR depth by 0.06 mm, while 1 mm of PFAT EBV increased GR depth by 1.13 mm. Individual sires did not differ in GR depth of the progeny and there were no sire or sire-type × nutrition interactions for GR depth. Regression coefficients between GR and C-site depths were not different between G and M carcasses (GRGM = 2.915 + 2.766[±0.0286] × C-site), but the slope was significantly less for C carcasses (GRC = 2.484 + 2.536[±0.0220] × C-site). This translates to a C-depth of 5 mm equating with a GR of 16.7 mm for G and M carcasses, but only 15.2 mm for C carcasses. C-site fat depth increased with PFAT on the live lambs (0.21 mm/mm PFAT; s.e. = 0.09), but assessment of C-fat on the carcass showed this increase was greater on HIGH than LOW nutrition (Table 5).
HIGH nutrition led to a lighter coloured loin and small and significant sire and sire-type differences existed (Table 6) when compared at a constant HSCW. Male lambs provided lighter coloured loin meat than females (L* = 36.9 v. 36.2) at a standard HSCW (20.16 kg) and there was a significant effect of sire PWWT on loin lightness, with 1 kg of PWWT increasing L* by 0.100 units (± 0.028). Redness of the loin (a*) was unaffected by any fixed or random factors or by growth or muscle EBVs. Yellowness (b*) was greater in HIGH than LOW nutrition lambs and was greater in multiple-born lambs than singletons, and was greater in ewe lambs than in males. Yellowness was not affected by PWWT or PEMD.
As measured, the ultimate loin pH was lower in HIGH than LOW lambs (5.58 v. 5.67; P < 0.001). The effect of nutrition on ultimate loin pH was dependent upon HSCW, with every kg of HSCW decreasing loin pH by 0.0147 (± 0.0036) units in LOW lambs, but having no effect in HIGH nutrition lambs (0.003 ± 0.003 units/kg HSCW).
Discussion
An appreciation of genetic × nutritional interactions for lamb growth traits may allow development of strategic combinations of genotype and nutrition resources, to enable production of lambs to market specifications across a wider range of production environments. This study identified that the magnitude of the effect of available nutrition on growth of body mass (pre-weaning LWG, weaning LW, final LW) and also growth of wool were affected by the genetic capacity of the lamb for growth (PWWT) and/or for muscle development (PEMD). This concurs with (Lewis et al. 2002) who found the growth rate advantage of lambs bred for lean growth changed with the level of nutrition. In contrast to growth traits, the advantage to be gained from choosing superior genetics for the compositional traits of live animal muscling (PEMD) appears more robust. There was no effect of nutrition on expression of the lamb’s genetic potential for muscle development (PEMD), as shown by the consistency of the PEMD effect across both LOW and HIGH levels of nutrition in this study. This does not imply that plane of nutrition cannot by itself modify composition, simply that increases in loin depth associated with greater sire PEMD are consistent across LOW and HIGH planes of nutrition.
Nutritional influence on lambs expressing their genetic potential for fattening was ambiguous. Slower growth rates post-weaning are known to reduce the fat mass in lambs at standardised slaughter weights (Thatcher and Gaunt 1992; Hegarty et al. 1999). In this study, C-fat depth measured ultrasonically on lambs indicated that the effect of the PFAT EBV was not influenced by nutrition, but when measured on the cut carcass there was significant PFAT × nutrition interaction for C-fat depth. This difference between live animal and carcass response may be a result of differing numbers of lambs assessed, since live assessment was made on all lambs, but carcass C-fat was not measured on carcasses taken for compositional studies. Alternately the discrepancy may be a consequence of the difficulty of obtaining a precise estimate of fat depth at the C-site using real time ultrasound, particularly in lean animals (Hopkins et al. 1996).
Effects of nutrition and genetics on growth
Prior to weaning, lambs derive much of their nutrition from the ewe’s milk, with an increasing intake of pasture as lactation declines (Langlands 1972). As such, the body tissues of the ewe would have buffered the lamb from effects of low pasture availability in this study before weaning. With LOW nutrition, maiden ewes lost 8 times more LW than on HIGH nutrition, while the relatively heavy mature ewes with a greater FS pre-lambing lost only 4 times as much LW on LOW than HIGH nutrition. This indicates how important ewe body condition is in supporting lamb growth, and therefore preventing major growth impediments prior to weaning. While LWG of lambs reared by maidens was able to partially compensate post-weaning, LOW nutrition continued to support slower growth of all lambs through to slaughter.
The growth rate of lambs from sires selected for superior growth has been shown to be suppressed when a low plane of nutrition is provided (Hall et al. 2002; Lewis et al. 2002). This association between available nutrition and expression of the lamb’s genetic potential for growth was apparent in the present study, with available nutrition having a marked effect on the LWG achieved per unit EBV for growth. This differential expression of genetic potential for LWG in response to nutrition was greatest pre-weaning with no nutrition × PWWT interaction for post-weaning LWG. This finding brings particular attention to the need to provide optimised nutrition to lambs pre-weaning in order to maximise the production benefit from investment in sires with high EBVs for growth. Since pre-weaning nutrition of lambs is largely a function of milk production by the ewe, it is having ewes below targets for LW and condition score at lambing (as seen in the contrast between maiden and mature ewes in this study) that is potentially a major constraint to lambs expressing their genetic potential for growth.
That PEMD negatively affected preweaning LWG was unexpected, since PWWT and PEMD EBVs of the 9 sires used were largely independent of each other, and PEMD is itself calculated at an adjusted LW (MLA 2004). Growth rate of lambs carrying the Callipyge gene for extreme muscling do not differ from control lambs (Snowder et al. 1994; Freking et al. 1998).
Effects of nutrition and genetics on composition
The pattern of allometric growth of bone, muscle, and fat in lambs has been well described (Searle et al. 1972; Butterfield 1988). While LOW nutrition slowed growth and reduced the slaughter weight of lambs, the LOW lambs had greater EMD at a given carcass weight and reduced subcutaneous fat (C-fat) compared with lambs raised on HIGH nutrition. These findings are consistent with reduced carcass fat and increased carcass protein in other studies of lambs reared under nutritional restriction (Thatcher and Gaunt 1992; Hegarty et al. 1999). As such, nutritional restriction of post-weaning growth offers a simple practical tool for managing fat deposition in lambs, even though it is often ignored in the search for metabolic modifiers to achieve the same goal (Sillence 2004). While efforts were made to minimise genetic variation for fattening (PFAT) among the 9 sires used in this study, PFAT was fitted last in EBV analysis models and was positively associated with C-fat depth on the live animal and the carcass. Since subcutaneous fat is often included in pricing schedules, this offers the opportunity to increase the value of lambs by using sires with low fat EBVs (Hall et al. 1997; Jones et al. 2004).
The finding that a 1-mm increase in the PEMD EBV of the sire led to a 0.61-mm increase in EMD of the lamb is similar to the effect reported by Hall et al. (2002) for Poll Dorset sires with a smaller range in yearling EMD EBVs and when EMD was measured by ultrasound immediately prior to slaughter. It is independent of, and therefore can be applied in addition to, the positive effects of plane of nutrition on EMD. The finding that the PEMD EBV of the sire had a negative impact on carcass C-site fat depth (beyond that attributable to the PFAT EBV) was unexpected, but studies with Callipyge lambs have shown a lower carcass fat percentage is often associated with the superior muscle development relative to that occurring in other lambs (Jackson et al. 1997b; Freking et al. 1998; Abdulkhaliq et al. 2002). If this joint response of fat and muscle is found to recur in further studies it provides extra incentive for inclusion of PEMD in selection of sires for prime lamb production. The greater EUROP score of lambs born to the M sire-type and the positive effect of PEMD on EUROP score also indicate that use of high muscling sires induces not only a change in internal composition, but external appearance of the carcass. This would be advantageous to enterprises selling lambs using pricing systems that include conformation as well as GR depth and HSCW in their specifications, and suggests that use of sires selected for EMD will assist producers to meet market specification for muscling, fatness, and conformation when required.
Wool growth
The reduced wool growth response to nutrition in M lambs relative to C or G lambs shows that muscle development was a physiological priority for M lambs. Without protein intake data it is not possible to estimate protein partitioning between wool and meat, but the data suggest M lambs partitioned absorbed amino acids preferentially into muscle rather than wool at high amino acid availabilities. Some of the antagonisms associated with the Callipyge muscling gene in particular have been identified (Shackelford et al. 1998), but the wool v. muscle antagonism has received little attention, despite this difference in partitioning being apparent in Callipyge ewes, for which fleece weight was 18% less than that in non-Callipyge ewes (Jackson et al. 1997a).
Meat traits
Studies of meat colour in Callipyge lambs have not indicated any undesirable consequences of greater eye muscle development on meat colour (Jackson et al. 1997b). In this study, the meat from all groups was light coloured, being above the critical L* value of 34 proposed by Hopkins (1996) as being indicative of unacceptably dark meat. The significant sire effect on lightness in this study, however, showed meat colour was genetically influenced, if not to a level to have adverse effects. Hopkins and Fogarty (1998) had previously shown progeny from the Carwell sire had the darkest meat, but there was no effect on redness or yellowness, as was also the case in this study.
Conclusions
Level of available nutrition exerted a major positive effect, not only on growth rate of lambs but on their fat depth assessed at a standard LW or HSCW. As such, nutritional regulation of post-weaning growth rate offers a practical tool for controlling fat accretion in lambs. Expression of the genetic potential for growth of lambs was differentially affected by available nutrition such that the additional LWG occurring in response to greater available nutrition increased with the lambs’ genetic potential for growth. In contrast, the advantage in EMD resulting from use of high PEMD sires was unaffected by available nutrition, with the increase in EMD resulting from use of high PEMD sires being the same on LOW or HIGH available nutrition. These findings support and augment studies of nutritional influence on expression of growth and fattening potential of lambs, but further studies of the robustness of EMD EBV effects across diverse nutritional environments are required.
Acknowledgments
Semen from all sires used in this study was provided free of charge by the studs and this contribution is acknowledged with thanks. Technical support for this study was provided by Stuart McClelland, Reg Woodgate, Bill, Johns, Steve Sinclair, David Stanley, and Joe Brunner (NSW Department of Primary Industries). Thanks to Clare Edwards (NSW Department of Primary Industries) for assistance in pasture species identification and classification and thanks to Dr R. Banks, Dr R. Woolaston, and Dr A. Gilmour for assistance in preparation of the manuscript. The study was funded by NSW Department of Primary Industries and Meat and Livestock Australia under the Management Solutions Program.
Abdulkhaliq AM,
Meyer HH,
Thompson JM,
Holmes ZA,
Forsberg NE, Davis SL
(2002) Callipyge gene effects on lamb growth, carcass traits, muscle weights and meat characteristics. Small Ruminant Research 45, 89–93.
| Crossref | GoogleScholarGoogle Scholar |

Banks R
(1995) Better genetic technology—developments in the Australian lamb industry. Proceedings of the Australian Association of Animal Breeding and Genetics 11, 48–54.
de Boer H
(1992) EC standards: Carcass classification in Europe; history and actual position. Meat Focus International 1, 365–368.
Fogarty NM,
Gilmour AR, Hopkins DL
(1997) The relationship of crossbred lamb growth and carcass traits with LAMBPLAN EBVs of sires. Proceedings of the Australian Association of Animal Breeding and Genetics 12, 304–308.
Freking BA,
Keele JW,
Nielsen MK, Leymaster KA
(1998) Evaluation of the ovine Callipyge locus: II. Genotypic effects on growth, slaughter, and carcass traits. Journal of Animal Science 76, 2549–2559.
| PubMed |
Greenwood PL, Bell AW
(2003) Prenatal nutritional influences on growth and development of ruminants. Recent Advances in Animal Nutrition in Australia 14, 57–73.
Hall DG,
Fogarty NM, Holst PJ
(1997) Valuing lamb sires—the effect of estimated breeding values for weight and fat in a declining lamb market. Proceedings of the Australian Association of Animal Breeding and Genetics 12, 355–359.
Hall DG,
Gilmour AR,
Fogarty NM, Holst PJ
(2002) Growth and carcass composition of second cross lambs. 2. Relationship between estimated breeding values of sires and their progeny performance under fast and slow growth regimes. Australian Journal of Agricultural Research 53, 1341–1348.
| Crossref | GoogleScholarGoogle Scholar |
Hegarty RS,
Hopkins DL,
Farrell TC,
Banks R, Harden S
(2006) Effects of available nutrition and sire breeding values for growth and muscling on the development of crossbred lambs. 2: Composition and commercial yield. Australian Journal of Agricultural Research 53, 617–626.
Hegarty RS,
Neutze SA, Oddy VH
(1999) Effects of protein and energy supply on the growth and carcass composition of lambs from differing nutritional histories. Journal of Agricultural Science (Cambridge) 132, 361–375.
| Crossref | GoogleScholarGoogle Scholar |
Hodge RW, Star M
(1984) Comparison of the fat status of lambs during continuous growth and following nutritional restriction and subsequent re-alimentation. Australian Journal of Experimental Agriculture and Animal Husbandry 24, 150–155.
| Crossref | GoogleScholarGoogle Scholar |
Hopkins DL
(1996) Assessment of lamb meat colour. Meat Focus International 5, 400–401.
Hopkins DL, Fogarty NM
(1998) Diverse lamb genotypes – 1. Yield of saleable cuts and meat in the carcass and the prediction of yield. Meat Science 49, 459–475.
| Crossref | GoogleScholarGoogle Scholar |
Hopkins DL,
Hall DG, Luff AF
(1996) Lamb carcass characteristics. 3. Describing changes in carcasses of growing lambs using real-time ultrasound and the use of these measurements for estimating the yield of saleable meat. Australian Journal of Experimental Agriculture 36, 37–43.
| Crossref | GoogleScholarGoogle Scholar |
Hopkins DL,
Hegarty RS, Farrell TF
(2005) Relationship between sire EBV’S and the meat and eating quality of meat from their progeny grown on two planes of nutrition. Australian Journal of Experimental Agriculture 45, 525–533.
| Crossref |
Hopkins DL, Tulloh NM
(1985) Effects of a severe nutritional check in early post natal life on the subsequent growth of sheep to the age of 12–14 months. Journal of Agricultural Science (Cambridge) 105, 551–562.
Jackson SP,
Green RD, Miller MF
(1997a) Phenotypic characterisation of Rambouillet sheep expressing the Callipyge gene: I. Inheritance of the condition and production characteristics. Journal of Animal Science 75, 14–18.
| PubMed |
Jackson SP,
Miller MF, Green RD
(1997b) Phenotypic characterization of Rambouillet sheep expressing the Callipyge gene: III. Muscle weights and muscle weight distribution. Journal of Animal Science 75, 133–138.
| PubMed |
Jones HE,
Am PR,
Lewis RM, Emmans GC
(2004) Economic values for changes in carcass lean and fat weights at a fixed age for terminal sire breeds of sheep in the UK. Livestock Production Science 89, 1–17.
| Crossref | GoogleScholarGoogle Scholar |
Jopson NB,
Nicoll GB,
Stevenson-Barry JM,
Duncan S,
Greer GJ,
Bain WE,
Gerard EM,
Glass BC,
Broad TE, McEwan JC
(2001) Mode of inheritance and effects on meat quality of the rib-eye muscling (REM) QTL in sheep. Proceedings of the Australian Association of Animal Breeding and Genetics 14, 111–114.
Langlands JP
(1972) Growth and herbage consumption of grazing Merino and Border Leicester lambs reared by their mothers or fostered by ewes of the other breed. Animal Production 14, 317–322.
Lewis RM,
Emmans GC, Simm G
(2002) Effects of index selection on the carcass composition of sheep given either ad libitum or controlled amounts of food. Animal Science 75, 185–195.
Searle TW,
Mc C,
Graham N, O’Callaghan M
(1972) Growth in sheep I. The chemical composition of the body. Journal of Agricultural Science (Cambridge) 79, 371–382.
Shackelford SD,
Wheeler TL, Koohmaraie M
(1998) Can the genetic antagonisms of Callipyge lamb be overcome? Reciprocal Meat Conference Proceedings 51, 125–132.
Sillence NM
(2004) Technologies for the control of fat and lean deposition in livestock. Veterinary Journal 167, 242–257.
| Crossref |
Snowder GD,
Cockett NE,
Busboom JR, Hendricks F
(1994) The influence of the callipyge gene on growth and feed efficiency of whitefaced and blackfaced lambs. Journal of Animal Science 72, 932–937.
| PubMed |
Thatcher LP, Gaunt GM
(1992) Effects of growth path and post-slaughter chilling regime on carcass composition and meat quality of ewe lambs. Australian Journal of Agricultural Research 43, 819–830.
| Crossref | GoogleScholarGoogle Scholar |