

Adapting wheat sowing dates to projected climate change in the Australian subtropics: analysis of crop water use and yield
Davide Cammarano A F G , José Payero B , Bruno Basso A C D , Lydia Stefanova E and Peter Grace A DA Institute for Sustainable Resources, Queensland University of Technology, GPO Box 2434, Brisbane, Qld 4001, Australia.
B The University of Queensland, Queensland Alliance for Agriculture and Food Innovation (QAAFI), 203 Tor St, Toowoomba, Qld 4350, Australia; Current address: Irrigation Research and Extension, Edisto Research and Education Center, Clemson University, 64 Research Road, Blackville, SC 29817, USA.
C Dept. of Geological Sciences and W.K. Kellogg Biological Station, Natural Science Bldg, 288 Farm Lane, Michigan State University, East Lansing, MI 48823, USA.
D W.K. Kellogg Biological Station, Michigan State University, Hickory Corners, MI 49060, USA.
E Center for Ocean-Atmospheric Prediction Studies, College of Arts and Sciences, The Florida State University, Tallahassee, FL 32306, USA.
F Current address: Department of Agricultural and Biological Engineering, University of Florida, Gainesville, FL 32611, USA.
G Corresponding author. Email: davide.cammarano@ufl.edu
Crop and Pasture Science 63(10) 974-986 https://doi.org/10.1071/CP11324
Submitted: 5 December 2011 Accepted: 24 September 2012 Published: 13 November 2012
Abstract
Projected increases in atmospheric carbon dioxide concentration ([CO2]) and air temperature associated with future climate change are expected to affect crop development, crop yield, and, consequently, global food supplies. They are also likely to change agricultural production practices, especially those related to agricultural water management and sowing date. The magnitude of these changes and their implications to local production systems are mostly unknown. The objectives of this study were to: (i) simulate the effect of projected climate change on spring wheat (Triticum aestivum L. cv. Lang) yield and water use for the subtropical environment of the Darling Downs, Queensland, Australia; and (ii) investigate the impact of changing sowing date, as an adaptation strategy to future climate change scenarios, on wheat yield and water use. The multi-model climate projections from the IPCC Coupled Model Intercomparison Project (CMIP3) for the period 2030–2070 were used in this study. Climate scenarios included combinations of four changes in air temperature (0°C, 1°C, 2°C, and 3°C), three [CO2] levels (380 ppm, 500 ppm, and 600 ppm), and three changes in rainfall (–30%, 0%, and +20%), which were superimposed on observed station data. Crop management scenarios included a combination of six sowing dates (1 May, 10 May, 20 May, 1 June, 10 June, and 20 June) and three irrigation regimes (no irrigation (NI), deficit irrigation (DI), and full irrigation (FI)). Simulations were performed with the model DSSAT 4.5, using 50 years of daily weather data. We found that: (1) grain yield and water-use efficiency (yield/evapotranspiration) increased linearly with [CO2]; (2) increases in [CO2] had minimal impact on evapotranspiration; (3) yield increased with increasing temperature for the irrigated scenarios (DI and FI), but decreased for the NI scenario; (4) yield increased with earlier sowing dates; and (5) changes in rainfall had a small impact on yield for DI and FI, but a high impact for the NI scenario.
Additional keywords: climate change, crop modelling, crop water stress, evapotranspiration, irrigation requirements, water use efficiency, wheat.
Introduction
Global population growth is putting increasing pressure on agriculture to produce more food on less arable land while maintaining productivity and profitability and ensuring environmental sustainability (Rosenzweig and Hillel 1998). Changes in atmospheric carbon dioxide concentration ([CO2]), air temperature, and seasonal rainfall patterns are expected to affect crop production worldwide (Ludwig and Asseng 2006; Tubiello et al. 2007). Increases in temperature make the development of the plants faster, so they reach maturity sooner (Ritchie and NeSmith 1991). In cooler regions, where planting dates cannot be anticipated because of lower temperatures, too much higher temperature between anthesis and maturity will cause the time to senescence to shorten. An increased demand for water in response to higher transpiration rate is also expected (Kimball et al. 1995; Reyenga et al. 1999). On the other hand, higher [CO2] may reduce transpiration in some crops by lowering stomatal conductance (Tubiello et al. 2000). Projected changes in rainfall patterns might positively or negatively affect crop production. In arid areas, production is likely to increase with additional rainfall, while in humid areas, more rainfall would mean either no significant change in production, or a decrease due to waterlogging, increased leaching of soil nitrogen, and increased greenhouse gas emissions (Ludwig and Asseng 2006; Grace et al. 2011). In irrigated agriculture, climate change scenarios are likely to affect the availability and demand for water. Irrigated agriculture occupies only one-fifth of the global cropped area but produces about two-fifths of the food supply. It is important to protect such areas in order to meet the growing demand for food. However, it is not clear whether there will be enough water in the future to meet such demand (Payero et al. 2009).
The effects of high [CO2] on crop yield have been studied in open-field experiments, such as free-air carbon dioxide enrichment (FACE) experiments, and in experiments with open-top chambers (Kimball et al. 1997, 2002; Ewert et al. 1999; Tubiello et al. 1999). However, the influence of future climate change on the soil–plant–atmosphere system, its productivity, and its agronomic management options is difficult to predict and to quantify with field experiments alone. Therefore, process-oriented crop growth models can be useful in simulating the impact of climate change on daily crop growth and development rates throughout the growing season (Keating et al. 2003; Basso et al. 2011; Grace et al. 2011). The strength of these models is their ability to integrate the effects of temporal and multiple stresses on crop growth under different environmental and management conditions (Hammer and Muchow 1994; Batchelor et al. 2002; Basso et al. 2007). Many of these models have been tested using data from the FACE experiments, concentrating on the effects of high [CO2] on crop production (Grant et al. 1995; Jamieson et al. 2000; Boote et al. 2011).
Crop simulation models have been applied to provide answers to practical production questions. For example, Ludwig and Asseng (2006) found that interactions between [CO2], temperature, and rainfall were not linear and their effects on wheat yields varied with soil type and geographical locations. Simulations in subtropical south-east Queensland have shown that the effects of climate change on the production of prime hard wheat would cause reduction in grain protein under increased [CO2] with an increase in the incidence of ‘heat shock’ (Reyenga et al. 1999). Similar results were found in South Australia for rainfed wheat (Luo et al. 2003). Crop simulation models have also been used to investigate the effects of wheat sowing dates as an adaptation strategy to climate change (Ghaffari et al. 2002). Tubiello et al. (2000) studied the effects of climate change on crop rotations in both irrigated and rainfed systems. They found that climate change would negatively affect crop yield unless current agronomic practices are modified, and the only cropping systems that would be able to adapt to climate change are the ones with irrigation, but they would still be dependent on irrigation water availability (Tubiello et al. 2000).
In Australia, agriculture is the major consumer of water, and the state of Queensland uses 2058 GL year–1. In south-east Queensland, 78 700 ha of irrigated land is dedicated to grain cereals (Australian Bureau of Statistics 2009). Jones (2000) used probability distributions to quantify the effects of climate change on irrigation requirements in southern Australia, finding that in the next 50 years, 20–60% more irrigation water will be needed compared with current use. Future impacts of climate change and the interaction between changes in [CO2], temperature, and rainfall are expected to be felt in irrigated agriculture, but the impacts cannot be directly measured (Ludwig and Asseng 2006). Use of simulation models to determine potential impacts of predicted climate change scenarios on irrigated systems will provide information for growers and regional water management bodies to put in place suitable strategies to accommodate changes in crop management and irrigation practices. General predictions of climate change scenarios have been formulated at the global scale by the Intergovernmental Panel for Climate Change (IPCC 2007a), and predictions have been made for some regions. The global climate projections of the IPCC are based on a fixed set of realistic greenhouse gas emission scenarios. The multi-model consensus is that there will be an increase in atmospheric [CO2] and in surface air temperature, although the exact magnitudes of such increases are less certain (IPCC 2007b). Information is still lacking on the nature and magnitude of the impact of potential climate change scenarios at the local level and on the best strategies and crop management practices to put in place to effectively adapt to these changes. The objectives of this study were to: (1) simulate the effect of projected climate change on wheat yield and water use for the subtropical environment of the Darling Downs, Queensland; and (2) investigate the impact of changing sowing date, as an adaptation strategy to future climate change scenarios, on wheat yield and water use.
Materials and methods
Crop growth model
Simulations for different climate change and crop management scenarios (described below) were performed using DSSAT 4.5 (Decision Support Systems for Agrotechnology Transfer) (Hoogenboom et al. 2010), which uses the CERES crop model for wheat (Ritchie and Otter-Nacke 1985) to simulate crop development. DSSAT 4.5 is a process-oriented model that simulates crop growth and development as a response to environmental conditions (soil, weather, and atmospheric [CO2]), genetics, and management strategies. It has an ‘Environmental modifications’ procedure that allows simulation of future climate change scenarios by modifying up to eight environmental variables including: daylength (h), solar radiation (MJ m–2 day–1), maximum and minimum daily air temperature (°C), precipitation (mm), [CO2] (ppm), relative humidity (%), and wind speed (km day–1).
Model calibration and validation
The model was calibrated and validated using data from a field experiment with wheat (Triticum aestivum L. cv. Lang) conducted during 2008 at the Kingsthorpe Research Station of Agri-Science Queensland, Department of Agriculture, Fisheries and Forestry. Usually, several years are used to test the model genetic coefficients. However, the choice of model calibration and evaluation depends on the objective of the study, in this case to test the model’s response to climate change, in particular crop water use. Therefore, it was important to get a proper calibration and subsequent evaluation at different irrigation levels, rather than using several sites or several years but without irrigation treatments. We first used plots with no water and no nitrogen (N) stresses, testing the model under maximum potential conditions. Subsequently, we used another three treatments (termed T60, T70, T85%; see details below), which represent treatments with increasingly lower irrigation amount (T85%). These treatments were used to evaluate the model response to different irrigation levels.
Kingsthorpe Research Station is located in southern Queensland (27°30′44.5″S; 151°46′54.5″E; 431 m above mean sea level), in a subtropical climate. The soil at the site is a Haplic, self-mulching, black Vertosol according to the Australian Soil Classification (Isbell 1996). Soil properties for the site, used as input to the model, are shown in Table 1. From this information, soil water limits needed by the model were calculated using the procedure suggested by Ritchie et al. (1999).

|
The field experiment used a randomised complete block design with four irrigation treatments and three replications, with optimal N fertiliser inputs (200 kg N ha–1). The field experiment had one fully irrigated and three deficit-irrigated treatments. The four irrigation treatments (T50%, T60%, T70%, and T85%) when 50, 60, 70, or 85%, respectively, of the plant-available soil water content was depleted. The fully irrigated treatment (T50%) received 197 mm of irrigation split in six applications; the first deficit-irrigated (T60%) treatment received 154 mm in six applications; the second deficit-irrigated treatment (T70%) received 79 mm in four applications; and the third deficit-irrigated treatment (T85%) received 73 mm in three applications. Irrigations were scheduled based on weekly measurements of soil profile water content (at depth increments of 0.10 m) using the neutron probe method (Dasberg and Dalton 1985). Irrigation was applied using a solid-set sprinkler system. The crop was sown on 6 June and harvested on 10 November 2008.
Model calibration, evaluation, and simulation of different climate change and crop management scenarios were conducted using daily weather data recorded at the Oakey Weather Station by the Australian Bureau of Meteorology (www.longpaddock.qld.gov.au/silo/) for the period 1959–2008. Weather data included solar radiation (MJ m–2 day–1), maximum and minimum air temperature (°C), and rainfall (mm day–1).
The cultivar-specific genetic coefficients were obtained by calibrating the model using the T50% treatment, with measurements of developmental stages, harvested grain yield, crop biomass, soil water content, unit grain weight, and grain N. The model was evaluated against measured biomass and grain yield of the deficit-irrigated treatments using the root mean square error (RMSE):

where yi is measured value,  is simulated value, and n is number of pairs of measured and simulated values.
Model outputs relevant to this study were grain yield (GY, kg ha–1), evapotranspiration (ET, mm), biomass, days to maturity and to anthesis (after sowing), and ‘stress days.’ The model calculated two different effects of water stress, one affecting expansive growth and the other affecting growth and biomass production. First, the model compared the potential transpiration and potential root water uptake. When plants were well irrigated, potential root water uptake was higher than potential transpiration. As the soil water was depleted, potential root water uptake decreased until the first threshold that modulated expansive growth was met. As the soil continued to dry to the point where potential transpiration was higher than potential root water uptake, the second threshold that affected crop growth and biomass production was met (Jones et al. 2003). In this study, ‘stress days’ represented the number of days when this second threshold was met. From the simulated GY and ET, water-use efficiency (WUE, kg ha–1 mm–1) was calculated as:

Simulation scenarios
In this study, the consequences of uncertainty in future climate projections and crop management on water use and crop yield were evaluated. Natural climate variability, model uncertainty, and scenario uncertainty are the three sources of uncertainty in climate projections. Of these, model and scenario uncertainty play a dominant role at time horizons of 30–50 years and beyond (Hawkins and Sutton 2009). The multi-model climate projections from the IPCC Coupled Model Intercomparison Project (CMIP3: www-pcmdi.llnl.gov/ipcc/about_ipcc.php) for the period 2030–2070 were used in this study. These projections were based on the low (B1), medium (A1B), and high (A1Fl) emission scenarios defined in the IPCC Special Report on Emission Scenarios (Nakicenovic et al. 2000). The projected changes in temperature and precipitation differ among global circulation models (GCMs) and emission scenarios. In order to encompass the climate projection uncertainty, it is informative to consider the range of projected change that is implied by the spread of outcomes from all models and all emission scenarios. In the present study, the 10% of future simulations resulting in the least amount of climate change (10th percentile) and the 10% of future simulations resulting in the largest amount of climate change (90th percentile) relative to the period 1980–2000 were used to constrain the bounds of projected climate uncertainty.
The projected mid-Century temperature change for autumn (March, April, May) and winter (June, July, August) for south-east Queensland ranges from <1°C (10th percentile for the low-emission scenario) to >3°C (90th percentile for the high-emission scenario). For precipitation change, the projected range is from ~30% reduction to 20% increase (CSIRO and BoM 2007). In addition to the uncertainty of temperature and precipitation described above, the underlying uncertainty in projected [CO2] was taken into account by considering a range of values corresponding to: current atmospheric [CO2] (~380 ppm), projected [CO2] with medium emissions (A1B scenario) (~500 ppm by mid-Century), and projected [CO2] with high emissions (A1Fl scenario) (~600 ppm by mid-Century) (IPCC 2007a).
The variables (temperature, [CO2], rainfall, sowing dates, and irrigation regime) used for building the simulation scenarios are described in Table 2. Simulations for the three irrigation regimes were conducted based on several assumptions. For the no irrigation (NI) regime, no irrigation was applied. For the deficit-irrigation (DI) regime, 25 mm was applied at sowing, 22 mm at first node, 51 mm around the third-node stage, 13 mm at first awn, and two irrigations (39 and 34 mm) just before anthesis. For the full-irrigation (FI) regime, irrigation was applied using the ‘Automatic when required’ option of DSSAT 4.5, which applied irrigation when 50% of available soil water in the crop root-zone was depleted.

|
The temperature change (0°C, 1°C, 2°C, or 3°C) was added to the observed Tmax and Tmin for each day of the simulation. Similarly, precipitation was modified by the percentage change (–30%, 0%, or +20%); since the observational data specify a numeric value at each point in time, trace events were treated in the same way as all other precipitation events.
Results
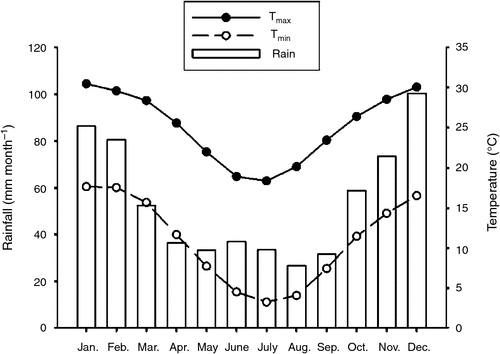
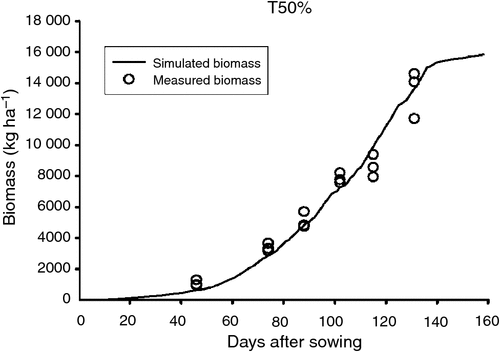
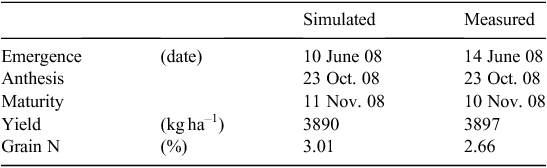
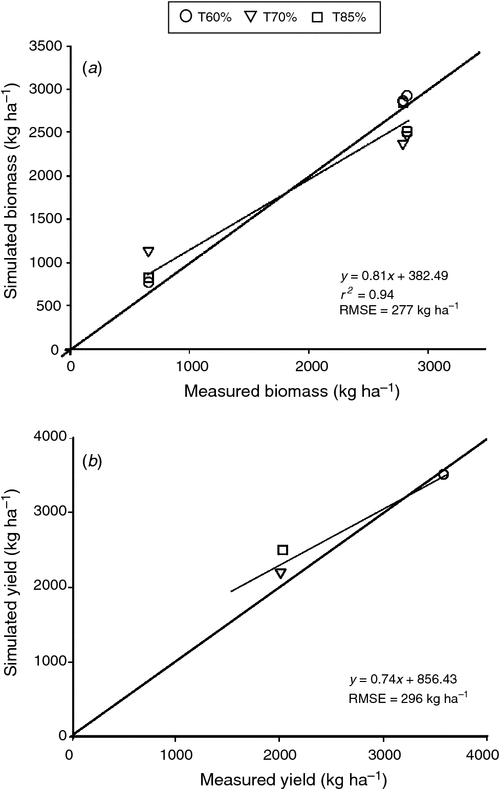
Monthly long-term averages of rainfall and maximum and minimum air temperatures are shown in Fig. 1. Results of model calibration are shown in Fig. 2 and Table 3. Emergence date was simulated 4 days earlier than the measured one. Anthesis date was well simulated, while the maturity date was simulated 1 day later. Grain yield simulation was 222 kg ha–1 lower than the measured one. Grain N difference between simulated and measured was 0.35% (Table 3), and crop biomass was well simulated as shown in Fig. 2. Results of model evaluation are shown in Fig. 3a, b. There was good agreement between simulated and measured biomass at anthesis (Fig. 3a), with a RMSE of 277 kg ha–1. Grain yield was well simulated for the three irrigation treatments, with an overall RMSE of 296 kg ha–1.
|
|
|
|
The effects of temperature, rainfall, and [CO2] on yield, plant transpiration, and soil evaporation for the six sowing dates and three irrigation regimes are shown in Tables 4–9. Overall, GY increased from NI to FI for all sowing dates and all of the different temperature, rainfall, and [CO2] combinations. Grain yield decreased from the first to the last sowing date (Tables 4–9). Stress days increased from the first to the last sowing date, with a minimum of one stress day in May to a maximum of eight in June.

|

|

|

|

|

|
An increase in temperature did not reduce grain yield significantly under the NI scenario for all sowing dates, but it increased GY under the DI and FI scenarios for all sowing dates (Tables 4–9). Reduction in rainfall (–30%) decreased GY for the NI scenario at all three [CO2], while an increase in rainfall (+20%) increased GY. Grain yield increased under higher [CO2]. Overall, GY varied between 1793 and 4383 kg ha–1 for the NI, 2986 and 5978 kg ha–1 for the DI, and 3858 and 6375 kg ha–1 for the FI irrigation scenario. The high values of GY were obtained for the first sowing date. Plant transpiration increased from the NI to the FI regime for all scenarios. Transpiration ranged between 89 and 206 mm for the NI, 201 and 363 mm for the DI, and 266 and 454 mm for the FI scenario (Tables 4–9). Soil evaporation varied between 133 and 180 mm for the NI, 119 and 204 mm for the DI, and 124 and 220 mm for the FI scenario.
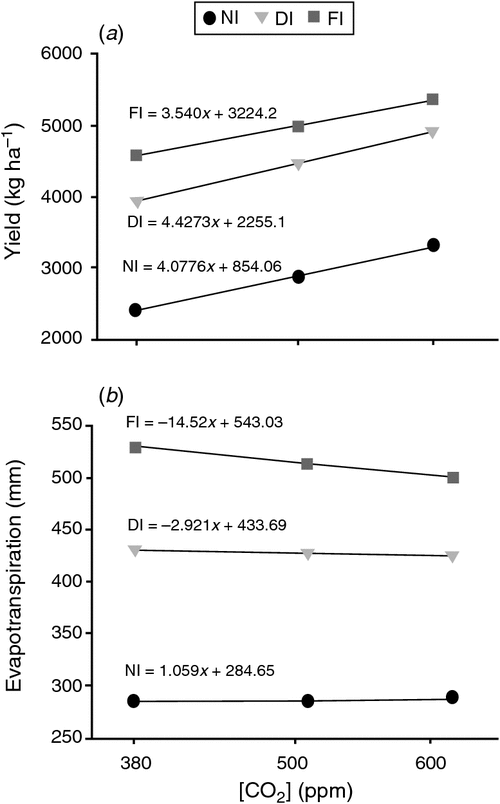
For the three irrigation scenarios, GY increased linearly with [CO2] in the range 380–600 ppm (Fig. 4a). Yield increased from 2411 to 3310 kg ha–1 for the NI scenario, from 3942 to 4917 kg ha–1 for the DI scenario, and from 4574 to 5345 kg ha–1 for the FI scenario. The highest GY increase was simulated for the NI scenario and the lowest for the FI scenario (Fig. 4a). On the other hand, ET decreased slightly with an increase in [CO2], from 430 to 424 mm for the DI scenario and from 528 to 499 mm for the FI scenarios, but increased slightly from 285 to 287 mm for the NI scenario (Fig. 4b). However, these simulated changes in ET with an increase in [CO2], especially for the DI (6 mm) and NI (2 mm) scenarios, are so small that in practical terms it can be assumed that no significant change in ET actually occurred. The difference for the FI scenario was 29 mm, which is more significant, representing 5.5% of the ET under the current [CO2] scenario.
|
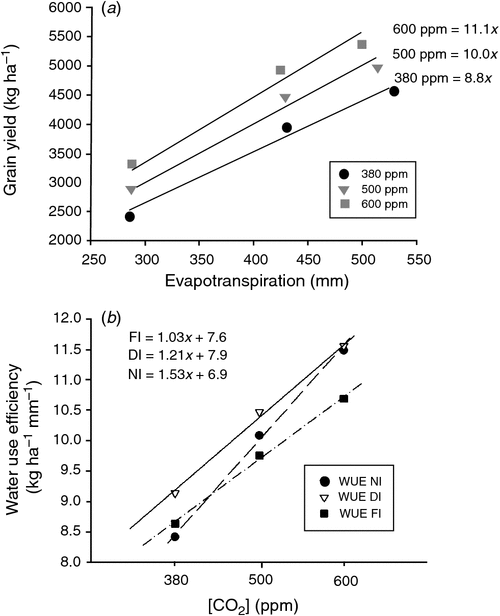
Grain yield increased almost linearly with ET for each [CO2], with higher yields corresponding to higher [CO2] (Fig. 5a). The slope of the line in Fig. 5a increased with [CO2] from 8.8 kg ha–1 mm–1 at 380 ppm to 11.1 kg ha–1 mm–1 at 600 ppm. The WUE for each irrigation scenario increased linearly with [CO2], and scenarios with more irrigation tended to have lower WUE (Fig. 5b). Under the current [CO2] (380 ppm), WUE was 8.4 kg ha–1 mm–1 for the NI scenario, 9.1 kg ha–1 mm–1 for the DI scenario, and 8.6 kg ha–1 mm–1 for the FI scenario. At 500 ppm, simulated WUE increased to 10.1, 10.5, and 9.7 kg ha–1 mm–1 for the NI, DI, and FI scenarios, respectively. At 600 ppm, WUE further increased to 11.5, 11.6, and 10.6 kg ha–1 mm–1 for the NI, DI, and FI scenarios, respectively.
|
Discussion
The long-term simulation of crop growth and development allowed us to study the effects of projected climate change on wheat production and water use for the subtropical environment of the Darling Downs, Queensland. We were also able to evaluate the impact of changing sowing dates and applying different irrigation management regimes as potential adaptation strategies for future climate change scenarios. Our results showed that both sowing date and irrigation practice influenced wheat yield and water use.
Our simulations showed that higher temperatures did not reduce GY significantly, because clay soils are less susceptible to the effects of higher temperatures, since its negative effect in terms of reduced length of crop growing season is compensated by an increase in harvest index as demonstrated by Ludwig and Asseng (2006). A reduction in rainfall of 30% caused a decline in GY, especially under the NI scenario and mildly under DI, whereas under FI it was unaffected. Under NI, a reduction in rainfall during the growing season limits top growth and the production of an adequate leaf area, and therefore causes biomass to be translocated later to the grains (Asseng and Van Herwaarden 2003). This area of Queensland had an average growing season rainfall of 262 mm for the 50 years of weather data (Fig. 1); therefore, stored water before sowing is important because under non-irrigation, it is used by crops later in the season.
However, GY tended to decrease from early to later sowing dates, since later sowing dates moved the flowering period towards higher average temperatures, which negatively affected wheat crop yield. Crop phenology accelerated at higher temperatures, which reduced yield. Such acceleration caused smaller plants, shorter reproductive phase, and less radiation interception during the crop growing season (Hatfield et al. 2011). Later planting dates moved the anthesis and grain-filling stages towards warmer temperatures with higher risk of water stress. In fact, for the first three sowing dates (1, 10, and 20 May) there were, on average, only three ‘stress days’, whereas for the last three sowing dates (1, 10, and 20 June) there were, on average, seven stress days (Tables 4–9) for the NI and DI scenarios. Water stress at flowering can severely reduce seed set or influence grain filling, causing low yield (Passioura 2006). For the DI scenario, irrigation was applied around anthesis, but it is possible that the irrigation depth applied for the June sowing dates was not enough to meet crop water demand and avoid water stress at that sensitive stage. The FI scenario, on the other hand, was set to irrigate whenever the crop depleted 50% of the plant-available water content, and therefore, the crop was not stressed at any stage. The reduction in GY for the later sowing dates for this scenario was, therefore, mainly due to the shortening of growing season length.
Our results showed that an increase in atmospheric [CO2] from 380 to 600 ppm would increase wheat grain yields by 17%, 25%, and 37% for the FI, DI, and NI scenarios, respectively (Fig. 4a). Kimball et al. (1992) suggested that higher [CO2] would lead to partial stomatal closure, reducing transpiration and increasing leaf temperature. However, the increase in leaf temperature would then increase internal water vapour pressure, leading to an increase in transpiration, which would counterbalance the initial effect of increased [CO2] on stomatal closure. These results agree with those of Ludwig and Asseng (2006), who found a yield increase of 31% by increasing [CO2] to 700 ppm in a water-limited environment. Also, Reyenga et al. (1999) reported a grain yield increase of 26–37% under increased [CO2] in south-east Queensland.
The decrease in ET at higher [CO2] for the irrigated scenarios agrees with the findings of Andre and du Cloux (1993), who found a reduction in wheat transpiration of 8% at double [CO2], and with those of Boote et al. (1997), who using a crop simulation model found that increased [CO2] reduced ET by 6–8% for irrigated sites and 4% for rainfed sites. In our study, doubling [CO2] decreased ET by 6% and 1% for the FI and DI scenarios, respectively, but slightly increased ET by 0.07% for the NI scenario. The slight increase for the NI scenario could be due to changes in the pattern and timing of crop water use as [CO2] increased. This can be explained because once the stomata are closed as a result of depleted soil water, elevated [CO2] has no effect on ET; and if soil water is limiting over the crop growing season, the total ET will not be affected (Kimball 2012). Under deficit-irrigated conditions, the onset of crop stress as soil water content is depleted normally causes a decline in the rate of crop water use. Under such conditions, it has been suggested that the impact of high [CO2] would be to increase soil water content (Hatfield et al. 2011). Under the DI scenario, the timing and depth of irrigation applied influenced the water use under increasing [CO2]. For this scenario, the crop experienced severe water stress during anthesis because the amount of water applied at that stage was not sufficient and affected the magnitude and pattern of crop water use. The implication of these findings is that, under increased [CO2], the current timing of irrigation applications will need to be adjusted to avoid crop stress during anthesis, which could have a detrimental effect on crop yield.
The slope of the relationship between GY and ET was 8.8 kg ha–1 mm–1 at 380 ppm and 11.1 kg ha–1 mm–1 at 600 ppm (Fig. 5a). Therefore, increasing [CO2] from 380 to 600 ppm increased the slope of the relationship by 26%. Figure 5b shows that increasing [CO2] from 380 to 600 ppm increased WUE by 37% for the NI, by 27% for the DI, and by 23% for the FI scenario. These findings agree with results reported by Boote et al. (1997) and Allen et al. (2003) on soybean and wheat. For the DI and NI scenarios, the positive impact of increased [CO2] on WUE was mostly due to an increase in crop yield, since the corresponding change in crop ET was quite small. For the FI scenario, on the other hand, the increase in WUE as [CO2] increased was due to the combination of higher yield and lower ET. As has previously been suggested, increasing [CO2] reduces crop stomatal conductance, decreasing ET and, consequently, conserving soil water. Wall et al. (2006) found that in wheat, such a mechanism enhanced yield, growth, and photosynthesis. In fully irrigated crops, however, Ottman et al. (2001) did not find such positive effects. Ritchie and Basso (2008) underlined the crucial role of agronomic management in increasing WUE. They showed that yield increase due to improved management will also lead to a higher WUE when water supply is not limited.
One limitation of this study is the implicit assumption that climate change would affect local variables (i.e. temperature and precipitation) simply by shifting the means of their distributions. The climate change approach adopted in this study (the difference between current and projected future climate is added to individual historical weather variables) is known as the ‘Delta method’ and is widely used in hydrological climate-impact studies (e.g. Markoff and Cullen 2008; Buytaert et al. 2009; Elsner et al. 2010; O’Leary et al. 2011). Although basing future climate scenarios on historical climate is an approach that has been previously employed (O’Leary et al. 2011), it is recognised that such an approach may not be entirely accurate. Future climate scenarios might have more variable rainfall and temperature, which would certainly affect crop production (Mearns et al. 1997). However, there is little climate modelling consensus about the exact nature of such higher order, climate-variable changes. An alternative approach to simulate future climate in this study would have been to employ dynamical or a more sophisticated statistical downscaling of GCMs. Such an approach, however, would either be prohibitively computationally expensive (in the case of comprehensive dynamical downscaling) or highly model-dependent, and at any rate would add an additional aspect of uncertainty to the climate projections. Using historical weather data and modifying the rainfall, temperature, and [CO2] values, however, allowed us to investigate the effect of climate projection uncertainty and show both the interaction between those factors and their separate effects on crop development and water use.
Conclusions
This study highlighted the effects of possible future climate change on crop grain yield and water use in south-east Queensland. Sowing dates and irrigation practices influenced wheat yield and water use. Early sowing dates and targeted deficit irrigation when water is limited are two adaptation strategies for future climate change scenarios. Later sowing dates showed the lowest yield response due to an increase in consecutive days of water stress around anthesis.
Acknowledgments
We acknowledge the contribution of: Agri-Science Queensland, The University of Queensland, the Cotton Research and Development Corporation (CRDC), the Grains Research and Development Corporation (GRDC), and the Cotton Communities CRC for providing funds for this project; and Geoff Robinson for providing technical support for the field component of this study.
References
Allen LH, Pan D, Boote KJ, Pickering NB, Jones JW (2003) Carbon dioxide and temperature effects on evapotranspiration and water-use efficiency of soybean. Agronomy Journal 95, 1071–1081.| Carbon dioxide and temperature effects on evapotranspiration and water-use efficiency of soybean.Crossref | GoogleScholarGoogle Scholar |
Andre M, du Cloux H (1993) Interaction of CO2 enrichment and water limitations on photosynthesis and water use efficiency in wheat. Plant Physiology and Biochemistry 31, 103–112.
Asseng S, Van Herwaarden AF (2003) Analysis of the benefits to wheat yield from assimilates stored prior to grain filling in a range of environments. Plant and Soil 256, 217–229.
| Analysis of the benefits to wheat yield from assimilates stored prior to grain filling in a range of environments.Crossref | GoogleScholarGoogle Scholar | 1:CAS:528:DC%2BD3sXot1ClsLY%3D&md5=d4bc0824ee529a956afa87c092a70e2cCAS |
Australian Bureau of Statistics (2009) Water Use on Australian Farms, 2008–09. Available online at: www.abs.gov.au/ausstats/abs@.nsf/mf/4618.0
Basso B, Bertocco M, Sartori L, Martin EC (2007) Analyzing the effects of climate variability on spatial pattern of yield in a maize–wheat–soybean rotation. European Journal of Agronomy 26, 82–91.
| Analyzing the effects of climate variability on spatial pattern of yield in a maize–wheat–soybean rotation.Crossref | GoogleScholarGoogle Scholar |
Basso B, Ritchie JT, Cammarano D, Sartori L (2011) A strategic and tactical management approach to select optimal N fertilizer rates for wheat in a spatially variable field. European Journal of Agronomy 35, 215–222.
| A strategic and tactical management approach to select optimal N fertilizer rates for wheat in a spatially variable field.Crossref | GoogleScholarGoogle Scholar |
Batchelor WD, Basso B, Paz JO (2002) Examples of strategies to analyze spatial and temporal yield variability using crop models. European Journal of Agronomy 18, 141–158.
| Examples of strategies to analyze spatial and temporal yield variability using crop models.Crossref | GoogleScholarGoogle Scholar |
Boote KJ, Pickering NB, Allen LH Jr (1997) Plant modelling: Advances and gaps in our capability to project future crop growth and yield in response to global climate change. In ‘Advances in carbon dioxide effects research’. ASA Special Publication No. 61. (Eds LH Allen et al.) (ASA, CSSA, and SSSA: Madison, WI)
Boote KJ, Allen LH Jr, Prasad PV, Jones JW (2011) Testing effects of climate change in crop models. In ‘Handbook of climate change and agroecosystems’. (Eds D Hillel, C Rosenzweig) (Imperial College Press: London)
Buytaert W, Celleri R, Timbe L (2009) Predicting climate change impacts on water resources in the tropical Andes: the effects of GCM uncertainty. Geophysical Research Letters 36, L07406
| Predicting climate change impacts on water resources in the tropical Andes: the effects of GCM uncertainty.Crossref | GoogleScholarGoogle Scholar |
CSIRO and BoM (2007) Climate Change in Australia. Commonwealth Scientific and Industrial Research Organisation and Bureau of Meteorology Technical Report 2007, CSIRO, Melbourne.
Dasberg S, Dalton FN (1985) Time domain reflectometry field measurements of soil water content and electrical conductivity. Soil Science Society of America Journal 49, 293–297.
| Time domain reflectometry field measurements of soil water content and electrical conductivity.Crossref | GoogleScholarGoogle Scholar |
Elsner MM, Cuo L, Voisin N, Deems JS, Hamlet AF, Vano JA, Mickelson KEB, Lee S-Y, Lettenmaier DP (2010) Implications of 21st century climate change for the hydrology of Washington State. Climatic Change 102, 225–260.
| Implications of 21st century climate change for the hydrology of Washington State.Crossref | GoogleScholarGoogle Scholar |
Ewert F, Van Oijen M, Porter JR (1999) Simulation of growth and development processes of spring wheat in response to CO2 and ozone for different sites and years in Europe using mechanistic crop simulation models. European Journal of Agronomy 10, 231–247.
| Simulation of growth and development processes of spring wheat in response to CO2 and ozone for different sites and years in Europe using mechanistic crop simulation models.Crossref | GoogleScholarGoogle Scholar |
Ghaffari A, Cook HF, Lee HC (2002) Climate change and winter wheat management: a modelling scenario for South-eastern England. Climatic Change 55, 509–533.
| Climate change and winter wheat management: a modelling scenario for South-eastern England.Crossref | GoogleScholarGoogle Scholar | 1:CAS:528:DC%2BD38XnvFygu7Y%3D&md5=ef39217fc08afa74fedc46f630b0c6a8CAS |
Grace PR, Robertson PG, Millar N, Colunga-Garcia M, Basso B, Gage SH, Hoben J (2011) The contribution of maize cropping in the Midwest USA to global warming: A regional estimate. Agricultural Systems 104, 292–296.
| The contribution of maize cropping in the Midwest USA to global warming: A regional estimate.Crossref | GoogleScholarGoogle Scholar |
Grant RF, Garcia RL, Pinter PJ, Hunsaker D, Kimball BA, LaMorte RL (1995) Interaction between atmospheric CO2 concentration and water deficit on gas exchange and crop growth: testing of ecosys with data from the Free Air CO2 Enrichment (FACE) experiment. Global Change Biology 1, 443–454.
| Interaction between atmospheric CO2 concentration and water deficit on gas exchange and crop growth: testing of ecosys with data from the Free Air CO2 Enrichment (FACE) experiment.Crossref | GoogleScholarGoogle Scholar |
Hammer GL, Muchow RC (1994) Assessing climatic risk to sorghum production in water-limited subtropical environments. I. Development and testing of a simulation model. Field Crops Research 36, 221–234.
| Assessing climatic risk to sorghum production in water-limited subtropical environments. I. Development and testing of a simulation model.Crossref | GoogleScholarGoogle Scholar |
Hatfield JL, Boote KJ, Kimball BA, Ziska LH, Izaurralde RC, Ort D, Thomson AM, Wolfe D (2011) Climate change impact on agriculture: Implication for crop production. Agronomy Journal 103, 351–370.
Hawkins E, Sutton RT (2009) The potential to narrow uncertainty in regional climate predictions. Bulletin of the American Meteorological Society 90, 1095–1107.
| The potential to narrow uncertainty in regional climate predictions.Crossref | GoogleScholarGoogle Scholar |
Hoogenboom G, Jones JW, Wilkens PW, Porter CH, Boote KJ, Hunt LA, Singh U, Lizaso JL, White JW, Uryasev O, Royce FS, Ogoshi R, Gijsman AJ, Tsuji GY (2010) Decision Support System for Agrotechnology Transfer (DSSAT), Version 4.5 (CD‐ROM). University of Hawaii, Honolulu, HI.
IPCC (2007a) Climate change 2007: Synthesis report. In ‘Contribution of Working Groups I, II and III to the Fourth Assessment Report of the Intergovernmental Panel on Climate Change’. (Eds RK Pachauri, A Reisinger) (IPCC: Geneva)
IPCC (2007b) ‘Summary for policymakers.’ (Eds S Solomon, D Qin, M Manning, Z Chen, M Marquis, KB Averyt, M Tignor, HL Miller) (Cambridge University Press: Cambridge, UK)
Isbell RF (1996) ‘The Australian Soil Classification.’ (CSIRO Publishing: Melbourne)
Jamieson PD, Berntsen J, Ewert F, Kimball BA, Olesen JE, Pinter PJ, Porter JR, Semenov MA (2000) Modelling CO2 effects on wheat with varying nitrogen supplies. Agriculture, Ecosystems & Environment 82, 27–37.
| Modelling CO2 effects on wheat with varying nitrogen supplies.Crossref | GoogleScholarGoogle Scholar | 1:CAS:528:DC%2BD3cXot12lur0%3D&md5=be0d5f57cf3037ba286ff93ac1d9ac09CAS |
Jones RN (2000) Analysing the risk of climate change using an irrigation demand model. Climate Research 14, 89–100.
| Analysing the risk of climate change using an irrigation demand model.Crossref | GoogleScholarGoogle Scholar |
Jones JW, Hoogenboom G, Porter CH, Boote KJ, Batchelor WD, Hunt LA, Wilkens PW, Singh U, Gijsman AJ, Ritchie JT (2003) The DSSAT cropping system model. European Journal of Agronomy 18, 235–265.
| The DSSAT cropping system model.Crossref | GoogleScholarGoogle Scholar |
Keating BA, Carberry PS, Hammer GL, Probert ME, Robertson MJ, Holzworth DP, Huth NI, Hargreaves JNG, Meinke H, Hochman Z, McLean G, Verburg K, Snow VO, Dimes JP, Silburn DM, Wang E, Brown SD, Bristow KL, Asseng S, Chapman SC, McCown RL, Freebairn DM, Smith CJ (2003) An overview of APSIM, a model designed for farming systems simulation. European Journal of Agronomy 18, 267–288.
| An overview of APSIM, a model designed for farming systems simulation.Crossref | GoogleScholarGoogle Scholar |
Kimball BA (2012) Lessons from FACE: CO2 effects and interactions with water, nitrogen and temperature. In ‘Handbook of climate change and agroecosystems’. (Eds D Hillel, C Rosenzweig) (Imperial College Press: London)
Kimball BA, LaMorte RL, Peresta GJ, Mauney JR, Lewin KF, Hendrey GR (1992) Appendix I: Weather, soils, cultural practices and cotton growth data from the 1989 FACE experiment in IBSNAT format. Critical Reviews in Plant Sciences 11, 271–308.
| Appendix I: Weather, soils, cultural practices and cotton growth data from the 1989 FACE experiment in IBSNAT format.Crossref | GoogleScholarGoogle Scholar |
Kimball BA, Pinter PJ, Garcia RL, LaMorte RL, Wall GW, Hunsaker DJ, Wechsung G, Wechsung F, Kartschall T (1995) Productivity and water use of wheat under free-air CO2 enrichment. Global Change Biology 1, 429–442.
| Productivity and water use of wheat under free-air CO2 enrichment.Crossref | GoogleScholarGoogle Scholar |
Kimball BA, Pinter PJ Jr, Wall GW, Garcia RL, LaMorte RL, Jak PMC, Frumau KFA, Vugts HF (1997) Comparisons of responses of vegetation to elevated carbon dioxide in Free-Air and Open-Top chamber facilities. In ‘Advances in carbon dioxide effects research’. ASA Special Publication No. 61. pp. 113–130. (ASA, CSSA, and SSSA: Madison, WI)
Kimball BA, Kobayashi K, Bindi M (2002) Responses of agricultural crops to free-air CO2 enrichment. Advances in Agronomy 77, 293–368.
| Responses of agricultural crops to free-air CO2 enrichment.Crossref | GoogleScholarGoogle Scholar |
Ludwig F, Asseng S (2006) Climate change impacts on wheat production in a Mediterranean environment in Western Australia. Agricultural Systems 90, 159–179.
| Climate change impacts on wheat production in a Mediterranean environment in Western Australia.Crossref | GoogleScholarGoogle Scholar |
Luo Q, Williams MAJ, Bellotti W, Bryan B (2003) Quantitative and visual assessments of climate change impacts on South Australian wheat production. Agricultural Systems 77, 173–186.
| Quantitative and visual assessments of climate change impacts on South Australian wheat production.Crossref | GoogleScholarGoogle Scholar |
Markoff MS, Cullen AS (2008) Impact of climate change on Pacific Northwest hydropower. Climatic Change 87, 451–469.
| Impact of climate change on Pacific Northwest hydropower.Crossref | GoogleScholarGoogle Scholar |
Mearns LO, Rosenzweig C, Goldberg R (1997) Mean and variance change in climate scenarios: Methods, agricultural applications, and measures of uncertainty. Climatic Change 35, 367–396.
| Mean and variance change in climate scenarios: Methods, agricultural applications, and measures of uncertainty.Crossref | GoogleScholarGoogle Scholar |
Nakicenovic N, Alcamo J, Davis G, de Vries B, Fenhann J, Gaffin S, Gregory K, Grübler A, Jung TY, Kram T, La Rovere EL, Michaelis L, Mori S, Morita T, Pepper W, Pitcher H, Price L, Riahi L, Roehrl A, Rogner HH, Sankovski A, Schlesinger M, Shukla P, Smith S, Swart R, van Rooijen S, Victor N, Dadi Z (2000) ‘Special report on emissions scenarios.’ A Special Report of Working Group III of the Intergovernmental Panel on Climate Change. (Cambridge University Press: Cambridge, UK)
O’Leary G, Christy B, Weeks A, Nuttall J, Riffkin P, Beverly C, Fitzgerald G (2011) Downscaling global climatic predictions to the regional level: A case study of regional effects of climate change on wheat crop production in Victoria, Australia. In ‘Crop adaptation to climate change’. 1st edn (Eds S Shyam Yadav, RJ Redden, JL Hatfield, H Lotze-Campen, AE Hall) pp. 12–26. (John Wiley & Sons, Ltd: Chichester, UK)
Ottman MJ, Kimball BA, Pinter PJ, Wall GW, Vanderlip RL, Leavitt SW, LaMorte RL, Matthias AD, Brooks TJ (2001) Elevated CO2 increases sorghum biomass under drought conditions. New Phytologist 150, 261–273.
| Elevated CO2 increases sorghum biomass under drought conditions.Crossref | GoogleScholarGoogle Scholar |
Passioura JB (2006) Increasing crop productivity when water is scarce—from breeding to field management. Agricultural Water Management 80, 176–196.
| Increasing crop productivity when water is scarce—from breeding to field management.Crossref | GoogleScholarGoogle Scholar |
Payero JO, Tarkalson DD, Irmak S, Davison D, Petersen JL (2009) Effects of timing of a deficit-irrigation allocation on corn evapotranspiration, yield, water use efficiency and dry mass. Agricultural Water Management 96, 1387–1397.
| Effects of timing of a deficit-irrigation allocation on corn evapotranspiration, yield, water use efficiency and dry mass.Crossref | GoogleScholarGoogle Scholar |
Reyenga PJ, Howden SM, Meinke H, McKeon GM (1999) Modelling global change impacts on wheat cropping in South-east Queensland, Australia. Environmental Modelling & Software 14, 297–306.
| Modelling global change impacts on wheat cropping in South-east Queensland, Australia.Crossref | GoogleScholarGoogle Scholar |
Ritchie JT, Basso B (2008) Water use efficiency is not constant when crop water supply is adequate or fixed: The role of agronomic management. European Journal of Agronomy 28, 273–281.
| Water use efficiency is not constant when crop water supply is adequate or fixed: The role of agronomic management.Crossref | GoogleScholarGoogle Scholar |
Ritchie JT, NeSmith DS (1991) Temperature and crop development. In ‘Modelling plant and soil systems’. Agronomy Monograph No. 31. (Eds RJ Hanks, JT Ritchie) pp. 5–29. (American Society of Agronomy: Madison, WI)
Ritchie JT, Otter-Nacke S (1985) Description and performance of CERES-Wheat: a user-oriented wheat yield model. USDA-ARS Technical Report No. 38. pp. 159–175. (USDA-ARS: Washington, DC)
Ritchie JT, Gerakis A, Suleiman A (1999) Simple model to estimate field-measured soil water limits. Transactions of the American Society of Agricultural Engineers 42, 1609–1614.
Rosenzweig C, Hillel D (1998) ‘Climate change and the global harvest.’ (Oxford University Press: Oxford, UK)
Tubiello FN, Rosenzweig C, Kimball BA, Pinter PJ, Wall GW, Hunsaker DJ, LaMorte RL, Garcia RL (1999) Testing CERES-Wheat with Free-Air Carbon Dioxide Enrichment (FACE) Experiment data: CO2 and water interactions. Agronomy Journal 91, 247–255.
| Testing CERES-Wheat with Free-Air Carbon Dioxide Enrichment (FACE) Experiment data: CO2 and water interactions.Crossref | GoogleScholarGoogle Scholar |
Tubiello FN, Donatelli M, Rosenzweig C, Stockle CO (2000) Effects of climate change and elevated CO2 on cropping systems: model predictions at two Italian locations. European Journal of Agronomy 13, 179–189.
| Effects of climate change and elevated CO2 on cropping systems: model predictions at two Italian locations.Crossref | GoogleScholarGoogle Scholar |
Tubiello FN, Amthor JS, Boote KJ, Donatelli M, Easterling W, Fischer G, Gifford RM, Howden M, Reilly J, Rosenzweig C (2007) Crop response to elevated CO2 and world food supply – A comment on “Food for Thought..” by Long et al., Science 312, 1918–1921, 2006. European Journal of Agronomy 26, 215–223.
| Crop response to elevated CO2 and world food supply – A comment on “Food for Thought..” by Long et al., Science 312, 1918–1921, 2006.Crossref | GoogleScholarGoogle Scholar | 1:CAS:528:DC%2BD2sXitl2hsrw%3D&md5=ba61967cfe74f4c84dddf30f225cfb0eCAS |
Wall GW, Garcia RL, Kimball BA, Hunsaker DJ, Pinter PJ, Long SP, Osborn CP, Hendrix DL, Wechsung F, Wechsung G, Leavitt SW, LaMorte RL, Idso SB (2006) Interactive effects of elevated carbon dioxide and drought on wheat. Agronomy Journal 98, 354–381.
| Interactive effects of elevated carbon dioxide and drought on wheat.Crossref | GoogleScholarGoogle Scholar |