

Use of an ion-selective electrode for free copper measurements in low salinity and low ionic strength matrices
Julien Rachou A , Christian Gagnon B and Sébastien Sauvé A CA Department of Chemistry, Université de Montréal, Montréal, Québec H3C 3J7, Canada.
B St. Lawrence Centre, Environment Canada, Montreal, Quebec H2Y 2E7, Canada.
C Corresponding author: sebastien.sauve@umontreal.ca
Environmental Chemistry 4(2) 90-97 https://doi.org/10.1071/EN06036
Submitted: 7 June 2006 Accepted: 28 March 2007 Published: 17 April 2007
Environmental context. The toxicity of metals in the environment is controlled by several parameters including total metal concentration, pH and organic and inorganic ligands (type and concentration). The characterisation of different metal pools in natural matrices (e.g. seawater, soil) is important for the evaluation of their toxic impact. The copper ion-selective electrode (Cu-ISE) is a method of choice for the analytical determination of the speciation (i.e. chemical forms) of divalent copper in natural matrices. This paper clarifies several operational parameters in the hope of decreasing variability of results and increasing the application domain of the Cu-ISE.
Abstract. The determination of free copper concentrations in natural matrices is critical for the evaluation of copper toxicity. The ISE is one of the few analytical means for determining the direct speciation of free metal species. We have refined the method for low salinity and low ionic strength solutions for application with soil water extracts or fresh waters. Moreover, we have detailed and standardised a method for using a Cu-ISE with an autotitrator. The standardisation shows a good response and allows significant time saving (under 2 h for the calibration). The results obtained using the ISE are compared with those predicted in the presence of different organic ligands or even the lower free Cu2+ activities resulting from the formation of Cu hydroxyl species. The method was validated for the determination of Cu speciation at environmentally relevant free Cu2+ activity, i.e. ranging between 10−14 to 10−4 M. The chemical equilibrium calculations were made using the MINEQL+ software and the results agree well for pH values between 3 and 10. In terms of precision, the standard deviations of the measured values never exceed 0.1 units, and in terms of accuracy, the measured values were very close to the nominal values, within a range of 0.1. Outside the optimal pH range, the electrode yields higher activity than expected.
Introduction
Copper is an essential nutrient for plants and is a required constituent in many enzyme systems.[1,2] However, it can also be phytotoxic at high concentrations.[1] Bioavailability and toxicity of trace metals depend on the physical and chemical speciation of metals in the matrix. In a soil solution or natural waters, dissolved metal ions are usually associated with anions like OH–, Cl–, SO42– and humic and fulvic matter. One of the most bioavailable species of copper is divalent free copper.[3] The free copper activity represents the concentration of free cupric ions multiplied by its activity coefficient, a correction factor for the non-ideal behaviour of ionic solutions.[4] This value can be expressed as pCu; similar to pH, pCu represents the negative log10 of the molar activity of Cu2+ ions (pCu = –log aCu2+).
Copper is known to exhibit a strong affinity for natural ligands[5] and Cu(ii) is almost always entirely in organic complexes in naturals waters, which strongly influences its bioavailability and toxicity. Various techniques have been applied to the speciation of copper in environmental matrices, such as surface waters and soil solutions. The most often used are pH potentiometry,[6] cation-exchange resins,[7–9] charge separation (Donnan membrane),[10,11] anodic stripping voltammetry,[7,12–19] diffusive gradients in thin films measurements[18] and cupric ion-selective electrodes (ISE).[3,14,15,18–25] All these techniques have some advantages and disadvantages and none can be considered universal.
The extensive literature on Cu speciation with the cupric ISE, principally in estuarine and seawater, is due to the selectivity, the sensitivity and the ease of use of the method. The ion-exchange processes occurring between the ion-exchange sites at the outer surface of the ion-selective membrane of the electrode and the analyte solution are known to be responsible for the ISE response. Moreover, this response was shown to be particularly susceptible to the effects of surface reactions (like the presence of Cu(i), that may change the response slope of the electrode).[15] It has been reported that anions such as Cl– could also induce a response from the electrodes, principally due to a stabilisation of Cu(i) species.[26] Nevertheless, in most situations, this technique remains the method of choice for the measurements of free copper activities.
However, some adjustments and precision measurements have to be carried out. In fact, the detection limit is reported to be around 10−7 M by certain authors[14,20] and to be 10−19 M by others.[22,26] Why such a large difference? Because the lowest practical measurements of the ISE in dilute salt solutions is indeed near 10−7 M.[20] The difficulty in lowering this detection limit arises from the ubiquitous presence of copper in the salts used to standardise the ionic strength of the solution or in the Milli-Q (MQ) water; in fact, the electrode itself is a source of copper from dissolution of the solid state amalgam. It is therefore difficult to have reliable blank concentrations much below 10−7 M Cu. On the other hand, the detection limit can be dropped down to as low as 10−19 M in solutions where the free copper activity is well buffered with organic ligands.[22,26] For applications in seawater, the standard calibration procedure uses pCu buffer solutions prepared in artificial seawater with copper and organic ligands as complexing agents.[27,28]
Another potential problem for the use of the electrode is that the total dissolved copper concentration has to be higher than the minimum values required for proper response, which is generally assumed to be ~10−8 M.[26] That is because the Cu-ISE, like any other selective electrode, responds to the relative ionic activity of a global concentration of the target species. It is not, however, a real problem for most environmental applications (especially in soil extracts) because the total dissolved copper concentration is generally higher than 10−7 M or even >10−6 M.
Given the high affinity of copper for natural organic ligands (in circumneutral solutions, 98% is complexed with dissolved organic matter), it is easy to assume that most of the copper occurring in natural solution samples is almost always well buffered. A standardisation method able to measure free Cu2+ activities in a critical range, between pCu values of 14 and 4 would be beneficial.
This article details a method for the determination of free copper using an automated procedure. We propose a standardisation procedure for the measurement of pCu focusing on applications for fresh water and soil water. All required parameter adjustments are specified. Our aim was to eliminate or attenuate the problems arising from the variability in some of the operating procedures, such as the time for the equilibration of the calibration buffers, applicable pH range, minimum total dissolved Cu concentrations, minimum buffering and potential sources of interferences. We have also tried to take into account some of the difficulties linked to the use of the Cu-ISE, thus the method is validated empirically given that the ISE determinations of pCu can be sensitive to experimental conditions.
Materials and methods
Standard solutions
Water purified using a Milli-Q system (Millipore) (resistance 18 mΩ) was used to prepare all solutions. Stock standard Cu(ii) solutions were prepared by dilution of appropriated volumes of standard solutions (ICP-MS quality). Different solutions of EDTA (ethylenediamine tetraacetatic acid, tetrasodium salt), IDA (iminodiacetic acid), potassium acid phthalate, sodium citrate and acetic acid were prepared by appropriate dilution of analytical reagents. Stock standard HNO3 and NaOH solutions (in the range 1 to 6 M) were prepared by dilution of concentrated HNO3 (Trace Metal grade, Fisher Scientific, Ottawa, Ont., Canada) or by dissolution of appropriate amounts of NaOH (Fisher Scientific, Ottawa, Ont., Canada). Stock standard solutions of KNO3 (0.1 M) and MES (2-[N-morpholino]ethanesulfonic acid) (1M) (both from Fisher Scientific, Ottawa, Ont., Canada) were prepared by appropriate salt dissolution. KNO3 (0.1M) was used to standardise ionic strength while MES (0.1M) was used as a pH buffer given its known low affinity for copper.[14] This effect has been confirmed in the laboratory by measuring with Cu-ISE the low complexation capacity from Cu titration of a 0.1 M MES sample (results not shown here). Stock solutions were replaced monthly and kept at 4°C when not in use.
Electrodes
The pH was determined using a Fisher Model 620 pH meter and a double junction pH electrode. The pCu was determined with a detecION® Cupric 227 ISE combination electrode with a maintenance-free double junction reference (non-refillable). The ISE response from different commercially available electrodes will differ and performance would need to be confirmed when using a different electrode brand.
The electrode measurements were made, as far as possible, under constant lighting conditions. The electrode has been considered photosensitive[23] and some copper compounds are also known to undergo photodecomposition reactions[26] but we did not observe any significant photosensitivity – measurements in a beaker with and without aluminium paper did not show significant differences (data not shown).
Between samples, the electrode came back to a MQ water reservoir for rinsing, and was also wiped dry with laboratory tissues. After each day of use, the following electrode clean-up steps were used: (1) polish the CuS crystal of the cupric electrode for 30 s with 3-µm aluminium oxide strips (Al2O3), (2) soak the electrode for 5 min in 0.025 M H2SO4, and (3) soak the electrode for 30 min in 0.1 M Na4EDTA. When not in use, the electrode is stored in MQ water. These cleaning solutions were replaced weekly.
Apparatus and parameter settings
The autotitrator used was a Titralab TIM865 Titration Manager (Radiometer Analytical, Lyon, France). It was used for varying the pH of the titration solutions by small additions of dilute HNO3 or NaOH solutions.
The auto-sampler was a SAC 80 Sample Changer (Radiometer Copenhagen). The software used was TitraMaster85 (Radiometer Analytical, Lyon, France). The ‘monotonic’ mode of titration was selected. The parameters used for the acceptation were: stability <0.1 mV min–1 and the maximum time to stability was set at 45 min. The stability threshold was always reached before this empirical time limit. All the measurements were made under constant stirring and at room temperature. The temperature changes in the laboratory were considered negligible (25 ± 2°C). The solution was stirred gently at the constant software fixed value of 1 throughout the measurement (~350 rpm). A study of the relation between the effects of stirring rate has been done. The results indicate that the electrode potential reaches the minimum value (maximum pCu) at a stirring rate of 300 rpm (not shown here). From 300 rpm and up to 1100 rpm (the maximum string rate available on our instrument), the potential measured by the electrode stays constant. As demonstrated previously,[30] the lowest pCu measured is a function of the thickness of the diffusive layer at the surface of the electrode but the results suggest that the detection limit is not dependant on the hydrodynamic settings of the measurement when using stirring rates higher than 300 rpm.
Electrode calibration
The Cu electrode was calibrated on a daily basis. The average time for the calibration of the electrode was around 2 h. The ISE calibration buffer was made to 500 mL with: 1 mM of IDA, 0.1 mM of Cu(NO3)2, 6 mM of NaOH, 2.5 mM of KHC8H4O4, and 0.01 M KNO3. These stock solutions were kept at 4°C in separate containers and replaced every month.
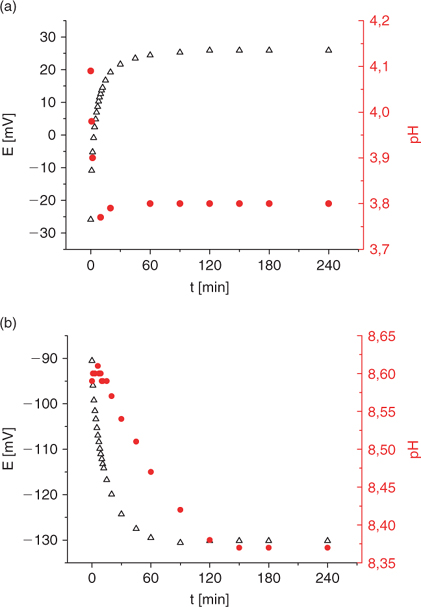
The pH was adjusted with small quantities of HNO3 (5% and 10% v/v) to 10 various levels (from around pH values of 2 to 11). These 10 solutions were prepared the previous day to allow chemical equilibration. A study of the time required for the achievement of a steady-state response showed that the time required before analysis could actually be reduced but the solutions could not be prepared right before the analysis (see Fig. 2a, b). The choice of 10 standard solutions for the calibration was arbitrary but deemed sufficient to get a representative linear regression of the daily ISE response. The stability constants used for calculating the resulting pCu in the standards are summarised in Table 1.
|
For better reproducibility and faster analysis, the measurements should be made, inasmuch as possible, in an order of increasing concentration (decreasing pCu). Some ‘memory effects’ of the Cu-ISE after it has been exposed to concentrations higher than 10−5 M are attributed to the kinetics of the processes of adsorption/desorption of Cu2+ from the electrode surface.[26] Odd samples which would be out of order would not invalidate the analysis but would increase the equilibration time between samples. After these different steps, the calibration response can be drawn, i.e. the ISE potential response v. pCu in the buffer.
The major difference between the calibration technique[15,27,28] used for seawater measurements and the method described in this paper is the ionic strength (in the range of 0.5 to 1 M for the seawater measurements). The authors prepared pCu buffers with artificial seawater (ASW), copper and two ligands (glycine and ethylenediamine). The pH was adjusted close to 8 and the range of pCu obtained was from 9.4 to 12.8. This method seems to be well adapted for seawater measurements but not to samples with low salinity and low ionic strength. Moreover, the range of pCu obtained would be too narrow for waste water or soil extract measurements.
Simulation treatment
Concentrations of free Cu(ii), Cu(ii)-complexes, metal-binding as a function of pH, ionic strength and metal/ligand ratio were calculated using the chemical equilibrium software MINEQL+.[29] The program calculates the activity of each species present in the media. Theoretical titrations of individual parameters in a well-defined range can be done and the program gives the concentration of the target species at each step according to the metal/ligand stoichiometry, the protonation constants and the stability constants. The parameters used are: temperature: T = 25°C (fixed), ionic strength: I = 0.01 M (fixed), Log PCO2 = –3.5 (open atmosphere) and 2 < pH < 12 (titration). Other chemical equilibrium software models could be used and similar calculation results could be expected in as long as the stability constants are similar.
Results and discussion
Electrode calibration
The complexation of Cu by IDA in the standard buffer solution is pH sensitive, it is therefore possible to modulate the pH using the same IDA buffer and then using the pH in the standard solution to allow the calculation of the exact free Cu activity. This correlation is obtained through computations using MINEQL+ with the stability constants provided in Table 1. The results are summarised in Table 2 and Fig. 1.
|
|
The resulting calibration equation can be derived from Fig. 1:
This empirical regression equation is used for the determination of the pCu after measuring the pH in the Cu-IDA buffer solution. Table 2 can be used for a simple conversion but the empirical regression can easily be incorporated into calculation spreadsheets. Different calibration schemes and regressions could be realised with different Cu buffers but the end result is identical.[22,24]
Equilibration of the buffer solutions
Fig. 2 reports the evolution of the potential of the ISE as a function of pH for two buffer solutions of different initial pH. The end of the preparation of the buffer standard solution corresponds to the initial time (t = 0).
|
An equilibration time of ~3–4 h was deemed enough to ensure that equilibrium conditions are attained in the calibration buffers. However, an overnight equilibration period is perhaps more practical. Fig. 2 shows that the ISE potential is stable after about one hour but the pH continues to decrease for 2–3 h. This pH decrease is most likely due to the dissolution of carbon dioxide CO2 (aq) which produces H3O+.
There is also a certain time required for the equilibration of the ions and ligands in the buffered solution. So, before doing any potential measurements with the copper ion selective electrode, a minimum of 2-h exposure to the open atmosphere is recommended for stability. The stabilisation time for the potential is therefore dependent on the equilibration time of the buffer solution and the stabilisation time of the electrode response.
Calibration results
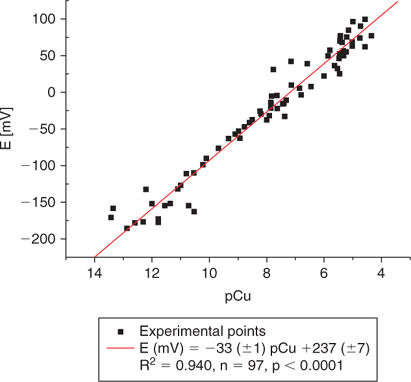
Fig. 3 represents the response of the ISE as a function of copper activity (pCu) using the IDA buffer at various pHs. The graph represents the calibration over a 6-month period and we can observe that the electrode response is stable even when different calibration curves are combined over a long period. This reproducible electrode response can be observed even at concentrations as low as 10−12 M.
|
The shelf life of the 10 IDA buffers at various pH has been studied. The buffer solutions are therefore kept at 4°C when not in use and can be used for the daily calibration of the electrode. The calibration response shows a significant shift after a week of use but remains stable when used for period shorter than a week (not shown here).
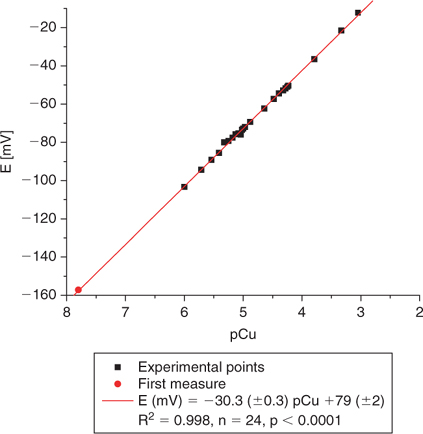
Fig. 4 illustrates a standard calibration of the Cu ISE when using a dilution series of Cu salts without the addition of any added ligands with an unbuffered pH (around 6). The lowest measurement realised in this case is indeed around 10−7–10−8 M free Cu2+. The pCu extrapolated with the first measure of potential (E = –157.2 mV) is pCu = 7.8. We do not believe that this is a limitation of the electrode but rather that it results from the contamination artefacts detailed earlier combined with the absence of buffering of free Cu2+. At this pH, free copper in solution should account for more than 97% of total solution Cu (Fig. 5).
|
|
Validation of the method
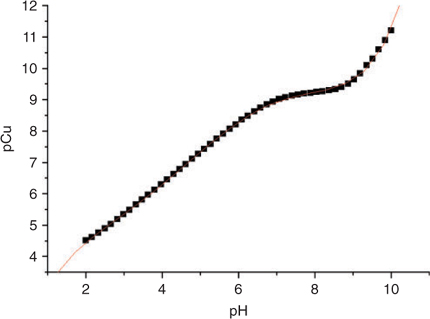
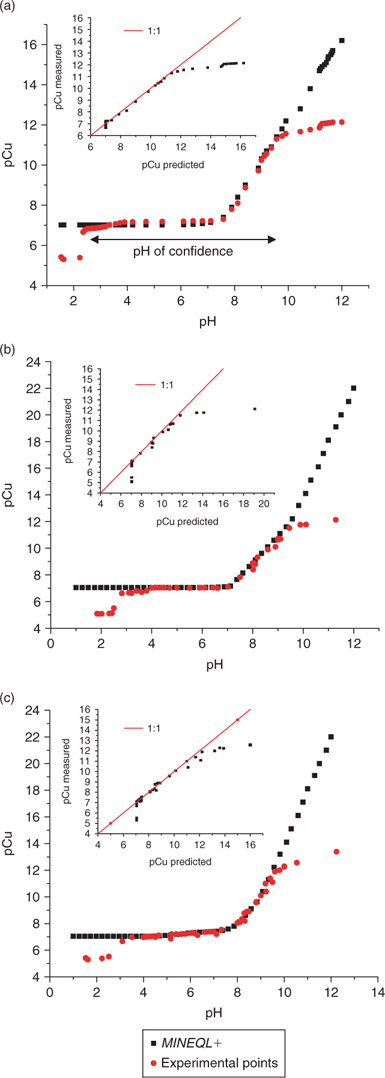
Figs 6 and 7 represent the pH-dependent variation of pCu measured and calculated using MINEQL+. Four standard solutions were used. The first solution has no organic ligand added to buffer Cu (Fig. 6a) as opposed to the other two solutions where Cu is well buffered with either acetate or citrate (Figs 6b, c) in a ligand/metal ratio of 1000. All three solutions have the same ionic strength (0.01 M with KNO3) and an initial total copper of 10−7 M (added from a stock standard solution of Cu(NO3)2). The fourth solution contained EDTA as a strong organic ligand in a ligand/metal ratio of 2 (Fig. 7). The pH was again varied using small additions of HNO3 or NaOH.
|
|
Fig. 6 shows an excellent concordance between the experimentally measured values and the values calculated using MINEQL+ in the pH range between 3 and 10.
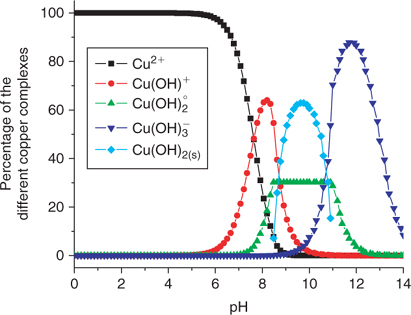
A loss of specificity was observed under acid conditions (at pH < 3) which we attribute to an interference from protons upon the selectivity of the Cu ISE.[26] The deviation from linearity under alkaline conditions (at pH > 10) is more difficult to explain. Perhaps, a loss of sensitivity of the electrode in this pH region explains this phenomenon or possibly the detection limit is reached (around 10−12 M). But given that other authors have used such electrodes down to 10−19 M,[22] it is unlikely that we have reached the detection limit at 10−12 M. An alternative explanation is that the Cu-ISE responds to some of the copper complexes present at this pH (most likely (Cu(OH)2)° and (Cu(OH)3–)). By comparing the theoretical diagram (Fig. 5) of the proportion of soluble copper complexes as a function of pH with the experimental data of pCu as a function of pH (Figs 6 and 7), it would appear that the Cu-ISE overestimates the pCu when significant concentrations of Cu(OH)3– appear in solution. On the other hand, this ISE is not known to be sensitive to this Cu species and this supposition cannot be confirmed without a specific experimental protocol.
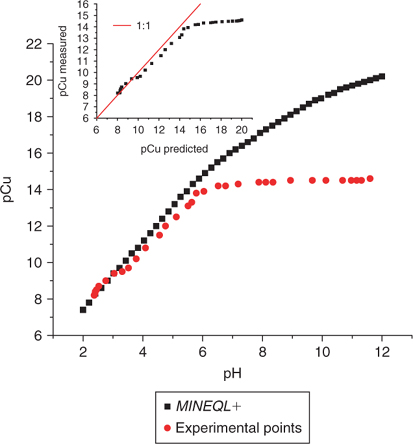
At pH 10, the precipitation-dissolution equilibrium of Cu(OH)2 (s) would maintain ~10−11 M Cu2+ which becomes an effective limit of applicability, not really the limit of detection. It may still be related to the limit of detection in this case if the precipitation of the copper hydroxide occurs on the electrode surface, effectively hindering the response of the electrode (which is based on a surface exchange reaction). It is still possible to use the ISE at lower free Cu2+ activities, but then only under pH conditions not conducive to the precipitation of Cu(OH)2 (s) (e.g. with a stronger ligand such as EDTA where low free Cu2+ activities are possible with a lower pH). It can be appreciated in Fig. 7 that given adequate pH conditions with a strong ligand like EDTA, a limit of detection of about pCu = 14 can be reached. As the presence of relatively stronger ligands was reported in the literature for freshwater[14,31] and in soil solution,[3,5,32–34] the use of the selective electrode becomes the instrument of choice for measuring free copper in this kind of matrices.
The lower detection limit in the non-buffered solution (Fig. 6a) can be explained by the combined influence of Cu2+ and Cu+ in solution.[15,26] In fact, the ISE can respond to both of these ions due to the exchange reactions at the electrode surface:

This can result from the absence of a complexing agent which could otherwise help in regulating Cu+ concentration. The observed higher response can be attributed to the dissolution of the electrode membrane releasing Cu+ in solution, which is then oxidised into Cu2+.
Fig. 6a shows that the ISE can be used to measure free Cu2+ down to 10−10 and even to 10−12 M in the absence of any organic ligand to buffer free Cu. This result contradicts the preconceived notion that the ISE is only usable at concentrations of free Cu2+ above 10−7 M in the absence of any metal buffer. In the data illustrated in Fig. 6a, total dissolved Cu is 10−7 M and free copper activity was low as a result of the formation of Cu hydroxyl species. From pH 8 to pH 10, between 60 to 98% of the total copper in solution was present as hydroxy complexes and this buffering effect is apparently enough to allow proper measurements to be made using the Cu ISE. Such low detection limits at acidic pH would not be possible without some sort of buffer given that under low pH conditions, no inorganic ligands would be able to buffer the free Cu and reduce its ion activity while maintaining enough total dissolved Cu in solution for a proper electrode response.
Fig. 8 illustrates the impact of CO2 dissolution as a function of stirring time during a Cu-ISE measurement. Total inorganic carbon (TIC) was measured in a natural water sample, under open atmosphere.
|
The period tested was extended to 3 h for this test but in a classical Cu-ISE measurement, lower than 45 min, the dissolution of CO2 can be reasonably neglected.
Moreover, a similar evaluation was made with the synthetic samples of EDTA (0.01 M) and Cu (10−3 M), under open atmosphere and with stirring but, in this case, the pH was increased from 7 to 11 with small additions of NaOH, in an attempt to reproduce the experimental conditions observed in Fig. 7. The concentration of total inorganic carbon (mainly due to carbonate species) will be dependent upon CO2 dissolution (deemed negligible – see Fig. 8). The results (not shown here) indicate an increase of the total inorganic carbon (from 43 to 49 mg C L–1) for distinct samples of increasing pH in the interval of 4 h. The trend to pH was expected but unrelated to the time of stirring and simply dependent on the fixed pH of the EDTA solutions. Theoretical calculations in MINEQL+ show that for solutions at pH of 7.1 and 11.0, resulting pCu would be 16.2 and 19.7 and remain identical when adjusted for carbonates values measured at these pH. The only remaining artefact that needs to be taken care concerns anything that would affect pH between sampling, extraction and analysis. But then, this is critical for most environmental analysis, especially chemical speciation measurements.
Precision and accuracy
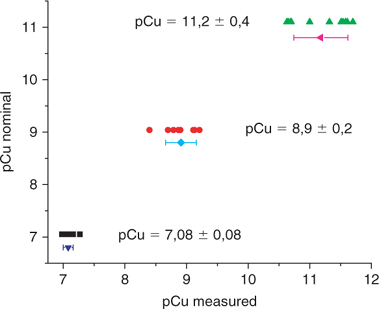
Figs 6 and 7, representing the relation between the measured pCu and the pCu predicted by MINEQL+, show some discrepancies even within the accepted range for the use of the Cu-ISE. The sources of errors can arise from the calibration regression, from the potential measurements or from the pH measurements of the IDA calibration buffers. Moreover, the pCu predicted by MINEQL+ are derived from binding constants for various ligands that contain a certain uncertainty which may introduce a bias in the pCu predictions. The precision and accuracy of the method is illustrated in Fig. 9 with a compilation of the pCu measured in identical or different solutions (at different pH) and on different days (based on different calibration curves), v. the nominal pCu (predicted by MINEQL+). The compilation was arbitrarily made for the nominal pCu of 7.05 ± 0.02; 9.04 ± 0.05 and 11.1 ± 0.1 and for each nominal pCu, the number of replicates was 11 and each value arises from distinct measurements (in terms of calibration and/or solution).
|
In terms of precision, the standard deviations of the measured values never exceed 0.1 units and in terms of accuracy, the measured values are very close to the nominal values, within a range of 0.1 from the three target values.
Determination in natural samples
A synthesis of the literature (in term of extreme range of pCu and pH) has been done for the different applications of the Cu-ISE with different natural matrices. Table 3 does not represent a complete literature review on the applications of the Cu-ISE but only the results obtained through the use of a similar ISE calibration protocol (based on IDA buffers). The results are presented in the Table 3.
|
For comparison, new laboratory measurements were done with diverse field-collected samples reflecting natural matrices of different origins (Table 4). The observed pCu were within the reported range in the literature. The range of the different parameters measured (pH, conductivity, alkalinity, dissolved organic carbon) is relatively large and is representative of the values generally obtained for natural matrices. These few experiments show the ability of the Cu-ISE to measure low free copper concentrations in various natural matrices. The fraction of the free copper v. the total copper concentration measured is between 1 to 8% (results not shown here). This value agrees well with the generally accepted range of 0.1 to 20% of free copper fraction. These results demonstrate the effectiveness of using Cu-ISE in various natural matrices.

|
Conclusion
The standardisation of an automated method was improved for the use of a copper ion selective electrode in various natural waters. The use of the autotitrator allowed good reproducibility and time efficiency. The method is easy and reproducible, and allows detection as low as 10−14 M. The measured values show good correlation with predicted values in the pH range 3–10 with either weak or stronger ligands. Out of this range, the values are overestimated. Interferences are attributed to loss of selectivity relative to protons at low pH values and pH values above 10. At these high pH values, copper hydroxide precipitation in the solution and onto the electrode surface was suspected to interfere with the measurements. The present article reveals the ease of use and potential of the copper selective electrode to measure free copper in low ionic strength and low salinity matrices with or without weak and/or strong ligands.
Acknowledgements
The authors gratefully acknowledge the support of the NSERC-MITHE research network. A complete list of sponsors is available at www.mithe-rn.org.
[1]
J. Song,
F. J. Zhao,
Y. M. Luo,
S. P. McGrath,
H. Zhang,
Environ. Pollut. 2004, 128, 307.
| Crossref | GoogleScholarGoogle Scholar |
| Crossref | GoogleScholarGoogle Scholar |
| Crossref | GoogleScholarGoogle Scholar |
| Crossref | GoogleScholarGoogle Scholar |
| Crossref | GoogleScholarGoogle Scholar |
| Crossref | GoogleScholarGoogle Scholar |
| Crossref | GoogleScholarGoogle Scholar |
| Crossref | GoogleScholarGoogle Scholar |
| Crossref | GoogleScholarGoogle Scholar |
| Crossref | GoogleScholarGoogle Scholar |
| Crossref | GoogleScholarGoogle Scholar |
| Crossref | GoogleScholarGoogle Scholar |
| Crossref | GoogleScholarGoogle Scholar |
| Crossref | GoogleScholarGoogle Scholar |
| Crossref | GoogleScholarGoogle Scholar |
| Crossref | GoogleScholarGoogle Scholar |
| Crossref | GoogleScholarGoogle Scholar |
| Crossref | GoogleScholarGoogle Scholar |
| Crossref | GoogleScholarGoogle Scholar |
| Crossref | GoogleScholarGoogle Scholar |
| Crossref | GoogleScholarGoogle Scholar |
| Crossref | GoogleScholarGoogle Scholar |
| Crossref | GoogleScholarGoogle Scholar |
| Crossref | GoogleScholarGoogle Scholar |
| Crossref | GoogleScholarGoogle Scholar |
| Crossref | GoogleScholarGoogle Scholar |
| Crossref | GoogleScholarGoogle Scholar |
| Crossref | GoogleScholarGoogle Scholar |
| Crossref | GoogleScholarGoogle Scholar |
| Crossref | GoogleScholarGoogle Scholar |
| Crossref | GoogleScholarGoogle Scholar |
| Crossref | GoogleScholarGoogle Scholar |
| Crossref | GoogleScholarGoogle Scholar |
