

Using FlFFF and aTEM to determine trace metal–nanoparticle associations in riverbed sediment
K. L. Plathe A F , F. von der Kammer B , M. Hassellöv C , J. Moore D , M. Murayama E , T. Hofmann B and M. F. HochellaA Department of Geosciences, Virginia Tech, 4044 Derring Hall, Blacksburg, VA 24061, USA.
B Department for Environmental Geosciences, University of Vienna, Althanstraße 14 UZ AII, 1090 Vienna, Austria.
C Department of Chemistry, University of Göteborg, SE-412 96, Göteborg, Sweden.
D Department of Geology, University of Montana, 32 Campus Drive # 1296, Missoula, MT 59812, USA.
E Institute for Critical Technology and Applied Science, Nanoscale Characterisation and Fabrication Laboratory, Virginia Tech, 1991 Kraft Drive, Blacksburg, VA 24061, USA.
F Corresponding author. Email: plathekl@vt.edu
Environmental Chemistry 7(1) 82-93 https://doi.org/10.1071/EN09111
Submitted: 1 September 2009 Accepted: 22 December 2009 Published: 22 February 2010
Environmental context. Determining associations between trace metals and nanoparticles in contaminated systems is important in order to make decisions regarding remediation. This study analysed contaminated sediment from the Clark Fork River Superfund Site and discovered that in the <1-μm fraction the trace metals were almost exclusively associated with nanoparticulate Fe and Ti oxides. This information is relevant because nanoparticles are often more reactive and show altered properties compared with their bulk equivalents, therefore affecting metal toxicity and bioavailability.
Abstract. Analytical transmission electron microscopy (aTEM) and flow field flow fractionation (FlFFF) coupled to multi-angle laser light scattering (MALLS) and high-resolution inductively coupled plasma mass spectroscopy (HR-ICPMS) were utilised to elucidate relationships between trace metals and nanoparticles in contaminated sediment. Samples were obtained from the Clark Fork River (Montana, USA), where a large-scale dam removal project has released reservoir sediment contaminated with toxic trace metals (namely Pb, Zn, Cu and As) which had accumulated from a century of mining activities upstream. An aqueous extraction method was used to recover nanoparticles from the sediment for examination; FlFFF results indicate that the toxic metals are held in the nano-size fraction of the sediment and their peak shapes and size distributions correlate best with those for Fe and Ti. TEM data confirms this on a single nanoparticle scale; the toxic metals were found almost exclusively associated with nano-size oxide minerals, most commonly brookite, goethite and lepidocrocite.
Additional keywords: contaminated sediments, electron microscopy, field flow fractionation, ICPMS.
Introduction
Trace metal contamination of water and sediment due to mining activities is a major problem throughout many areas of the world.[1–4] These metals can exist and be transported in various ways, such as dissolved species in solution, sorbed on or incorporated into inorganic particulates, and complexed by organic matter. Since these different species and size fractions will be affected by different transport processes (e.g. diffusion, aggregation and sedimentation) and because they have different availability to biota and to remediation technologies, an understanding of these relationships is critical. Colloids, defined as solid material less than 1 μm in size, have been given much attention recently as a major player in trace metal transport.[5–10] Because of the small size of colloids, they are more readily transported longer distances than larger materials but may quickly aggregate to larger units and are less easily re-suspended than larger particles (e.g. Hjulstrøm curve),[11] hence transport and distribution processes are multifactorial and complex. A subset of colloidal material, nanoparticles (at least one dimension less than a few tens of nanometres) have been shown to display properties differing from those of bulk material of the same phase.[12–15] These property changes include such things as increased capacity to sorb metals or an altered redox potential. While some of the property changes are directly related to the increase of specific surface area, some are emerging from changes in the surface properties and chemistry of these surfaces at or below certain particle sizes.[16–21] In other words, surface and particle properties, even when normalised for surface area, often show changes in the nanoscale size range. Characteristics like these are key in understanding metal behaviour in the environment as they alter characteristics of the metal, such as bioavailability and toxicity.[22] In order to know how metals and nanoparticles are associated in these types of environments, one needs to be able to evaluate the chemistry of the particles as a function of their size.
The sediment samples for this study were collected from the Clark Fork River in western Montana, USA. This is an important area as far as metal contamination is concerned as it is the largest Superfund Site in the country. Base metal mining over the past 150 years has released considerable quantities of metals at toxic concentrations (namely Pb, Zn, Cu and As) into the river and floodplain environments. Approximately 100 years ago the Milltown Dam was built ~200 km downstream from the mining and smelting source areas in Butte and Anaconda, Montana. A large amount of these trace metals has since travelled downstream and accumulated in the sediments of the reservoir behind the dam. It has been estimated that many thousands of metric tons of the aforementioned metals were held behind the dam.[23] There is currently a large-scale project in progress removing the dam and reconstructing the channel. A higher than predicted level of riverbed scouring during this process has released more sediment[24] and more contamination than was anticipated. Immediately after dam removal, fine-grained riverbed sediment up to 70 km downstream from the dam removal site showed a 5-fold increase in As and a 3–4-fold increase in Cu, Zn and Pb when compared with previous concentrations[25–27] (Fig. 1).
|
In order to make rational decisions concerning remediation, it is important to understand metal behaviour and transport in the environments. As nanoparticles are ubiquitous in nature and have already been found associated with metals in this particular system[2,28,29] and other mine drainage locales,[1,30] it is likely that they are affecting trace metal mobility and bioavailability. The goal of this study was to determine associations existing between nanoparticles and trace metals in order to better elucidate these complex relationships. Asymmetrical flow field-flow fractionation (aFlFFF) combined with multi-angle laser light scattering (MALLS), high resolution-inductively coupled plasma mass spectroscopy (HR-ICPMS) and analytical transmission electron microscopy (aTEM) were utilised in pursuit of this goal.
As the theory behind FFF has been described elsewhere,[31–33] it will not be explained in detail here. However, briefly, FFF is a continuous analytical particle separation technique which, in combination with suitable detection systems, can be utilised to determine properties of the sample as a function of the particle size. The particle separation takes places in a thin (~0.25 mm) channel under the effect of a field applied perpendicular to the main parabolic flow of a mobile phase. Flow-FFF (FlFFF), one of the many subtypes of FFF, relies on the varying diffusion coefficients of the different particle sizes to continuously size separate a sample. Using either FFF theory or calibration with particle size standards, the retention volume of the particles can then be converted to hydrodynamic diameters. FFF was chosen as it is currently one of the least invasive ways to acquire quantitative information on the continuous size distribution of particles in a sample. By utilising light scattering and ultraviolet diode array detection (UV-DAD) spectrometers, information about the mass concentration (approximated from determined turbidity),[34] size and shape of the particles can be accomplished. Also, by employing mass spectroscopy coupled to FFF, chemical data can be acquired, thereby giving much useful information about the size distribution v. chemistry of particles. When the material is also examined using transmission electron microscopy and electron diffraction, coupled to energy dispersive X-ray spectroscopy (EDS), it becomes possible to identify which particular mineral phases and particle sizes are hosting metals of interest. This combination of FlFFF and aTEM, therefore, gives a comprehensive picture of trace metal–nanoparticle associations. While various studies have utilised FFF coupled to light scattering,[34–45] ICPMS,[7,46–52] TEM[33,53–55] or some combination thereof, many of these studies focussed on organic matter, synthetic nanoparticles, or uncontaminated river water. This study uses the above mentioned techniques to provide a first look at the direct associations between mineral nanoparticles and toxic trace metals in contaminated sediment.
Experimental
Site and sample description
Samples for this study were collected at three sites in September 2008 from a channel of the Clark Fork River at 2.3, 15 and 20 km downstream from the Milltown Dam removal site (Fig. 2). All sediment samples were collected with plastic scoops and placed into bottles that had been purged with river water. All sample collection materials were previously acid-cleaned, rinsed with ultra pure de-ionised water and placed in plastic bags until sampling in the field. The samples were stored on ice until return to the University of Montana Geology Analytical Laboratory. Once there, they were air-dried and then stored in plastic bags for shipment. Data analysis revealed that all samples exhibited similar chemical trends as they were likely all deposited during the same transport event after dam removal. Therefore, only data from location 1 will be presented here, and it will hereafter be referred to as CF-1.
|
Sample preparation and aFlFFF-MALLS setup
All chemicals were purchased from Fisher Scientific, Austria, at analytical grade or better. A colloidal extraction method was used to prepare aqueous samples from the sediment for aFlFFF analysis.[56] The sediments were gently disaggregated using mortar and pestle and dry-sieved to <125 μm. A portion of the sieved sediment was digested using hydrofluoric acid for trace metal analysis with ICPMS. To increase the sodium adsorption ratio and remove divalent cations (e.g. sorbed Ca2+) which would interfere with later colloid dispersion, a 1 : 10 solid–liquid mixture of sediment and 0.1M NaCl solution was prepared, sonicated in a bath (2 × 120 W ultrasonic power; Bandelin Sonorex Super RK106) and placed on a shaker for 24 h. The mixtures were then centrifuged to give a 100-nm particle size cut-off for particles with a density of 2.6 g cm–3 using the following equation[56]:
This equation assumes spherical particles and an increasing centrifugal force with the radius. It calculates the time, ts, necessary for a particle with diameter d to travel from the surface of the sample (rin, distance from rotor axis to sample surface) to the bottom of the tube (rout, distance from motor axis to tube bottom) under given revolutions per minute (rpm), density difference between particles and medium (Δρ), and viscosity of the medium (η). Since the particles were expected to be fully aggregated under 0.1 M NaCl the chosen cut-off of 100 nm was a suitable compromise between safe removal of all particles from the supernatant, centrifugation time and g-force related compaction of the sediment at the bottom of the tubes. Absence of particles in the supernatant was inspected visually by using a standard red laser pointer (clear supernatant, no scattered light visible to the naked eye at ~30° scattering angle). After centrifugation the supernatant was collected and the tubes refilled with Milli-Q water (Millipore Advantage A10 system equipped with a Bio-PakTM 5kDa ultrafilter, Millipore, Billerica, USA), again sonicated and placed on a shaker for 4 h, then centrifuged again (as above). This washing step was repeated until the supernatant returned from centrifugation turbid. At this point, the extraction continued with a centrifugation particle size cut-off of 500 nm (determined using Eqn 1) and the supernatant was collected after each step for final analysis (~500-mL final extract volumes). Preliminary aFlFFF data showed clearly visible steric effects, which are produced when the upper particle size for the samples is too large. These effects were recognisable by a pronounced shoulder on the high diameter side of the sample peak, but more so from a sudden sharp rise of the MALLS determined particle size. Therefore, all samples were centrifuged to a 200-nm cut-off and these final extracts were used for all further experiments. Aliquots of these extracts were also analysed using ICPMS in order to compare trace metal concentrations to those of the sieved bulk sediment. Total particle mass in the extracts was measured by filtering a portion of the extract over a 20-nm filter and weighing the filter after drying it.
The aFlFFF system used was a PostNova2000 Focus coupled to a UV-DAD detector (Shimadzu SPD-M20A), and an 18-angle static light scattering detector (Dawn EOS, Wyatt Technology, Santa Barbara, USA). The channel was equipped with a 10 kDa nominal cut-off polyether sulfone membrane (Pall Filtration, Omega) and the system was made virtually metal free by acid-cleaning procedures and the replacement of all metal parts with plastic. aFlFFF parameters and run specifications are detailed in Table 1. Due to the findings in Dubascoux et al.[36] we did not apply sodium dodecyl sulfate (SDS) as a carrier component since it seems to have minor or no effect on the stabilisation of clay-containing soil extracts. Instead we chose a low concentration of sodiumdiphosphate (0.5 mM Na4P2O7, giving a Na+ molarity of 2 mM). Recoveries are given and discussed later. Sodiumdiphosphate was chosen after several uncalibrated check runs with MALLS detection, which showed smaller peak areas and non-ideal peak shapes with borate buffer, SDS and (NH4)2CO3 at different concentrations and pH. For example, with borate and SDS as carriers a smaller recovery was observed, especially with the larger particles, and with ammonium carbonate sharp and fragmented peaks were obtained which gave no useable MALLS signal. These peak shapes were interpreted as membrane adsorption of the particles and as aggregation and steric elution of large particles respectively. However, the results with the other carrier components were not fully quantified and are not reported here. We did not utilise sodium azide during runs since the strong UV-absorption of NaN3 renders the use of detection wavelengths below 280 nm inappropriate for the only light scattering mineral nanoparticles due to strong background absorption. Also, the addition of another ~3 mM Na+ would have reduced the recovery significantly.[36] Instead, the system was flushed overnight with NaN3 solutions (200 ppm). Particle size calibration was accomplished using seven NIST traceable polystyrene sulfonate size standards between 40 and 600-nm hydrodynamic diameter (NanospheresTM, Duke Scientific Corp., Palo Alto, CA, USA) run under the same conditions as the samples. Independent determination of standard sizes was done by analysing the MALLS peak maximum data with a spherical particle model and deviations from manufacturer stated sizes were negligible (typically less than 5%).
|
Asymmetric flow-FFF-HR-ICPMS setup
The aFlFFF system used for the element distributions was the same as described in the previous section. Injection volume, carrier solution, separation parameters and size calibration standards were also identical in order to obtain comparable size distributions. Before entering the HR-ICPMS (ThermoFinnigan ELEMENT 2, Waltham, MA, USA), the effluent from the aFlFFF passed through an interface where HNO3 and Indium were mixed in on-line to make final concentrations of 1% HNO3 and 1 ppb In. After every sample run, a blank (Milli-Q water) and a standards solution (20 ppb of all elements of interest, made up in FFF carrier solution) were injected into the aFlFFF-ICPMS interface and measured. These standards were then used for concentration calibration of the samples. Elements measured included Al, Fe, Si, Mg, Ti, Zn, Cu, Mn, Ba, Pb, Sr, Cr, Ce, La, Co, Th, Bi, Pr and In.
Analytical electron microscopy
The samples (same extracts used for aFlFFF) were prepared for TEM analysis using the following procedure: 1 mL of each sample was mixed with 100 μL of a Nanoplast resin mixture (1.0 g melamine resin + 0.025 g catalyst). This resin is used in order to prevent artefacts from forming during evaporation of the sample. For each mixture, 5 μL was pipetted onto a carbon-coated 300 mesh Ni TEM grid which was lightly adhered to a small horizontal centrifuge. The centrifuge spins fast enough to produce a very thin veneer of resinated sample. The grids were then placed in an oven at 40°C for 48 h and at 60°C for 48 h in order to cure the resin.
The TEM used in this study was an FEI Titan 300, which has a field emission gun and was operated at 200 kV. The microscope is equipped with an energy dispersive X-ray spectrometer (EDS), which allows for semiquantitative analysis of all elements greater than atomic number 4. Cu and Ni cannot be quantified here as the grids are Ni and certain interior parts of the microscope contain Cu which produces a spurious peak in each spectrum due to splay X-rays or electrons. High resolution images (typically at a magnification of 570 000) were taken of each particle and converted using a Fast Fourier Transform (FFT) function. These converted patterns were then used to determine mineral phases of the particles. Chemical spectra were also obtained for ~50 particles per sample.
Results and discussion
Asymmetric flow-FFF-MALLS
FFF provides only the separation of the particles in the channel, and this process may experience several critical interferences due to non-ideal behaviour, including strong aggregation, steric inversion effects with larger particles, overloading effects and membrane repulsion interferences.[32,41,57] It is necessary to check the suitability of the sample, the selected carrier composition, and the run conditions against independent methods to assure proper fractionation. It is possible to detect possible interferences with an on-line MALLS detector, an on-line or off-line dynamic light scattering (DLS) system or a combination of spectral turbidity and nephelometric turbidity data.[34] Checking sample recoveries on different detection systems is necessary to assess the membrane penetration loss and particle-membrane adhesion, which tend to cause losses of especially the very small and very large particles respectively.
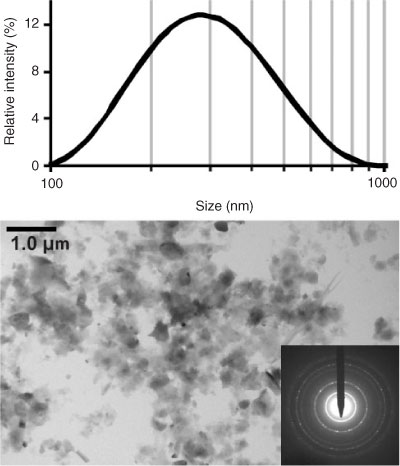
Considering results from batch DLS measurements in the <200-nm cut-off extracts (Fig. 3, top) it was decided to set the run conditions to separate particles from 20 to 400 nm, which is a 20-fold stretch and at the expected maximum for FFF.[32] Fig. 4 shows the signal trace of CF-1 as a function of the elution volume and calibrated hydrodynamic diameter (dh) together with the applied set of monodisperse particle size standards. The signal trace is from the 90° angle signal of the MALLS detector. Shown together with CF-1 is the trace of an in-house reference of natural soil nanoparticles, extracted in a similar method.[41,56] This reference sample is a derivative of sample S3 from von der Kammer et al.[41] and has been colloidally stable for over 5 years. A subsample of this (named REF6) was also utilised in Dubascoux et al.[36] It is routinely used as a benchmark for FFF analysis, and the size distribution of the parent sample, S3, measured on a symmetric FlFFF in 2004, is nearly identical to the results obtained here. The results here also match well with those in Dubascoux et al.[36] considering the different run conditions and Na+ concentrations.
|
|
The recoveries obtained are 75, 70 and 57% for CF-1 in the MALLS 90° angle, 25° angle and UV-VIS at λ = 220 nm respectively. For the soil reference the values are 86, 82 and 56%. This shows the selective loss of larger particles (the MALLS 25° angle is much more sensitive to large particles compared with the 90° angle) and the loss of light absorbing organic substances through the 10 kDa membrane. This is reflected more in the UV-VIS recoveries since small amounts of light absorbing organic substances will dominate the signal over the only weakly scattering mineral particles.[34] When comparing the results from the size calibration and CF-1, it can be seen that for sample CF-1 the 20 nm region is separate from the void region, which is the minimum of the signal trace between the void peak (produced from sample material which is too large, not properly focussed or relaxed and therefore elutes directly after the transition from focusing to elution time) and the sample peak, meaning that 20 nm is an acceptable lower size limit for particle analysis. Also, while the spherical 400 nm diameter standard is still in the linear range of the size calibration function, the 600 nm diameter standard clearly experiences effects of steric inversion, leading to pre-elution. However, the sample covers the whole usable size fractionation region under the given conditions. It must be clearly stated that the limit for steric inversion determined with spherical standards is not directly transferable to non-spherical particles. This is the case because a platelet with the same hydrodynamic diameter as a 400 nm spherical particle will have a much larger plate diameter and hence cause steric inversion comparable to a spherical particle with a diameter approximately equal to the plate diameter. Additionally, lift forces and entropic effects may be encountered with large, high aspect ratio platelets, shifting the steric inversion limit to even smaller hydrodynamic sizes.[57] While the soil reference sample (which also contains high aspect ratio platelet-shaped clay particles) does not show indication of steric inversion, the CF-1 curve has a shoulder on the high diameter side of the peak, which can be due to the presence of a higher amount of large particles or to a very minor steric inversion effect if very high aspect ratio particles are present. However, due to the heterogeneous nature of the natural sample, there is no straightforward solution to prove a possible interference other than to take into account the TEM analysis of the sample and the data from the independent size analysis by MALLS. The TEM image in Fig. 3 clearly shows that particles with a diameter >500 nm are virtually absent (the large particles are mainly thin platelets with plate diameters up to 500 nm).
Following the concepts in von der Kammer et al.[41] values of the radii of gyration (rg) were determined using the MALLS detector and are shown in Fig. 5. This technique revealed information about the size and grade of non-spherical shape of the particles within the aqueous extracts. When using polystyrene standards it is possible to obtain a calibration curve to convert eluted volume into hydrodynamic radius (rh) of the particles. MALLS also gives information about rg by measuring the net intensity of scattered light through a range of angles. The rg is given by the mass distribution within the particle and the single mass increments are weighted by the square of the radius distance from the centre of mass. So, particles with the same rh could have different rg values, when they have, for example, a non-spherical shape, hence a different mass distribution within the particle. Information about the shape of the particles, or in a first instance, the deviation from an ideal homogeneous sphere, can then be obtained by taking the ratio of these two values (rg/rh).[40,41] Homogeneous spherical particles would have a value of 0.775 and values above this indicate an increasingly higher aspect ratio or a non-homogeneous distribution of mass (e.g. hollow spheres). Theoretical calculations have been made for this ratio for various particle shapes (e.g. rods, hollow spheres, ellipsoids of rotation, plates) and the ratio increases more rapidly with aspect ratio for rods than for plates and also more rapidly for plates than for oblates. Fig. 5 shows the evolution of the rg with the retention volume (hydrodynamic diameter) for both samples. The calculation of rg is based on a linear Zimm fit of the obtained Rayleigh ratios.[41] The soil reference gives the expected linear increase of rg with slight void peak interferences in the small size region. Both rg curves meet in the main peak region, showing that the fractionation here is ideal and average particle shapes seem to be similar. The slightly larger rg determined for CF-1 here can be attributed to the high content of clays, as shown in the TEM image (Fig. 3). From ~200 nm in rh, both rg curves develop significantly differently. This can be attributed to the high clay content with high particle aspect ratios. Additionally in the high rg range of CF-1, it can be assumed that the MALLS rg determination based on a linear Zimm fitting is beyond the limits of applicability.
|
The FFF-MALLS analysis shows that the samples are correctly fractionated in the main peak region, that CF-1 contains a great amount of high aspect ratio particles and that a minor steric effect may be present with these high aspect ratio particles, which was not anticipated from the spherical particle calibration curve. The results from this analysis should be taken into account when interpreting FFF-ICPMS data and when evaluating the chosen sediment extraction technique. Because the assumption of spherical particles and uniform density used during calculation of the centrifugation times (Eqn 1) does not hold true for natural samples, some particles, like lighter weight, higher aspect ratio clays (as compared with denser Fe oxides), are being selectively enriched when the supernatant is collected because they settle more slowly than spherical particles of the same volume. Thus, while retaining clay particles with low density in the collected supernatant, smaller, denser and nearly spherical oxide particles may be lost. TEM images of large aggregates in the extract show that, although nano-sized particles were present, many of the particles were larger than the supposed 200 nm cut-off (Fig. 3) in terms of plate diameter (not hydrodynamic or equivalent volumetric diameter). Analysis of the diffraction pattern also indicated that the major mineral phases present were clays, such as mica-montmorillinite, illite, pyrophillite and muscovite.
Asymmetric flow-FFF-HR-ICPMS
The total amounts of selected trace and main metals in the aqueous colloid extracts and the bulk sieved sediment can be found in Table 2. By looking at the colloidal enrichment factor which in this paper describes the relative increase of metal concentrations in the <200-nm fraction compared with the <125-μm fraction, it can be seen that the metals (with the exception of Ti) are enriched in the colloidal fraction as compared with the bulk sieved sediment. This indicates that a higher percentage of metals are held in or on particles in the extract than particles in the bulk sediment. Interestingly, the enrichment is relatively low for the usually strongly particulate and iron-oxide bound Pb while the iron-oxide bound As shows the highest enrichment even after numerous aqueous extraction steps with high liquid to solid ratios. Iron is more strongly enriched than aluminium although the results from FFF runs suggested a relative enrichment of clay minerals over heavier oxides.
|
Analysis of these extracts with aFlFFF-HR-ICPMS gave information about the compositional chemistry as a function of particle size (Fig. 6). Elements that represent the clay fraction in the extracts (e.g. Al and Si) had a peak maximum >100 nm. The Fe peak has a maximum below 100 nm; so while this peak would have some contribution from the clay fraction, it also indicates that the majority of Fe is held in one or more truly nano-sized (<100 nm in diameter) mineral phases. Ti has a peak maximum in between Al and Fe, which means it is present in clays and also in some smaller mineral phases. The trace metals of interest that were measured (Zn, Cu, Pb) all have peaks that match very well with Fe and fairly well with Ti. This shows that these metals are likely held in or on nano-sized minerals, which contain Fe and Ti as major elements. If Al is taken as a representative element for the clay fraction of the sediment and selected other elements are normalised to the Al data, it can be seen that Fe, Zn, Cu and Pb are all enriched in the <100 nm range compared with Al and that Ti shows a constantly increasing trend towards smaller particles, which is, however, less expressed than the others (Fig. 7). This means that the majority of the <200-nm Fe- and Ti-dominated minerals are truly nanoparticulate and are also the ones which are more likely to be associated with the toxic trace metals, which are also enriched in the nano-size range. It is likely that Ti is bound to clays as well. Interestingly, the Ti data suggests that there is an ionic form of Ti bound to the clay minerals which dominate the large size region, while it is also present in small Ti-bearing minerals (as the TEM results confirm; discussed below). Taking into account the enrichment ratios for the CF-1 sample, Ti is less prominent in the <200-nm fraction compared with the whole sample. The less pronounced slope towards smaller particles suggests that there is a dominant Ti fraction which is not captured by the extraction procedure. Hence Ti-rich particles are >>200 nm or selectively excluded from the extract by higher density. TEM results, described below, further clarify the role of this behaviour for the observed low enrichment factors for Pb. Similar results for the Fe to Al ratio were also reported by Ranville et al.[58] in a soil colloid study which utilised sedimentation FFF and ICPMS. Using a sedimentation-FFF system on soil colloids of different origin, Ranville et al. found that the ratio also decreases with increasing particle size and noted that Fe is enriched in the smaller particle sizes. However, in that study they attributed the high Fe concentration in the fine fractions to a significant portion of the Fe being present as oxyhydroxide surface coatings. This study found no evidence for that; however, many Fe oxide nanoparticles were found using TEM (discussed below) and for this study it is likely that the presence of phases such as goethite and lepidocrocite are the main reason why Fe is so enriched in the small size fraction. Most of the clays and other silicates will be larger in size and are not expected to be found associated with the trace metals, due to less reactive surfaces compared with metal oxides. So, in these samples aFlFFF analysis revealed that the trace metals of interest are likely associated with nano-sized Fe and Ti dominated minerals and to a much lesser extent with clays and other silicate minerals.

|
|
Analytical TEM results
FFF enables the analysis of a relatively large number of particles with the drawback of reporting only averages over several thousands to millions of particles in each slice measured by the detectors in the outflow of the channel. In contrast, TEM may have difficulties in describing a sample on a fully quantitative basis after looking at 10 to 100 particles (instead of orders of magnitude more), but it offers the possibility to overcome averaging effects simply by its inherent special resolution. In addition to morphological information, elemental composition and the distribution of elements in the particle may be obtained. The data gathered from aTEM confirmed the results obtained using aFlFFF on a single particle level. The particles which contained the toxic trace metals of interest were almost exclusively oxides, most commonly goethite, lepidocrocite and brookite (Fig. 8). In acid mine drainage systems the most commonly found Fe oxides are ferrihydrite, jarosite, goethite and lepidocrocite,[2] so the presence of these mineral phases in these samples is not unusual. Also, the presence of Ti oxides has been previously reported in this particular river system, although the mineral phase itself could not be determined in that study.[13] It was more common for the Fe oxides to host Zn and As, while brookite was a more frequent host for Pb. These particles were also almost exclusively nanoparticles. In many cases, these particles were found as a group comprising aggregates that were also nanosized (Fig. 8b,c). Previous TEM studies on river sediment from the Clark Fork also found nanoparticulate Fe oxides, in the form of ferrihydrite, which contained either Zn or Zn and As.[2,29] The favoured association of Pb with brookite in CF-1 and the low enrichment ratio for Ti (see Table 2) may explain the low enrichment of Pb in the extracts compared with systems where Pb is more associated with Fe/Mn oxides. Another interesting find was that in every sample there was one or two trace metal bearing particles which were also enriched with various rare earth elements. For example, in CF-1, a Ce-allanite nanoparticle was found that contained Pb, Zn, La and Th (Fig. 9). Trace metals were almost never found associated with clays or other silicate minerals.

|

|
Conclusions
This study of sediment samples taken from a toxic metal contaminated river channel has shown that there are extensive associations between these metals and nanoparticles. aFlFFF-HR-ICPMS revealed that the trace metals measured (Pb, Zn and Cu) are held on or in nano-size particles rich in Fe and Ti while Al-rich minerals, such as clays, are much more depleted in the true nano-size range and play a far less important role in metal binding. aTEM confirmed this and showed that the main Fe and Ti minerals associated with the trace metals are goethite, lepidocrocite and brookite. For all samples it was more common for the Fe oxides to be associated with As and Zn, while Pb was more often found with Ti oxides. In several cases, nano-aggregates, composed of the same mineral phase, were found as hosts for trace metals. Nanoparticles containing rare earth elements and trace metals were also found. Overall in this system, the main particles of interest are typically various types of Fe and Ti oxides, which are lower aspect ratio, high-density minerals. Because the aqueous extraction method used to separate nanoparticles from the larger sediment particles relied on centrifugational removal of oversized material, the clay fraction of the sediment is being actively selected for in the extraction and the particles of interest here are being depleted. Methods are currently being developed to remove the clay fraction during the extraction process and enrich the heavier oxide fraction. Then perhaps more information can be gathered about the specific associations between these trace metals and the nano-oxides. This type of information is essential because of the increased reactivity of nanoparticles in the environment. These altered properties, which can include things like redox potential and absorption capacity, will affect the bioavailability and toxicity of metals in the environment. Nanoparticles, even when aggregated into small clusters, will also stay suspended in the water column of a river or pore water of sediment if sufficiently stabilised by, for example, natural organic matter. Because these nanoparticles are hosting trace metals of interest, there is the potential for increased metal transport, especially when the trace metals are incorporated into the nanoparticle and excluded from exchange reactions with the surrounding medium. This type of information has implications for not only this particular dam removal project and others like it, but any type of contaminated sediment relocation project or metal contaminated area.
Acknowledgements
Grants from the US Department of Energy (DE-FG02–06ER15786) and the Institute for Critical Technology and Applied Sciences at Virginia Tech provided major financial support for this project. We are also appreciative of the support from the National Science Foundation (NSF) and the Environmental Protection Agency through the Center for Environmental Implications of NanoTechnology (CEINT) funded under NSF Cooperative Agreement EF-0830093. Special thanks go to Dr Heiko Langer at the University of Montana Geology Analytical Laboratory for measurement of the post-dam breach samples displayed in Fig. 1.
[1]
K. L. Haus ,
R. L. Hooper ,
L. A. Strumness ,
J. B. Mahoney ,
Analysis of arsenic speciation in mine contaminated lacustrine sediment using selective sequential extraction, HR-ICPMS and TEM.
Appl. Geochem. 2008
, 23, 692.
| Crossref | GoogleScholarGoogle Scholar |
CAS |
[Verified 6 January 2010]
[50]
[51]
D. Amarasiriwardena ,
A. Siripinyanond ,
R. M. Barnes ,
Trace elemental distribution in soil and compost-derived humic acid molecular fractions and colloidal organic matter in municipal wastewater by flow field-flow fractionation-inductively coupled plasma mass spectrometry (flow FFF-ICP-MS).
J. Anal. At. Spectrom. 2001
, 16, 978.
| Crossref | GoogleScholarGoogle Scholar |
CAS |

[52]
M. Hassellöv ,
B. Lyven ,
C. Haraldsson ,
W. Sirinawin ,
Determination of continuous size and trace element distribution of colloidal material in natural water by on-line coupling of flow field-flow fractionation with ICPMS.
Anal. Chem. 1999
, 71, 3497.
| Crossref | GoogleScholarGoogle Scholar |
[53]
M. Baalousha ,
F. von der Kammer ,
M. Motelica-Heino ,
M. Baborowski ,
C. Hofmeister ,
P. Le Coustumer ,
Size-based speciation of natural colloidal particles by flow field flow fractionation, inductively coupled plasma-mass spectroscopy, and transmission electron microscopy/X-ray energy dispersive spectroscopy: colloids–trace element interaction.
Environ. Sci. Technol. 2006
, 40, 2156.
| Crossref | GoogleScholarGoogle Scholar |
CAS |
PubMed |
[54]
M. Baalousha ,
F. von der Kammer ,
M. Motelica-Heino ,
P. Le Coustumer ,
Natural sample fractionation by FlFFF-MALLS-TEM: sample stabilization, preparation, pre-concentration and fractionation.
J. Chromatogr. A 2005
, 1093, 156.
| Crossref | GoogleScholarGoogle Scholar |
CAS |
PubMed |
[55]
M. Baalousha ,
F. von der Kammer ,
M. Motelica-Heino ,
P. Le Coustumer ,
3D characterization of natural colloids by FIFFF-MALLS-TEM.
Anal. Bioanal. Chem. 2005
, 383, 549.
| Crossref | GoogleScholarGoogle Scholar |
CAS |
PubMed |
[56]
[57]
R. Beckett ,
Y. Jiang ,
G. Liu ,
M. H. Moon ,
J. C. Giddings ,
Separation and behaviour of nonspherical particles in sedimentation/steric field flow fractionation.
Particul. Sci. Technol. 1994
, 12, 89.
| Crossref | GoogleScholarGoogle Scholar |
CAS |
[58]
J. F. Ranville ,
D. J. Chittleborough ,
R. Beckett ,
Particle-size and element distributions of soil colloids: implications for colloid transport.
Soil Sci. Soc. Am. J. 2005
, 69, 1173.
|
CAS |