

Polyfluoroalkyl compounds in the Canadian Arctic atmosphere
Lutz Ahrens A C , Mahiba Shoeib A C , Sabino Del Vento B , Garry Codling B and Crispin Halsall BA Science and Technology Branch, Environment Canada, 4905 Dufferin Street, Toronto, ON, M3H 5T4, Canada.
B Lancaster Environment Centre, Lancaster University, Lancaster, LA1 4YQ, UK.
C Corresponding author. Email: lutz.ahrens@ec.gc.ca; mahiba.shoeib@ec.gc.ca
Environmental Chemistry 8(4) 399-406 https://doi.org/10.1071/EN10131
Submitted: 1 December 2010 Accepted: 1 July 2011 Published: 19 August 2011
Journal Compilation © CSIRO Publishing 2011 Open Access CC BY-NC-ND
Environmental context. Perfluoroalkyl compounds are of rising environmental concern because of their ubiquitous distribution in remote regions like the Arctic. The present study quantifies these contaminants in the gas and particle phases of the Canadian Arctic atmosphere. The results demonstrate the important role played by gas–particle partitioning in the transport and fate of perfluoroalkyl compounds in the atmosphere.
Abstract. Polyfluoroalkyl compounds (PFCs) were determined in high-volume air samples during a ship cruise onboard the Canadian Coast Guard Ship Amundsen crossing the Labrador Sea, Hudson Bay and the Beaufort Sea of the Canadian Arctic. Five PFC classes (i.e. perfluoroalkyl carboxylates (PFCAs), polyfluoroalkyl sulfonates (PFSAs), fluorotelomer alcohols (FTOHs), fluorinated sulfonamides (FOSAs), and sulfonamidoethanols (FOSEs)) were analysed separately in the gas phase collected on PUF/XAD-2 sandwiches and in the particle phase on glass-fibre filters (GFFs). The method performance of sampling, extraction and instrumental analysis were compared between two research groups. The FTOHs were the dominant PFCs in the gas phase (20–138 pg m–3), followed by the FOSEs (0.4–23 pg m–3) and FOSAs (0.5–4.7 pg m–3). The PFCAs could only be quantified in the particle phase with low levels (<0.04–0.18 pg m–3). In the particle phase, the dominant PFC class was the FOSEs (0.3–8.6 pg m–3). The particle-associated fraction followed the general trend of: FOSEs (~25 %) > FOSAs (~9 %) > FTOHs (~1 %). Significant positive correlation between ∑FOSA concentrations in the gas phase and ambient air temperature indicate that cold Arctic surfaces, such as the sea-ice snowpack and surface seawater could be influencing FOSAs in the atmosphere.
Introduction
In recent years, the fate and transport of polyfluoroalkyl compounds (PFCs) in the atmosphere has been recognised as one of the emerging issues in environmental chemistry. Longer chain PFCs are man-made chemicals and have been produced for over 50 years.[1] Because of their unique chemical and physical properties, they are widely used as processing additives during fluoropolymer production and as surfactants in consumer applications, including stain repellents in textile, furniture and paper products.[2] Perfluorooctane sulfonate (PFOS) and longer chain perfluoroalkyl carboxylates (PFCAs) are resistant against typical environmental degradation processes and have been found in humans and wildlife in remote regions such as the Arctic.[3,4]
Three main hypotheses were proposed for the global transport of PFCs. First, PFCAs and polyfluoroalkyl sulfonates (PFSAs) can be transported directly in their ionic form by ocean currents.[5,6] For instance, model scenarios estimated that the majority of perfluorooctanoate (PFOA) is transported by the ocean current to the Arctic (8–23 t year–1).[7] Second, PFCAs and PFSAs can be transported directly in the gas phase or by an aerosol-mediated pathway in the atmosphere.[8,9] This is supported by the determination of PFCAs and PFSAs in the particle phase in urban and remote atmospheres.[10,11] Furthermore, it is assumed that PFCs can be released into the gas phase in their neutral form by marine aerosols.[8,12] A recent study indicates that the aqueous phase can act as a net source for PFOA to the atmosphere.[9] Third, neutral, volatile precursors, such as fluorotelomer alcohols (FTOHs), fluorinated sulfonamides, and sulfonamidoethanols (FOSAs and FOSEs), could undergo long-range atmospheric transport and be degraded in remote regions to PFCAs and PFSAs.[13,14] Smog chamber experiments have shown that these volatile precursors can degrade by OH-initiated oxidation pathways to PFCAs and PFSAs in the atmosphere.[13–15] The estimated atmospheric lifetimes of FTOHs (~20 days) are sufficient for long-range transport to remote regions[15] and their presence in remote regions supports this hypothesis.[11,16] However, the main transport pathway of PFCs to remote regions has not been conclusively characterised to date.
Based on the production volume, historic emissions were estimated to be 6800–45 250 t for perfluorooctylsulfonyl fluoride (POSF) (1972–2002).[17] The majority of the emissions were estimated to have been released to the aqueous environment (~45 000 t) and only a small amount into the air (~235 t).[17] The emissions for PFCAs ranged between 3200 and 7300 t (1951–2004), from which the indirect emissions (PFCA impurities or precursors) were estimated to be 1–5 % of the total source emissions.[1] Overall, most studies indicate that the oceanic transport of directly emitted PFCs is the dominant transport pathway to remote regions.[7,18] However, the presence of PFCAs and PFSAs in precipitation,[19] in water and fish from high mountain lakes[20,21] and in ice caps and snow[22] demonstrate that the atmospheric transport of PFCAs and PFSAs and their precursors is an important transport pathway to remote locations like the Arctic. More measurements of the PFCs in the Arctic region are required to better understand the transport pathway.
In this study, PFC concentrations in the Canadian Arctic atmosphere were measured. Air samples were collected during a ship cruise onboard the Canadian Coast Guard Ship Amundsen crossing the Labrador Sea and Hudson Bay in summer 2007 and in the Beaufort Sea in spring and summer 2008. The objectives of this research were: (i) to determine concentrations of five PFC classes (i.e. FTOHs, FOSAs, FOSEs, PFCAs, and PFSAs) in the Canadian Arctic atmosphere; (ii) to compare the method performance and results between Environment Canada (EC) and the Lancaster Environment Centre (LEC); (iii) to investigate the partitioning behaviour of PFCs in the gas and particle phase; and (iv) to correlate PFC concentrations and particle-associated fractions with ambient air temperature.
Experimental
Sampling campaign
High volume air samples were collected onboard the CCGS Amundsen (~15 m above sea level) while crossing the Labrador Sea and Hudson Bay in summer 2007 and the Beaufort Sea in spring and summer 2008. Airborne PFCs were sampled using glass-fibre filters (GFFs) for the particle phase followed by a polyurethane foam PUF/XAD-2 sandwich for the gas phase. Type A/E GFFs were used at EC (102 mm, >1.0-μm particle retention, Pall Corporation, USA) and type GF/F from LEC (460 × 570 mm, >0.7-μm particle retention, Whatman, UK). The (PUF)/XAD-2 sandwich consisted of 15 g of XAD-2 resin (Supelco) between a PUF plug (76-mm diameter and 60 mm thick, Supelco, USA) divided in half (EC) and 25 g of XAD-2 resin (Supleco) between a PUF plug (76-mm diameter and 75 mm thick, Tisch Environment, OH, USA) divided in half (LEC). Air samples were collected by EC in the Labrador Sea (n = 3), in the Hudson Bay (n = 6) and in the Beaufort Sea (n = 11) with a sampling time of ~24 h collecting an air volume of ~385 m3. Furthermore, air samples were collected by LEC in the Beaufort Sea (n = 7) with a sampling time of ~48 h and a sample volume of ~945 m3. Air samples were collected during an overlapping period at two sampling locations in the Beaufort Sea by EC (sampling locations 10 and 11) and LEC (sampling locations 24 and 27) (see Fig. A1 in the Accessory publication). Field blanks were collected by placing the GFF and PUF/XAD-2 sandwich in the high volume sampler and then removing them after 1 min. Samples were shipped cold and stored at –4 °C until extraction. Details of the sampling locations, dates, air volume and average ambient air temperature are presented in Table A1 and Fig. A1 in the Accessory publication.
Analysis by EC
The target analytes included 22 PFCs (i.e. C4–C12, C14 PFCAs, C4, C6, C8, C10 PFSAs, 6 : 2, 8 : 2, 10 : 2 FTOH, perfluorooctane sulfonamide (PFOSA), methyl and ethyl FOSA and methyl and ethyl FOSE) plus 16 mass-labelled internal standards (IS) and N,N-dimethylperfluoro-1-octanesulfonamide (N,N-Me2FOSA), 13C8 PFOS and 13C8 PFOA as injection standards (InjS) (for details see Tables A2 and A3 in the Accessory publication).
Prior to extraction the PUF/XAD-2 sandwiches and GFFs were spiked with 25- and 5-ng absolute of an IS mixture containing mass-labelled IS (see Table A2 in the Accessory publication). PUF/XAD-2 sandwiches were Soxhlet extracted with petroleum ether for ~6 h, followed by a ~16-h extraction with methanol. The petroleum ether and methanol extracts were concentrated by rotary evaporation followed by gentle nitrogen blow down to 0.5 and 1 mL respectively. The methanol extract was further purified using the dispersive clean up with ENVI-Carb (100 mg, 1 mL, 100–400 mesh, Supelco, USA) and glacial acetic acid.[23] After centrifugation, 0.5 mL was transferred into a polypropylene vial. The GFFs were sonicated twice with dichloromethane and then twice with methanol. The dichloromethane and methanol extracts were concentrated by gentle nitrogen blow down to 0.5 and 1 mL respectively. The methanol extract was further purified with ENVI-Carb as described earlier. Prior to injection, 10 ng of N,N-Me2FOSA was added to the petroleum ether and dichloromethane extract respectively and 4 ng of 13C8 PFOS and 13C8 PFOA were added to the methanol extract as InjS.
Analysis was performed using gas chromatography (Agilent 7890A; Agilent Technologies, Palo Alto, CA) – mass spectrometry (Agilent 5975C; Agilent Technologies, Palo Alto, CA) (GC/MS) in selective ion monitoring (SIM) mode using positive chemical ionisation (PCI) for the FTOHs, FOSAs and FOSEs.[24] Aliquots of 2 µL were injected on a DB-WAX column (30 m, 0.25-mm inner diameter, 0.25-µm film, J&W Scientific, Folsom, USA) for quantification and on a DB5MS for confirmation (30 m, 0.25-mm inner diameter, 0.25-µm film, Agilent Technologies, Palo Alto, CA). The separation and detection of the PFCAs, PFSAs and PFOSA were performed by liquid chromatography (Agilent 1100; Agilent Technologies, Palo Alto, CA) with a triple quadrupole mass spectrometer interfaced with an electrospray ionisation source in negative-ion mode (LC–(–)ESI–MS/MS; API 4000, Applied Biosystems/MDS SCIEX, Foster City, CA). Aliquots of 25 μL were injected on a Luna C8(2) 100A column (50 × 2 mm2, 3-μm particle size; Phenomenex, Torrance, USA) using a gradient of 200 μL min–1 methanol and water (both with 10 × 10–3 M aqueous ammonium acetate solution (NH4OAc)). The IS quantification method was used, which is based on the ratio of the peak-areas of the target analyte to the IS.
Analysis by LEC
The target analytes included seven PFCs (i.e. 6 : 2, 8 : 2, 10 : 2 FTOH, methyl and ethyl FOSA and methyl and ethyl FOSE) plus seven mass-labelled IS and N,N-Me2FOSA and 13C-hexachlorobenzene (13C-HCB) as InjS (for details see Tables A4 and A5 in the Accessory publication).
Extraction of the PUF/XAD-2 sandwiches was performed by sequential cold column extraction with ethyl acetate. Samples were spiked with 5-ng absolute of an IS mixture containing mass-labelled FTOHs, FOSAs and FOSEs and were extracted by three separate immersions for 30 min in ethyl acetate. The three extracts were combined, concentrated by rotary evaporation to ~1 mL and then cleaned by passing through 2 × 0.7 cm of Envi-Carb. The extracts were concentrated by gentle nitrogen blow down to 0.5 mL and 12.5 ng of N,N-Me2FOSA and 13C-HCB was added as InjS. Finally the extract was reduced to a volume of 0.1 mL prior to injection. The GFF samples were not extracted.
Analysis was performed using gas chromatography (Thermo Trace GC Ultra, Thermo Scientific) – mass spectrometry (Thermo DSQ Quadrupole, Mass Spectrometer) (GC/MS) in SIM mode using PCI for the FTOHs, FOSAs and FOSEs. Aliquots of 2 µL were injected on a SUPELCOWAX column (60 m, 0.25-mm inner diameter, 0.25-µm film, Supelco, Bellefonte, PA). The IS quantification method was used as described for EC.
Quality control
Method detection limits (MDLs) were calculated from the field blanks (average of blanks + 3 × standard deviation (σ)). Field blank concentrations (n = 4) were <5 % of the concentrations measured in the samples for the FTOHs, FOSAs, FOSEs and longer chain PFCAs (C10–C14) (EC). Because of high field blank values for PFOS and shorter chain PFCAs (0.1–0.8 pg m–3), these compounds were not quantified in the actual sample (EC). Contamination of the samples can arise from different sources during the sample treatment (i.e. sampling, transport, storage, extraction and instrumental analysis). LEC field blank concentrations (n = 3) were <8 % of FTOH, FOSA and FOSE concentrations. The MDL ranged from 0.1–1.1 pg m–3 for FTOHs, FOSAs and FOSEs in the gas phase and from 0.01–0.6 pg m–3 for FTOHs, FOSAs, FOSEs and C10–C14 PFCAs in the particle phase (EC). MDLs for FTOHs, FOSAs and FOSEs ranged from 0.1–2.1 pg m–3 in LEC gas phase samples. Method recovery values, calculated from mass-labelled IS spiked prior to extraction and InjS added before injection, ranged from 38–153 % for FTOHs, FOSAs and FOSEs, and from 27–64 % for the PFCAs and PFSAs (EC). Recovery values ranged from 25–350 % for FTOHs, FOSAs and FOSEs (LEC). Low recoveries were found for 6 : 2 FTOH as a result of loss by evaporation (e.g. rotary evaporation or nitrogen blow down) whereas high recoveries were observed for the FOSAs and FOSEs because of signal enhancement during GC/MS determination. These results highlight the importance of the label compounds to correct for signal enhancement or suppression. All results were recovery and blank corrected for PFCs. Further details on the surrogates chosen for each native compound have been previously reported.[6,24]
Results and discussion
PFC concentration comparison between EC and LEC
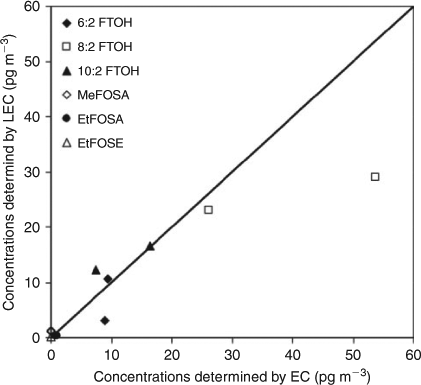
Both EC and LEC collected high volume air samples using GFFs and PUF/XAD-2 sandwiches and employed a GC/MS system for analysis using PCI and an IS quantification method whereas the sampling period and analytical process were different. In the samples that were collected during two overlapping periods, the concentrations of MeFOSA, MeFOSE and EtFOSE were below the MDL determined by EC and therefore a comparison of the results for these compounds was not possible. In general, the results of EC and LEC are in agreement within a factor of 1–3 (R = 0.93, Fig. 1 and Table A6 in the Accessory publication). The concentrations differed by a mean factor of 2.0 for 6 : 2 FTOH, 1.5 for 8 : 2 FTOH, 1.3 for 10 : 2 FTOH and 2.2 for EtFOSA. This is a good agreement considering the challenges associated with sampling in a remote area (i.e. Canadian Arctic) with very low PFC concentrations in the atmosphere and separate sampling systems. Besides the different analytical processes, the different sampling times (EC 24 h and LEC 48 h) and sampling volumes (EC ~385 m3 and LEC ~946 m3) may have an influence on the measured concentrations. To our knowledge this is the first intercomparison in which the whole procedure (sample collection to instrumental analysis) was compared for the analysis of PFCs in high volume air samples. Instrumental comparability studies showed an average accuracy of 22–44 % for four laboratories[25] and the values of two laboratories were generally within ±30 % of the theoretical values of an unknown standard mixture.[26] Overall, the results of this field intercomparison study showed similar results as reported for instrumental comparability studies, which did not consider additional factors such as sampling, transport and storage of the samples, sample extraction and the concentration of the extracts. Nevertheless, these results show a future need for an extensive method comparison of PFCs in air.
|
Air parcel back-trajectories
Back-trajectory analysis was carried out using the HYSPLIT (hybrid single-particle Lagrangian integrated trajectory) model from the NOAA Air Resources Laboratory (see http://www.Arl.Noaa.Gov/ready/hysplit4.html, accessed 13 July 2011). Six-day air back-trajectories calculated in 6-h steps are shown in Fig. 2a. The results indicate that during the entire cruise track the high volume air samples are representative of the Arctic air mass. The long-range transport of pollutants to the Arctic atmosphere varied seasonally.[27] For instance, south-to-north transport occurs mainly in springtime and melting ice and re-volatilisation could be a source especially during summer time.[22,27]

|
FTOHs, FOSAs and FOSEs in the gas phase
Concentrations of FTOHs, FOSAs and FOSEs in the gas phase of the Canadian Arctic atmosphere are shown in Table 1 and Fig. 2 (for details see Table A7 in the Accessory publication). The ∑PFC concentration in the gas phase ranged between 22 and 162 pg m–3. Generally, the FTOH concentrations were approximately six times higher than ∑FOSA/FOSE concentrations. The dominant FTOH was 8 : 2 FTOH (15–83 pg m–3), followed by 10 : 2 FTOH (3.5–31 pg m–3) and 6 : 2 FTOH (<1.1–29 pg m–3). For the FOSAs/FOSEs, MeFOSE was dominant (<0.06–22 pg m–3), followed by MeFOSA (<0.08–3.6 pg m–3), EtFOSE (<0.06–1.4 pg m–3) and EtFOSA (<0.04–1.7 pg m–3). Average ∑FOSA/FOSE concentrations over the Labrador Sea were higher (17 pg m–3) compared to the Hudson Bay and Beaufort Sea (11 and 7.6 pg m–3), whereas the ∑FTOH concentrations were more consistent at the different sampling locations (61–75 pg m–3). In general, these PFC concentration levels were approximately three times lower than in urban areas like Toronto, Canada and Hamburg, Germany.[16,28]

|
It is interesting to note that ∑FTOH concentrations in this study were approximately two times higher than measured previously in summer 2005.[16] FTOHs have an atmospheric half-life of ~20 days and can be degraded to PFCAs in the Arctic atmosphere.[15] This conversion of FTOH to PFCAs is expected to occur especially during summer by reaction with OH radicals. Thus lower FTOH concentrations are expected during summer.[29] However, both sampling campaigns were carried out during a similar period of the year (i.e. summer 2005[16] and spring–summer 2007–08 (this study) respectively). The comparison of the ratio of 6 : 2 FTOH to 8 : 2 FTOH to 10 : 2 FTOH on a concentration basis may help to determine whether the sources of FTOHs in the atmosphere changed over time.[30] The average 6 : 2 FTOH-to-8 : 2 FTOH-to-10 : 2 FTOH ratio of this study was 1.0 : 6.4 : 2.1. This matches well with the ratio observed in the Arctic atmosphere in 2005 (i.e. 1.0 : 5.6 : 2.6),[16] which suggests that the FTOHs originated from a similar source. The 6 : 2 FTOH-to-8 : 2 FTOH-to-10 : 2 FTOH ratio in urban areas (i.e. 1.0 : 2.3 : 1.2 in Toronto (Canada) and 1.0 : 1.8 : 0.5 in Hamburg (Germany) respectively) has a lower proportion of 8 : 2 FTOH and 10 : 2 FTOH.[16,28] This can be explained by the shorter half-lives of 6 : 2 FTOH (i.e. 50 days) in comparison to 8 : 2 FTOH and 10 : 2 FTOH (i.e. 80 and 70 days respectively) as calculated from Piekarz et al.[30] PFCs are supposed to be mainly produced and used in North America, Europe and East Asia.[1,17] Since the phase-out of POSF-based chemicals, the use of FTOHs has reportedly increased by a factor of two.[31] The increasing production and consequently increasing emissions to the atmosphere could explain the doubling of the FTOH concentrations between 2005 and 2007–08. However, a difference by a factor of two should not be considered significant and further long-term studies are necessary. Surprisingly, the ∑FOSE concentrations did not change in comparison to the study from 2005, although POSF-based chemicals were phased out in 2002.[17] However, the products containing POSF-based chemicals are still in use (e.g. carpets)[17] and the production has shifted partly to other countries.[32]
FTOHs, FOSAs and FOSEs in the particle phase
All FTOHs, FOSAs and FOSEs, except for 6 : 2 FTOH, were quantified in the particle phase in the Canadian Arctic atmosphere (Table 1, Fig. 2 and Table A8 in the Accessory publication). The ∑FTOH concentrations in the particle phase (i.e. 0.3–1.6 pg m–3) were lower by a factor of ~80 than in the gas phase, whereas the ∑FOSA/FOSE concentrations (i.e. 0.3–8.8 pg m–3) were lower by an approximate factor of four than in the gas phase. ∑FTOH concentrations were lowest over the Hudson Bay (i.e. 0.3–0.4 pg m–3), whereas higher concentrations were found over the Beaufort Sea and Labrador Sea (i.e. 0.3–1.6 and 0.9–1.5 pg m–3 respectively). Similarly, average ∑FOSA/FOSE concentrations were lowest over the Hudson Bay (i.e. 0.3–2.7 pg m–3), whereas highest concentrations were found over the Beaufort Sea (i.e. 0.6–8.8 pg m–3). It is interesting to note that for the gas phase, the highest FOSA/FOSE concentrations were observed over the Labrador Sea whereas the concentrations in the particle phase were highest over the Beaufort Sea. This indicates temperature driven partitioning processes (see section ‘Correlation Analyses’ below).
The dominant PFC class was the FOSEs (0.3–8.6 pg m–3) with MeFOSE as the dominant compound (<0.4–7.4 pg m–3), followed by EtFOSE (<0.03–3.2 pg m–3). The FTOH and FOSA concentrations of individual compounds were below 1 pg m–3, whereas the ∑FOSE concentrations were ~3 and ~20 times higher compared to the ∑FTOH and ∑FOSA concentrations respectively. Comparing our findings with data published from urban areas, the ∑FTOH/FOSA/FOSE concentrations in the particle phase were lower by a factor of 2–3 than in Toronto, Canada[16] and 7–12 lower than that in Hamburg and Manchester respectively.[28,33] However, the pattern of the PFC classes in the particle phase were similar and followed the trend FOSEs > FOSAs > FTOHs.
Concentrations of PFCAs
PFCAs and PFSAs were below MDLs in the gas phase. The longer chain PFCAs, PFDA, PFUnDA, PFDoDA and PFTeDA were quantified in the particle phase, whereas the shorter chain PFCAs (C4–C9) and PFSAs were not detected (Table 1 and Table A9 in the Accessory publication). PFCAs were only detected sporadically with highest concentrations for PFUnDA and PFDoDA (both 0.08 pg m–3). The concentrations of ∑PFCAs (<0.04–0.18 pg m–3) were much lower in comparison of ∑FTOH, ∑FOSA and ∑FOSE concentrations on particles (<0.1–1.6, <0.1–0.3 and 0.3–8.6 pg m–3 respectively). It is interesting to note that the average ∑PFCA concentrations over the Labrador Sea and Hudson Bay (0.09 and 0.05 pg m–3 respectively) were higher than over the Beaufort Sea (0.01 pg m–3), where only PFDoDA could be quantified in two samples. This is consistent with the concentrations of their potential precursor compounds, the FTOHs,[13] which were highest in the particle phase over the Labrador Sea. Barber et al.[33] reported PFDA and PFUnDA concentrations of a few pictograms per cubic metre at an urban and a semi-rural area in the UK, which is ~100 times higher compared to the levels in this study. Highest concentrations were found for PFOA with up to 828 pg m–3,[33] whereas PFOA concentrations in this study were all below the MDL (<0.8 pg m–3). High air concentrations close to emission sources and low concentrations in remote areas normally indicate a low atmospheric long-range transport potential. The presence of PFCAs in the particle phase could be also attributed to degradation of their potential precursors.[13]
Gas–particle partitioning
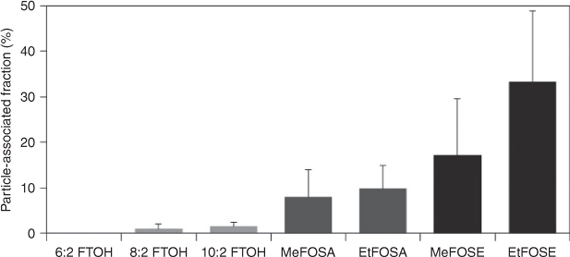
Although the FTOHs, FOSAs and FOSEs were dominantly distributed in the gas phase, individual compounds showed a different partitioning profile (Fig. 3). The particle-associated fraction (φ) represents the fraction on particles (cparticulate) in relation to the gas phase (cgaseous) in air.

|
The highest particle-associated fraction was observed for EtFOSEs (~33 %). The functional group has the main influence on the partitioning of PFCs. Thus, the particle-associated fractions decrease from the FOSEs (~25 %) to the FOSAs (~9 %) and FTOHs (~1 %). A similar pattern was observed in previous studies from urban and suburban areas in Germany and the UK.[28,33] In the present study, the particle-associated fraction of ethyl FOSA and FOSE (10 and 33 % respectively) was higher compared to the methyl FOSA and FOSE (8 and 17 % respectively). Furthermore, the particle-associated fraction for FTOHs increased slightly with increasing chain length (i.e. 6 : 2 FTOH (0 %) < 8 : 2 FTOH (1.0 %) < 10 : 2 FTOH (1.5 %)). This can be attributed to the lower vapour pressure of the longer chain FTOHs (e.g. 144 Pa for 10 : 2 FTOH) in comparison to the shorter chain FTOHs (e.g. 713 Pa for 6 : 2 FTOH).[34]
Longer chain PFCAs (C10–C12 and C14) were quantified in the particle phase, whereas no PFCAs could be detected in the gas phase. If half of the MDL was used for the values which were below the MDL, the particle-associated fraction would range from 76–83 % for the longer chain PFCAs. However, these results must be considered carefully, because of the low concentration levels in the Arctic region, and Arp et al.[35] have shown that gas phase PFCAs can adsorb to GFFs and therefore the particle-associated fraction might be overestimated.
Correlation analyses
Individual FTOHs correlated significantly in the gas phase (P < 0.01, Pearson Correlation, SPSS version 17.0 for Windows) and also a positive correlation between individual FOSAs/FOSEs were found in the gas and particle phase (P < 0.01, Pearson Correlation). Conversely, no correlation was found between the FTOHs and FOSAs/FOSEs (P > 0.05, Pearson correlation). This suggests that the FTOHs and FOSAs/FOSEs originated from different sources but individual compounds within these groups might have the same origin.
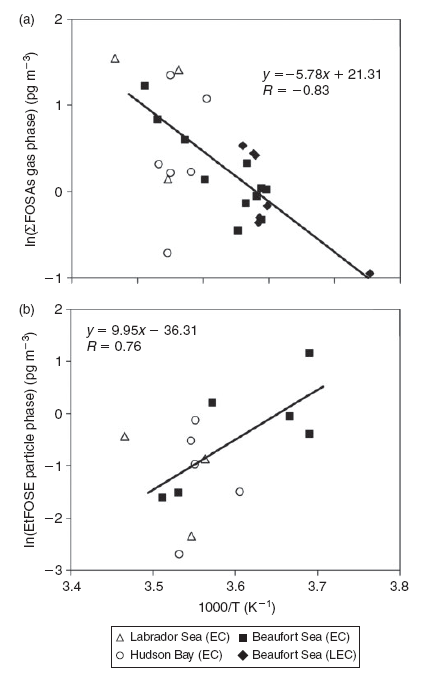
For the correlation analysis between the temperature and individual concentration levels, only the data from the Beaufort Sea were used to eliminate intercorrelations between the temperature and different sampling locations (Fig. 4). The FTOH, FOSE and FOSA concentrations in the gas phase generally decrease with decreasing temperature. However, this trend was only significant for the ∑FOSA concentrations over the Beaufort Sea (R = –83, P < 0.01, Pearson Correlation, note: PFC concentrations were correlated with inverse temperature). This is an indication that (i) temperature-driven partitioning to atmospheric particulate matter is lowering gas phase concentrations at extremely cold temperatures, or (ii) regional or ‘within-Arctic’ sources such as temperature-driven partitioning between snow–ice surfaces or possibly open seawater may be influencing FOSAs in the atmosphere. The collection of air samples over the eastern end of the Beaufort Sea was during ice-cover, so the area of open seawater in contact with the overlying atmosphere was negligible, implying that the sea-ice snowpack may be playing a role in controlling ambient concentrations of FOSAs in winter Arctic air. However, the FOSAs can also originate from warm air masses transported over long distances from source regions in the south, although back trajectories showed no influence from the south. Similarly, the concentration of EtFOSE in the particle phase increased with decreasing temperature over the Beaufort Sea (R = 76, P < 0.01, Pearson correlation). This can be explained by the fact that at colder temperatures, equilibrium phase partitioning of organic compounds is driven towards the particle phase.[36] The large scatter in the EtFOSE data indicate that, in addition to temperature, other factors (e.g. volatilisation from surfaces or long-range transport from source areas) may also be controlling the air concentrations of this chemical.
|
Jahnke et al.[28] showed that the ambient temperature has an influence on the gas–particle partitioning of PFCs. In this study, the particle-bound fraction of FOSAs and FOSEs increased with decreasing ambient air temperature (R = 0.28–0.65). It is probable, therefore, that the proportion of these compounds in the particle phase would be higher in winter time compared to the summer time. This effect is generally observed for other condensed phases like water, soil and biota for which the partition coefficient favours the condensed phase at lower temperature.[36] Thus, fluctuations in ambient air temperature may play an important role for the deposition, degradation, transport and fate of PFCs, even in the Arctic.
Conclusions
The current study presents the spatial distribution of four PFC classes (i.e. FTOHs, FOSAs, FOSEs and PFCAs) in the Canadian Arctic atmosphere. The widespread distribution of PFCs in the Arctic atmosphere shows their potential for long-range atmospheric transport to remote regions. The sampling, extraction and instrumental method performance was compared between EC and LEC and showed a good agreement with each other. In the gas phase, ∑FTOH concentrations were approximately six times higher compared to the ∑FOSA/FOSE concentrations, whereas the FOSEs were the dominant PFC class in the particle phase. The particle-associated fraction followed the general trend PFCAs > FOSEs > FOSAs > FTOHs. Ambient air temperature had a significant influence on the partitioning behaviour of FOSAs and FOSEs. This indicates that the atmospheric behaviour of these compounds is influenced by temperature-driven exchange with surfaces, possibly including extensive areas of sea-ice snow as well as surface seawater. Overall, these results highlight that the gas–particle partitioning of PFCs plays an important role on their global transport and fate in the atmosphere.
Accessory publication
Additional information about the analytes, sampling campaign, intercomparison study and overview of PFC concentrations is available in the Accessory publication (see http://www.publish.csiro.au/?act=view_file&file_id=EN10131_AC.pdf).
Acknowledgements
The authors kindly acknowledge Hayley Hung, Liisa Jantunen and Fiona Wong (Environment Canada) for performing sampling onboard the CCGS Amundsen. The ship crew is gratefully acknowledged for their kind help and excellent cooperation. Tom Harner is thanked for helpful comments on the manuscript. The authors also thank the Chemical Management Division and Chemical Management Plan for partial funding as well as UK NERC grant NE/E00511X/1 ‘ArcPOP’ and EU 7FP project ‘ArcRisk’ (Contract 1346810).
References
[1] K. Prevedouros, I. T. Cousins, R. C. Buck, S. H. Korzeniowski, Sources, fate and transport of perfluorocarboxylates. Environ. Sci. Technol. 2006, 40, 32.| Sources, fate and transport of perfluorocarboxylates.Crossref | GoogleScholarGoogle Scholar | 1:CAS:528:DC%2BD2MXht1Gru7zK&md5=14e91a9069cf17a00b47907f105e54b6CAS |
[2] E. Kissa, Fluorinated Surfactants and Repellents 2001 (Marcel Dekker: New York).
[3] M. Houde, J. W. Martin, R. J. Letcher, K. R. Solomon, D. C. G. Muir, Biological monitoring of polyfluoroalkyl substances: a review. Environ. Sci. Technol. 2006, 40, 3463.
| Biological monitoring of polyfluoroalkyl substances: a review.Crossref | GoogleScholarGoogle Scholar | 1:CAS:528:DC%2BD28XktVers7w%3D&md5=f4882d1064a287c19c118a9ecfaadc61CAS |
[4] J. P. Giesy, K. Kannan, Global distribution of perfluorooctane sulfonate in wildlife. Environ. Sci. Technol. 2001, 35, 1339.
| Global distribution of perfluorooctane sulfonate in wildlife.Crossref | GoogleScholarGoogle Scholar | 1:CAS:528:DC%2BD3MXhsVGnurg%3D&md5=e5a5453b4d2a3d83f723af878a2c9adbCAS |
[5] J. M. Armitage, M. Macleod, I. T. Cousins, Modeling the global fate and transport of perfluorooctanoic acid (PFOA) and perfluorooctanoate (PFO) emitted from direct sources using a multispecies mass balance model. Environ. Sci. Technol. 2009, 43, 1134.
| Modeling the global fate and transport of perfluorooctanoic acid (PFOA) and perfluorooctanoate (PFO) emitted from direct sources using a multispecies mass balance model.Crossref | GoogleScholarGoogle Scholar | 1:CAS:528:DC%2BD1MXotlKmtw%3D%3D&md5=4c35bed062ff033d576453394497278dCAS |
[6] L. Ahrens, J. L. Barber, Z. Xie, R. Ebinghaus, Longitudinal and latitudinal distribution of perfluoroalkyl compounds in the surface water of the Atlantic Ocean. Environ. Sci. Technol. 2009, 43, 3122.
| Longitudinal and latitudinal distribution of perfluoroalkyl compounds in the surface water of the Atlantic Ocean.Crossref | GoogleScholarGoogle Scholar | 1:CAS:528:DC%2BD1MXjvFalsb0%3D&md5=0577ff8869ac9a9ff85c8a3b5d2cc878CAS |
[7] J. Armitage, I. T. Cousins, R. C. Buck, K. Prevedouros, M. H. Russell, M. Macleod, S. H. Korzeniowski, Modeling global-scale fate and transport of perfluorooctanoate emitted from direct sources. Environ. Sci. Technol. 2006, 40, 6969.
| Modeling global-scale fate and transport of perfluorooctanoate emitted from direct sources.Crossref | GoogleScholarGoogle Scholar | 1:CAS:528:DC%2BD28XhtV2qs7%2FK&md5=69fbd98978a84fd224bc61a80d2900d9CAS |
[8] C. J. McMurdo, D. A. Ellis, E. Webster, J. Butler, R. D. Christensen, L. K. Reid, Aerosol enrichment of the surfactant PFO and mediation of the water-air transport of gaseous PFOA. Environ. Sci. Technol. 2008, 42, 3969.
| Aerosol enrichment of the surfactant PFO and mediation of the water-air transport of gaseous PFOA.Crossref | GoogleScholarGoogle Scholar | 1:CAS:528:DC%2BD1cXkvFKhsrg%3D&md5=5662bb6cfadb5d342ee5401a03e8351dCAS |
[9] E. Webster, D. A. Ellis, Potential role of sea spray generation in the atmospheric transport of perfluorocarboxylic acids. Environ. Toxicol. Chem. 2010, 29, 1703.
| Potential role of sea spray generation in the atmospheric transport of perfluorocarboxylic acids.Crossref | GoogleScholarGoogle Scholar | 1:CAS:528:DC%2BC3cXhtlSju7vK&md5=2d6fbbad0de7a6db5ac433ffee308933CAS |
[10] A. Jahnke, U. Berger, R. Ebinghaus, C. Temme, Latitudinal gradient of airborne polyfluorinated alkyl substances in the marine atmosphere between Germany and South Africa (53 °N–33 °S). Environ. Sci. Technol. 2007, 41, 3055.
| Latitudinal gradient of airborne polyfluorinated alkyl substances in the marine atmosphere between Germany and South Africa (53 °N–33 °S).Crossref | GoogleScholarGoogle Scholar | 1:CAS:528:DC%2BD2sXjslWgsb0%3D&md5=dd81d1257116b93697e928261b85484cCAS |
[11] N. L. Stock, V. I. Furdui, D. C. G. Muir, S. A. Mabury, Perfluoroalkyl contaminants in the Canadian Arctic: evidence of atmospheric transport and local contamination. Environ. Sci. Technol. 2007, 41, 3529.
| Perfluoroalkyl contaminants in the Canadian Arctic: evidence of atmospheric transport and local contamination.Crossref | GoogleScholarGoogle Scholar | 1:CAS:528:DC%2BD2sXkt1OrsLY%3D&md5=47f6ada56c14e618484ff3141d8aa527CAS |
[12] X. Ju, Y. Jin, K. Sasaki, N. Saito, Perfluorinated surfactants in surface, subsurface water and microlayer from Dalian coastal waters in China. Environ. Sci. Technol. 2008, 42, 3538.
| Perfluorinated surfactants in surface, subsurface water and microlayer from Dalian coastal waters in China.Crossref | GoogleScholarGoogle Scholar | 1:CAS:528:DC%2BD1cXksFars7s%3D&md5=214985f8d7ceb4138f9a47002f7ec480CAS |
[13] D. A. Ellis, J. W. Martin, S. A. Mabury, A. O. De Silva, M. D. Hurley, M. D. Sulbaek Anderson, T. J. Wallington, Degradation of fluorotelomer alcohols: a likely atmospheric source of perfluorinated carboxylic acids. Environ. Sci. Technol. 2004, 38, 3316.
| Degradation of fluorotelomer alcohols: a likely atmospheric source of perfluorinated carboxylic acids.Crossref | GoogleScholarGoogle Scholar | 1:CAS:528:DC%2BD2cXjvVShsb0%3D&md5=1a2a8158f069618f177c7efa759abbccCAS |
[14] J. W. Martin, D. A. Ellis, S. A. Mabury, M. D. Hurley, T. J. Wallington, Atmospheric chemistry of perfluoroalkanesulfonamides: kinetic and product studies of the OH radical and Cl atom initiated oxidation of n-ethyl perfluorobutanesulfonamide. Environ. Sci. Technol. 2006, 40, 864.
| Atmospheric chemistry of perfluoroalkanesulfonamides: kinetic and product studies of the OH radical and Cl atom initiated oxidation of n-ethyl perfluorobutanesulfonamide.Crossref | GoogleScholarGoogle Scholar | 1:CAS:528:DC%2BD2MXhtlekurbM&md5=af7be02670c9dd4f3b823cf408ef1fb9CAS |
[15] D. A. Ellis, J. W. Martin, S. A. Mabury, M. D. Hurley, M. D. Sulbaek Anderson, T. J. Wallington, Atmospheric lifetime of fluorotelomer alcohols. Environ. Sci. Technol. 2003, 37, 3816.
| Atmospheric lifetime of fluorotelomer alcohols.Crossref | GoogleScholarGoogle Scholar | 1:CAS:528:DC%2BD3sXltlaqt7o%3D&md5=c330276a37dfc8dfb5b8b307b41c2bdfCAS |
[16] M. Shoeib, T. Harner, P. Vlahos, Perfluorinated chemicals in the Arctic atmosphere. Environ. Sci. Technol. 2006, 40, 7577.
| Perfluorinated chemicals in the Arctic atmosphere.Crossref | GoogleScholarGoogle Scholar | 1:CAS:528:DC%2BD28Xht1SlsrzK&md5=a5e45f2168df38e4815e34d061c1b01aCAS |
[17] A. G. Paul, K. C. Jones, A. J. Sweetman, A first global production, emission, and environmental inventory for perfluorooctane sulfonate. Environ. Sci. Technol. 2009, 43, 386.
| A first global production, emission, and environmental inventory for perfluorooctane sulfonate.Crossref | GoogleScholarGoogle Scholar | 1:CAS:528:DC%2BD1cXhsVyks7%2FJ&md5=63238d1759e406591a922fb0ed3a709cCAS |
[18] F. Wania, A global mass balance analysis of the source of perfluorocarboxylic acids in the Arctic Ocean. Environ. Sci. Technol. 2007, 41, 4529.
| A global mass balance analysis of the source of perfluorocarboxylic acids in the Arctic Ocean.Crossref | GoogleScholarGoogle Scholar | 1:CAS:528:DC%2BD2sXlsFenu7k%3D&md5=46fdcb34f607d1fd07086ea7a0a12667CAS |
[19] M. Loewen, T. Halldorson, F. Wang, G. Tomy, Fluorotelomer carboxylic acids and PFOS in rainwater from an urban center in Canada. Environ. Sci. Technol. 2005, 39, 2944.
| Fluorotelomer carboxylic acids and PFOS in rainwater from an urban center in Canada.Crossref | GoogleScholarGoogle Scholar | 1:CAS:528:DC%2BD2MXitlShsr8%3D&md5=381ff1e6e55f6ce1eb3c6f75dc3b539bCAS |
[20] M. Loewen, F. Wania, F. Wang, G. Tomy, Altitudinal transect of atmospheric and aqueous fluorinated organic compounds in western Canada. Environ. Sci. Technol. 2008, 42, 2374.
| Altitudinal transect of atmospheric and aqueous fluorinated organic compounds in western Canada.Crossref | GoogleScholarGoogle Scholar | 1:CAS:528:DC%2BD1cXisFWkt7Y%3D&md5=e3751b43c9dca196163df0461fedececCAS |
[21] L. Ahrens, N. Marusczak, J. Rubarth, A. Dommergue, R. Nedjai, C. Ferrari, R. Ebinghaus, Distribution of perfluoroalkyl compounds and mercury in fish liver from high-mountain lakes in France originating from atmospheric deposition. Environ. Chem. 2010, 7, 422.
| Distribution of perfluoroalkyl compounds and mercury in fish liver from high-mountain lakes in France originating from atmospheric deposition.Crossref | GoogleScholarGoogle Scholar | 1:CAS:528:DC%2BC3cXhsFChsrfF&md5=8c51fe1d823ea2cdc7b40316c40d4942CAS |
[22] C. J. Young, V. I. Furdui, J. Franklin, R. M. Koerner, D. C. Muir, S. A. Mabury, Perfluorinated acids in arctic snow: new evidence for atmospheric formation. Environ. Sci. Technol. 2007, 41, 3455.
| Perfluorinated acids in arctic snow: new evidence for atmospheric formation.Crossref | GoogleScholarGoogle Scholar | 1:CAS:528:DC%2BD2sXjsVGrsLs%3D&md5=d5bc2c7b7722ba6f1a9e5c0664e43482CAS |
[23] C. R. Powley, S. W. George, T. W. Ryan, R. C. Buck, Matrix effect-free analytical methods for determination of perfluorinated carboxylic acids in environmental matrixes. Anal. Chem. 2005, 77, 6353.
| Matrix effect-free analytical methods for determination of perfluorinated carboxylic acids in environmental matrixes.Crossref | GoogleScholarGoogle Scholar | 1:CAS:528:DC%2BD2MXps1erurk%3D&md5=a834e44fc7884ac680c45d2e65f0962aCAS |
[24] M. Shoeib, P. Vlahos, T. Harner, A. Peters, M. Graustein, J. Narayan, Survey of polyfluorinated chemicals PFCs in the atmosphere over the northeast Atlantic Ocean. Atmos. Environ. 2010, 44, 2887.
| Survey of polyfluorinated chemicals PFCs in the atmosphere over the northeast Atlantic Ocean.Crossref | GoogleScholarGoogle Scholar | 1:CAS:528:DC%2BC3cXnvFOisrw%3D&md5=b36ed008b10dc79abe81f7f9cd217d8dCAS |
[25] A. Dreyer, M. Shoeib, S. Fiedler, J. L. Barber, T. Harner, K.-W. Schramm, K. C. Jones, R. Ebinghaus, Field intercomparison on the determination of volatile and semivolatile polyfluorinated compounds in air. Environ. Chem. 2010, 7, 350.
| Field intercomparison on the determination of volatile and semivolatile polyfluorinated compounds in air.Crossref | GoogleScholarGoogle Scholar | 1:CAS:528:DC%2BC3cXht12jsbzN&md5=e8778d3842778f0f4de93f5abce63276CAS |
[26] A. Jahnke, L. Ahrens, R. Ebinghaus, U. Berger, J. L. Barber, C. Temme, An improved method for the analysis of volatile polyfluorinated alkyl substances in environmental air samples. Anal. Bioanal. Chem. 2007, 387, 965.
| An improved method for the analysis of volatile polyfluorinated alkyl substances in environmental air samples.Crossref | GoogleScholarGoogle Scholar | 1:CAS:528:DC%2BD2sXht1Wiu7k%3D&md5=a1b9c9e53b507a89dd9bad7754d1e77bCAS |
[27] L. A. Barrie, D. Gregor, B. Hargrave, R. Lake, D. Muir, R. Shearer, B. Tracey, T. Bidleman, Arctic contaminants: sources, occurrence and pathways. Sci. Total Environ. 1992, 122, 1.
| Arctic contaminants: sources, occurrence and pathways.Crossref | GoogleScholarGoogle Scholar | 1:CAS:528:DyaK38XltlOjtL4%3D&md5=79459846d6b8bccb2b50a6629c42c661CAS |
[28] A. Jahnke, L. Ahrens, R. Ebinghaus, C. Temme, Urban versus remote air concentrations of fluorotelomer alcohols and other polyfluorinated alkyl substances in Germany. Environ. Sci. Technol. 2007, 41, 745.
| Urban versus remote air concentrations of fluorotelomer alcohols and other polyfluorinated alkyl substances in Germany.Crossref | GoogleScholarGoogle Scholar | 1:CAS:528:DC%2BD28XhtlektLzL&md5=452f5dfdf7ee90cf831c40b6ed543dbbCAS |
[29] T. J. Wallington, M. D. Hurley, J. Xia, D. J. Wuebbles, S. Sillman, A. Ito, J. E. Penner, D. A. Ellis, J. Martin, S. A. Mabury, O. J. Nielsen, M. P. Sulbaek Anderson, Formation of C7F15COOH (PFOA) and other perfluorocarboxylic acids during the atmospheric oxidation of 8 : 2 fluorotelomer alcohol. Environ. Sci. Technol. 2006, 40, 924.
| Formation of C7F15COOH (PFOA) and other perfluorocarboxylic acids during the atmospheric oxidation of 8 : 2 fluorotelomer alcohol.Crossref | GoogleScholarGoogle Scholar | 1:CAS:528:DC%2BD2MXhtlCgsrjO&md5=09301cbe0528631906d1dea7e4414b19CAS |
[30] A. M. Piekarz, T. Primbs, J. A. Field, D. F. Barofsky, S. Simonich, Semivolatile fluorinated organic compounds in Asian and Western US air masses. Environ. Sci. Technol. 2007, 41, 8248.
| Semivolatile fluorinated organic compounds in Asian and Western US air masses.Crossref | GoogleScholarGoogle Scholar | 1:CAS:528:DC%2BD2sXhtlSgurzM&md5=f419da1fe5cdabd320438e58538a94dbCAS |
[31] Dupont Global PFOA Strategy Update. Presentation to USEPAOPPT, US Environmental Protection Agency Public Docket AR226-1914, Washington, DC, 31 January 2005 (Environmental Protection Agency: Washington, DC).
[32] T. Wang, Y. Wang, C. Liao, G. Jiang, Perspectives on the inclusion of perfluorooctane sulfonate into the Stockholm Convention on persistent organic pollutants. Environ. Sci. Technol. 2009, 43, 5171.
| Perspectives on the inclusion of perfluorooctane sulfonate into the Stockholm Convention on persistent organic pollutants.Crossref | GoogleScholarGoogle Scholar | 1:CAS:528:DC%2BD1MXmvVKrur8%3D&md5=b119578caa6fe003523fc7d706c1fe79CAS |
[33] J. L. Barber, U. Berger, C. Chaemfa, S. Huber, A. Jahnke, C. Temme, K. C. Jones, Analysis of per- and polyfluorinated alkyl substances in air samples from Northwest Europe. J. Environ. Monit. 2007, 9, 530.
| Analysis of per- and polyfluorinated alkyl substances in air samples from Northwest Europe.Crossref | GoogleScholarGoogle Scholar | 1:CAS:528:DC%2BD2sXmtFemsrw%3D&md5=0dbdbbfb7b08c8b77cf9717ca9a1dc38CAS |
[34] N. L. Stock, D. A. Ellis, L. Deleebeeck, D. C. G. Muir, S. A. Mabury, Vapor pressures of the fluorinated telomer alcohols – limitations of estimation methods. Environ. Sci. Technol. 2004, 38, 1693.
| Vapor pressures of the fluorinated telomer alcohols – limitations of estimation methods.Crossref | GoogleScholarGoogle Scholar | 1:CAS:528:DC%2BD2cXptVKnsQ%3D%3D&md5=37ac97cb18d6dce81b1c6d57354daa05CAS |
[35] H. P. H. Arp, K. U. Goss, Irreversible sorption of trace concentrations of perfluorocarboxylic acids to fiber filters used for air sampling. Atmos. Environ. 2008, 42, 6869.
| Irreversible sorption of trace concentrations of perfluorocarboxylic acids to fiber filters used for air sampling.Crossref | GoogleScholarGoogle Scholar | 1:CAS:528:DC%2BD1cXhtFSqsbjL&md5=80d2de80b9fd006fd37f630c37b68151CAS |
[36] R. W. Macdonald, L. A. Barrie, T. F. Bidleman, M. L. Diamond, D. J. Gregor, R. G. Semkin, W. M. J. Strachan, Y. F. Li, F. Wania, M. Alaee, L. B. Alexeeva, S. M. Backus, R. Bailey, J. M. Bewers, C. Gobeil, C. J. Halsall, T. Harner, J. T. Hoff, L. M. M. Jantunen, W. L. Lockhart, D. Mackay, D. C. G. Muir, J. Pudykiewicz, K. J. Reimer, J. N. Smith, G. A. Stern, W. H. Schroeder, R. Wagemann, M. B. Yunker, Contaminants in the Canadian Arctic: 5 years of progress in understanding sources, occurrence and pathways. Sci. Total Environ. 2000, 254, 93.
| Contaminants in the Canadian Arctic: 5 years of progress in understanding sources, occurrence and pathways.Crossref | GoogleScholarGoogle Scholar | 1:CAS:528:DC%2BD3cXjs1Wju7w%3D&md5=a1b4fbfdeea9c665cdefc1f385f2a7a0CAS |