

Focal plane array detector-based micro-Fourier-transform infrared imaging for the analysis of microplastics in environmental samples
Martin Günter Joachim Löder A B C , Mirco Kuczera A , Svenja Mintenig A , Claudia Lorenz A and Gunnar Gerdts AA Alfred-Wegener-Institut, Helmholtz-Zentrum für Polar- und Meeresforschung, Biologische Anstalt Helgoland, POB 180, D-27483 Helgoland, Germany.
B Animal Ecology I, University of Bayreuth, Universitätsstraße 30, D-95440 Bayreuth, Germany.
C Corresponding author. Email: martin.loeder@uni-bayreuth.de
Environmental Chemistry 12(5) 563-581 https://doi.org/10.1071/EN14205
Submitted: 30 September 2014 Accepted: 5 February 2015 Published: 6 August 2015
Journal Compilation © CSIRO Publishing 2015 Open Access CC BY-NC-ND
Environmental context. Microplastics are of increasing environmental concern following reports that they occur worldwide from the arctic to the deep sea. However, a reliable methodology that facilitates an automated measurement of abundance and identity of microplastics is still lacking. We present an analytical protocol that applies focal plane array detector-based infrared imaging of microplastics enriched on membrane filters applicable to investigations of microplastic pollution of the environment.
Abstract. The pollution of the environment with microplastics (plastic pieces <5 mm) is a problem of increasing concern. However, although this has been generally recognised by scientists and authorities, the analysis of microplastics is often done by visual inspection alone with potentially high error rates, especially for smaller particles. Methods that allow for a fast and reliable analysis of microplastics enriched on filters are lacking. Our study is the first to fill this gap by using focal plane array detector-based micro-Fourier-transform infrared imaging for analysis of microplastics from environmental samples. As a result of our iteratively optimised analytical approach (concerning filter material, measuring mode, measurement parameters and identification protocol), we were able to successfully measure the whole surface (>10-mm diameter) of filters with microplastics from marine plankton and sediment samples. The measurement with a high lateral resolution allowed for the detection of particles down to a size of 20 μm in only a fractional part of time needed for chemical mapping. The integration of three band regions facilitated the pre-selection of potential microplastics of the ten most important polymers. Subsequent to the imaging the review of the infrared spectra of the pre-selected potential microplastics was necessary for a verification of plastic polymer origin. The approach we present here is highly suitable to be implemented as a standard procedure for the analysis of small microplastics from environmental samples. However, a further automatisation with respect to measurement and subsequent particle identification would facilitate the even faster and fully automated analysis of microplastic samples.
Additional keywords: microplastic analysis, microplastic detection, microplastic identification.
Introduction
By the middle of the last century the success story of a new group of material – plastics – started. This material revolutionised our daily life completely and its rise heralded the start of the so-called ‘plastic age’.[1] One of the main advantages of plastics, their durability, is however simultaneously one of the major threats to the environment and this is especially true for the oceans.[2–4] Whether wind-blown into the sea, introduced by rivers, municipal drainage systems and sewage effluents,[5–9] plastic litter originating from terrestrial sources will often find its way into the sea. Offshore sources for plastic litter are vessels, boats or offshore platforms,[10] contents of lost containers from cargo shipping,[8] the world’s fishing fleet[6] and the marine aquaculture.[11] Independently of where the plastic litter originates from, the still increasing global production of synthetic polymers leads to the fact that the amount of litter that arrives in the oceans will constantly increase in the future[12] which leads to an accumulation of plastic litter in the marine environment.[7,13]
Whether deliberately dumped or accidentally lost, plastic litter can persist within marine habitats for prolonged periods of time, as a result of both the durability of polymeric materials and the prevailing physical and chemical conditions at sea (e.g. cool temperatures and low availability of UV light).[7,14] Thus, the problems related to plastic litter will probably persist for centuries even if their introduction in the environment is immediately stopped.[7]
In particular, plastic litter is rarely degraded by biological processes but becomes fragmented over time into smaller and smaller pieces as a result of embrittlement by weathering processes.[15] These secondary micro-fragments together with micro-sized primary plastic litter from, for example cosmetics and care products, lead to an increasing amount of small plastic particles <5 mm, so called ‘microplastics’, in the oceans.[6] Although this size limit is widely accepted further subdivision of this fraction is still a matter of discussion. According to Hidalgo-Ruz et al.[16] microplastics can be further size divided into large microplastics (500 µm–5 mm) and small microplastics (<500 µm). Galgani et al.[17] proposed to distinguish between these two fractions at a size of 1 mm instead (large microplastics: 1–5 mm and small microplastics: 20 µm–1 mm) and this suggestion is about to be adopted in the implementation process of the European Marine Strategy Framework Directive (MSFD). Investigating the whole size range of microplastics <5 mm in future research could ensure comparability between studies independent of the size limit for subdivision into small or large microplastics, as a division into size classes is still possible after analysis. (In this study we used the size division according to Hidalgo-Ruz et al.[16] as particles <500 µm can barely be handled manually for fast spectroscopic single particle analyses and thus have to been concentrated on filters. These filters were then measured by transmittance focal plane array (FPA) detector-based micro-Fourier-transform infrared (micro-FTIR) spectroscopy).
Meanwhile, the accumulation of microplastics in the oceans has been recognised by scientists and authorities worldwide and previous studies have demonstrated the ubiquitous presence of microplastics in the marine environment[14,15,18–26] and the uptake of microplastics by various marine biota.[27–31] As a consequence of the uptake physical effects such as potentially fatal injuries (e.g. blockages throughout the digestive tract or lesions from sharp objects) are to be expected.[4] These physical effects, however, mainly affect microorganisms, smaller invertebrates or larvae on the level of a single organism. Another more alarming aspect is that microplastics can release toxic additives and they are known to accumulate persistent organic pollutants (POPs).[32–36] Hence, when microplastics, because of their minuteness, enter marine food webs at low trophic levels they simultaneously harbour the risk of potentially propagating these toxic substances up the food chain.[37,38] This issue is discussed controversially in recent research and although several studies suggest it being of minor importance from a risk assessment perspective[39,40] microplastics have the potential to transport POPs to human food.[33] In addition, because of their material properties many microplastic particles are buoyant and their durability enables them to travel long distances.[41] They can thus function as vectors for the dispersal of toxic or pathogenic microorganisms.[42–44]
Although the potential risks of marine microplastics have recently been widely acknowledged, reliable data on concentrations of microplastics and the composition of involved polymers in the marine environment are lacking as there are no standard operation protocols (SOPs) for microplastic sampling and identification.[16,45–47] First steps towards a standardisation have been made,[17] however, a huge variety of different methods leads to the generation of data of extremely different quality and resolution which prevents comparability. One of the most critical points in microplastic research is visual sorting for the separation of potential microplastics from other organic or inorganic material in samples[16] done by the naked eye[48] or under a dissection microscope.[49] Such a procedure is uncritical if large microplastic particles are the target of a study. The investigation of small microplastic particles requires the concentration on filters and visual identification alone[50–53] can result in high identification errors since these small particles cannot be discriminated visually from other material such as sand grains, chitin fragments, diatom frustule fragments, etc. Thus, it is no wonder that the error rate of visual sorting reported in the literature ranges from 20[54] to 70 %[16] and increases with decreasing particle size. Moreover, the concentration of microplastics in sediment samples from similar locations can vary by two orders of magnitude when comparing data of visual identification (even if not confirmed as erroneous) with data of spectroscopy based quantification[21,50] thereby raising significant caution when relying on visual inspection alone.[55]
To circumvent the problem of misidentification, it is highly necessary to analyse potential microplastic particles with techniques that facilitate a proper identification.[16,56]
Thermo-chemical methods like pyrolysis gas chromatography–mass spectrometry (GC-MS) allow for the identification of the polymer origin of particles by comparing their characteristic combustion products with reference pyrograms of known virgin polymer samples.[47,57] Spectroscopic techniques like Raman spectroscopy[22,27,46,58] and especially Fourier-transform infrared (FTIR) spectroscopy[13,20,23,59–61] are straight-forward techniques that have been successfully used to identify microplastic particles from different environmental samples with high reliability.
During the analysis with Raman spectroscopy the interaction of laser light with the molecules and atoms of the sample (vibrational, rotational and other low-frequency interactions) results in the so called Raman shift and thus substance-characteristic Raman spectra. Infrared (IR) spectroscopy takes advantage of the fact that infrared radiation also excites molecular vibrations when interacting with a sample which facilitates the measurement of characteristic IR spectra. FTIR and Raman spectroscopy are complementary techniques as vibrations that are Raman inactive are IR active and vice-versa. Plastic polymers possess highly specific IR and Raman spectra with distinct band patterns, thus both techniques are ideal for the identification of microplastics. Coupled to microscopy ‘micro’-spectroscopy allows for the analysis of microscopic particles and their clear assignment to polymer origin.[23,27,59]
However, up to date only two studies have been published that make use of chemical mapping by reflectance micro-FTIR spectroscopy for identifying microplastics from environmental samples concentrated on filters.[23,59] Chemical mapping with a single detector element, i.e. the sequential measurement of IR spectra at laterally separated, user-defined points on the sample surface,[62] is extremely time-consuming when targeting the whole surface of a filter at a high spatial resolution. Thus, both studies analysed only sub-areas of the filter surface.[23,59] In addition to the time needed for the measurements and the expected bias associated with the extrapolation of subsamples, reflectance micro-FTIR has the disadvantage that the measurement of irregularly shaped microplastic particles present in environmental samples may result in un-interpretable spectra as a result of refractive errors.[59] Although particularly suitable for identifying very small plastic particles (<100 µm), further methodological improvements are needed for large scale applicability of reflectance micro-FTIR in environmental studies.[23]
A highly promising FTIR advancement – FPA-based micro-FTIR imaging – uses a grid of many detector elements (FPA) and facilitates the generation of chemical images by simultaneously recording several thousand spectra within one single time-saving measurement.[62] This technique allows the circumvention of the abovementioned disadvantages of chemical mapping and potentially facilitates the detailed and unbiased high throughput analysis of total microplastics on a sample filter as concluded by Harrison et al.[59]
In the herein presented study, we tested the applicability of FPA-based micro-FTIR imaging for the detection of microplastics. The aim of our study was (1) the evaluation of FPA-based micro-FTIR imaging for the identification of small microplastics, (2) the development of an approach using FPA-based micro-FTIR imaging to quantify microplastics on whole sample filters with a high lateral resolution in a minimal time frame and (3) the development of a post-processing protocol to identify the most important synthetic polymers in environmental samples.
Methodology
FTIR system
All measurements were carried out with a ‘Tensor 27’ FTIR spectrometer (Bruker Optik GmbH, Ettlingen, Germany) equipped with a silicon carbide Globar as IR source and an internal L-alanine doped deuterated triglycine sulfate (DLaTGS) single detector working at room temperature. The basic spectrometer was further equipped with a diamond ‘attenuated total reflectance’ (ATR) unit (‘Platinum-ATR-unit’, Bruker Optik GmbH) used for the direct sample by sample measurements of larger samples (particles >500 µm).
Coupled to this basic unit was a ‘Hyperion 3000’ (Bruker Optik GmbH) FTIR microscope with an automated xyz-stage. The automated stage facilitated the placement of a gold coated mirror for reflectance measurements or the insertion of round calcium fluoride (CaF2) sample filter plates (Korth Kristalle GmbH, Kiel, Germany) for transmittance measurements.
The FTIR microscope itself was equipped with a 15× IR objective lens (150× final magnification) and a 4× visual objective lens (40× final magnification) which were used during this study and furthermore a 20× micro-ATR objective (200× final magnification) is available for the microscope. The IR microscope was further equipped with a FPA detector with 64 × 64 detector elements cooled by liquid nitrogen used for the measurements.
Combined with the 15× IR objective lens the FPA facilitates the simultaneous measurement of 4096 spectra within a single measurement on an area of 170 × 170 µm, i.e. with a pixel resolution of 2.7 µm. However, it must be noted that the lateral resolution of micro-FTIR spectroscopy is physically limited (e.g. 10 µm at 1000 cm–1, Bruker Optik GmbH) because of the diffraction of IR radiation. By the assembly of subsequently acquired FPA measurements using the automated xyz-stage larger areas can be covered, which simultaneously involves the production of huge amounts of data.
To prevent interference with air humidity the whole FTIR system was flushed inside by dry air produced by a dry air generator (Model OF302-25+4MD3, JUN-AIR, Gast Manufacturing, Inc., Benton Harbor, MI, USA) at a flow rate of ~200 L h–1. The system was operated by the proprietary 32-bit software OPUS 7.2 (Bruker Optik GmbH) during measurements and analyses.
ATR measurements of reference material
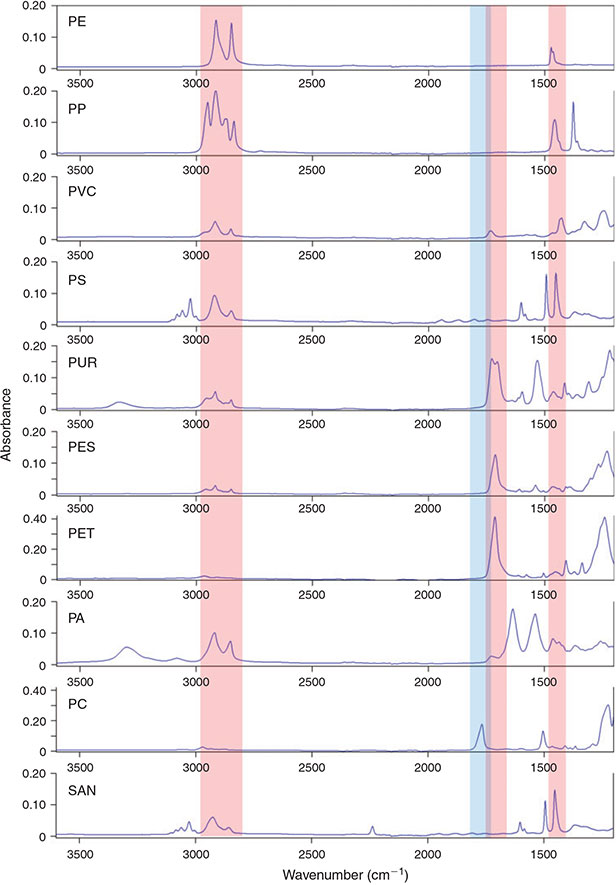
A polymer library was self-generated in OPUS 7.2 and served for comparison and identification of the polymer origin of potential microplastic particles according to their IR spectra. For creating this library the most commonly used consumer plastic polymers (pre-production pellets, powders and films: polyethylene (PE), polypropylene (PP), polyvinyl chloride (PVC), polystyrene (PS), polyethylene terephtalate (PET) and other polyesters (PES), polyamide (PA), polyurethane (PUR), styrene acrylonitrile (SAN), polycarbonate (PC) and others) were provided by different plastic polymer manufacturers and were measured using the ‘Platinum-ATR-unit’ (crystal: diamond, single reflection). IR spectra were recorded in the wavenumber rage 4000–400 cm–1 with a resolution of 4 cm–1 and 32 co-added scans. The background measurement against air was conducted with the same settings. The library currently consists of 128 plastic polymer records and several other marine abiotic and biotic materials (e.g. cellulose, quartz, chitin, silicate and keratin), and is available upon request.
Comparison of reflectance and transmittance measurements
In this preliminary experiment tests were performed to evaluate if reflectance or transmittance measurements were more appropriate for FPA-based micro-FTIR imaging of microplastic particles. We chose high-density PE particles (Schaetti Fix 1822/0-80, Schaetti AG, Wallisellen, Switzerland) with a particle size range of 0–80 µm as model microplastics. PE has the advantage that it has only three prominent band patterns within the investigated wavenumber range with peaks at 2915 (C–H, asymmetric stretch vibration), 2848 (C–H, symmetric stretch vibration) and 1471 cm–1 (C–H, bend vibration)[63,64] – due to the molecular composition of PE – mainly resulting from vibrations of the methylene (C–H2) and to a much lower extent the methyl (C–H3) group.
Prior to the measurements the sample was photo-documented with the 4× visual objective lens. Transmittance measurements of a small amount of the model microplastics were conducted on a round CaF2 sample carrier (13-mm diameter, 2-mm thickness) with the 15× IR objective lens, in the wavenumber rage 3800–900 cm–1 with a resolution of 8 cm–1 and 32 co-added scans (the FPA detector is limited to this wavenumber range). Sixteen FPA fields covering a total area of 680 × 680 µm2 were measured. The background was measured on the blank CaF2 sample carrier with the same settings.
Reflectance measurements were conducted on a gold coated mirror (Bruker Optik GmbH) with the same settings and the same measurement area as for the transmission measurements after a small amount of powder was added. The background was acquired on the blank gold coated mirror with the settings mentioned above. The signal-to-noise (S/N) ratio in the wavenumber range 2980–2780 cm–1 (C–H, stretch vibrations) was determined for both measurement modes with the software OPUS 7.2, where the effective noise was calculated with the root mean squares (RMS) method.
Test of appropriate filter material for FTIR measurements
Because microscopic microplastics in environmental samples need to be concentrated on filters, an appropriate filter material for FPA-based micro-FTIR imaging had to be found. The importance of appropriate filter material for obtaining high-quality results with minimum spectroscopic interference in the mid-IR region when analysing microplastic samples on filters has also been stressed by Vianello et al.[23]
For this purpose we tested the suitability of different filter materials (Table 1) for FPA-based micro-FTIR imaging by transmittance and reflectance measurements. Again, the PE model particles were used for the measurements and a small amount placed on each filter type. The measurement parameters were the same as described for the comparison between reflectance and transmittance mode. A piece of the respective filter was placed on a CaF2 sample carrier for transmittance measurements or on a gold coated mirror for reflectance measurements. Three measurements of a single FPA field (4096 spectra) were conducted in both modes. The first measurement was done to characterise the filter material and to reveal the IR transparency of the material in the range 3800–900 cm–1. As a prerequisite in order to allow for weaker signals of the sample being displayed in the measured IR spectra, the absorbance of the filter material had to be below 0.5 (empirical value) for transmittance micro-FTIR. The background was measured on the blank CaF2 sample carrier (transmittance mode) or the gold coated mirror (reflectance mode). The second measurement investigated if the IR bands of the PE particles placed on the filter were visible in addition to the IR signature of the filter material and thus again the blank CaF2 sample carrier or the gold coated mirror served for the background measurements. The third measurement aimed at revealing the IR bands of the PE particles only on the filter without the signal of the filter material and thus the blank filter was measured as background. Prior to the measurements a visual picture of the model microplastics on the filter or of the blank filter alone was taken with the visual objective lens. For comparison of the suitability of the filter types the spectral regions of 2980–2780 and 1480–1440 cm–1 corresponding to the C–H stretch and C–H bend peak regions of PE,[63,64] were chosen for chemical imaging. According to the results of the chemical imaging and the IR spectra of the samples, the filter types were assigned to the categories ‘suitable’ (clear imaging result and clear IR spectra) or ‘not suitable’ (weak or unclear imaging result and IR spectra) for FPA-based micro-FTIR imaging.

|
Optimisation of the measurement settings for micro-FTIR imaging of whole filters
The measurement of subsamples of a sample filter and the subsequent extrapolation of the values to the whole filter area always involves a bias resulting from the patchy settlement of the particles on the filter surface during filtration. Thus, the aim of this experiment was to adjust the settings of the FPA-based micro-FTIR imaging process in a way to facilitate the measurement of large sample areas, i.e. whole filter surfaces in one single measurement run. The measurement of large areas, however, involves the generation of a huge amount of data. In this context it must be noted that the control software OPUS 7.2 is 32-bit based and processing of data is thus limited to 10 gigabytes in total. Consequently, it was necessary to optimise the analyses in terms of lateral resolution, amount of data produced and duration of the measurements.
In this context several parameters were investigated in an iterative process for their potential to reduce data amount and measurement time as well as for their influence on the measurement quality and imaging results (if not stated otherwise a single FPA field absorbance measurement of PE powder on aluminium oxide filters in the wavenumber range 3600–1200 cm–1 with 32 co-added scans at a resolution of 8 cm–1 was conducted):
-
Recorded wavenumber range, i.e. the range in which IR spectra were measured – the optimum region for the investigation of plastic polymers in the range 3800–900 cm–1 was chosen;
-
resolution of the measurement, i.e. the wavenumber distance between a single data point of the IR spectrum – resolutions between 2 and 16 cm–1 were tested for their suitability to resolve IR spectra of microplastics;
-
binning, an option to reduce the data amount but also lateral resolution by pooling measured FPA detector-pixel quadrates together to one single pixel – 2 × 2, 4 × 4, 8 × 8 and 16 × 16 binning was investigated for its influence on the lateral resolution of the chemical images of microplastic samples. Binning of 2 × 2 for example co-adds the results of four FPA detector-pixels to a single new pixel, 4 × 4 co-adds the results of 16 FPA detector-pixels etc. With respect to the different binning options we also used the measurement software to read out the maximum number of sequential FPA fields that can be processed during a measurement and the time needed for the corresponding area when applying a scan number of 6 or 32 for the co-addition of IR spectra;
-
the number of scans co-added per measurement, which affect the S/N ratio of the measurements, was chosen in dependency of the optimum of the other parameters – 2, 4, 6, 8 and 10 scans per measurement were tested and with respect to the measurement time the lowest number of co-added scans with an appropriate S/N ratio was chosen.
-
For a proof of principle of this optimisation a small amount of the model PE powder was mixed with 0.2-µm filtered water and filtered onto an Anodisc 25 filter (Whatman, 0.2-µm pore size, 25-mm diameter, GE Healthcare, Chalfont St Giles, UK) using vacuum filtration and a funnel that concentrated the sample on a filter area of ~10.5-mm diameter. The sample was measured with the optimised measurement parameters by FPA-based micro-FTIR imaging after drying the filter for 3 h at 60 °C.
Development of a polymer identification scheme
Because of the extreme chemical heterogeneity of environmental samples, ‘non-microplastics’ might display IR bands also present in microplastics. Hence, for a clear differentiation, IR bands of the most common synthetic polymers were reviewed in a self-generated ATR-FTIR library and several IR bands were chosen that facilitate a pre-selection of potential microplastic particles by FTIR imaging on the sample filter. The visualisation of the intensity and location of these microplastic-characteristic IR bands should facilitate the check of the whole IR spectra at the marked areas for a verification of the plastic polymer origin of potential microplastic particles and the rejection of ‘non-microplastics’.
An experiment was carried out in order to evaluate the applicability of the optimised parameters for the measurement of microplastics of different polymers with FPA-based micro-FTIR imaging by application of the identification protocol. To do so, eight samples of different standard polymers (Table 2) were investigated consisting of commercially available powders or abrasion from consumer goods self-produced by use of a file. A small amount of each microplastic sample was manually placed on an Anodisc 25 filter (GE Healthcare) and an area of 20 FPA fields was measured with the optimised parameter settings.

|
Test of the protocol with environmental samples
FPA-based micro-FTIR imaging was conducted to test the applicability of the developed measurement and identification protocol on real environmental samples. As the aim of this study was to evaluate and optimise this measurement technique and not to report abundances of microplastics in the marine environment we show the results of two samples stemming from different matrices as examples.
Plankton
A plankton sample was taken in 2012 during a research cruise with the RV ‘Heincke’ at a North Sea station close to the coast of Denmark (station 12, 56°27.93′N, 07°44.43′E,) with a neuston catamaran equipped with a 300-µm net at a speed of ~1–2.1 m s–1 (2–4 kn). In total 146.9 m3 were sampled. The sample was transferred into a rinsed PVC bottle and stored frozen until further analysis. After thawing in the laboratory, the sample was screened over a 500-µm sieve and potential microplastics in the retained fraction analysed by ATR-FTIR after manual sorting under the microscope (results are not shown here). The filtrate containing the fraction <500 µm was purified by the help of a newly developed enzymatic purification protocol (Löder et al., unpubl. data) and finally concentrated on a circular area of 9.7 mm on an Anodisc 13 filter (Whatman, 0.2-µm pore size, 13-mm diameter). After drying at 60 °C the filter was measured by micro-FTIR and analysed for microplastics with the optimised measurement and identification protocol.
Sediment
A sediment sample was taken in 2013 during a research cruise with the RV ‘Heincke’ at a North Sea station close to the German island Amrum (station 18, 54°28.94′N, 8°5.41′E) with a Van Veen grab sampler. Sediment (1.6 kg) was sampled from the surface of the recovered sediment down to a depth of ~5 cm with a metal spoon, placed into a rinsed PVC bottle and stored frozen until further analysis. After thawing in the laboratory the sample was extracted with the Munich Plastic Sediment Separator as described by Imhof et al.[46] The extract was screened over a 500-µm sieve for the analysis of potential microplastics in the retained fraction by ATR-FTIR after manual sorting under the microscope (results are not shown here). The filtrate was processed and measured as described for the plankton sample after being concentrated on a circular area of 10.5 mm on an Anodisc 25 filter.
Results and discussion
Although two studies have applied micro-FTIR mapping for the identification of microplastics in environmental samples,[23,59] the present study is the first one that used FPA-based micro-FTIR imaging of microplastics in this field of research. The aim of this study was to develop a protocol for the measurement and analysis of microscopic plastic particles enriched on membrane filters. For this we conducted several experiments referring to measurement mode, appropriate filter material and measurement settings and developed an identification approach for the most common synthetic polymers by FPA-based micro-FTIR imaging that was finally successfully applied to environmental samples.
Comparison of reflectance and transmittance measurements
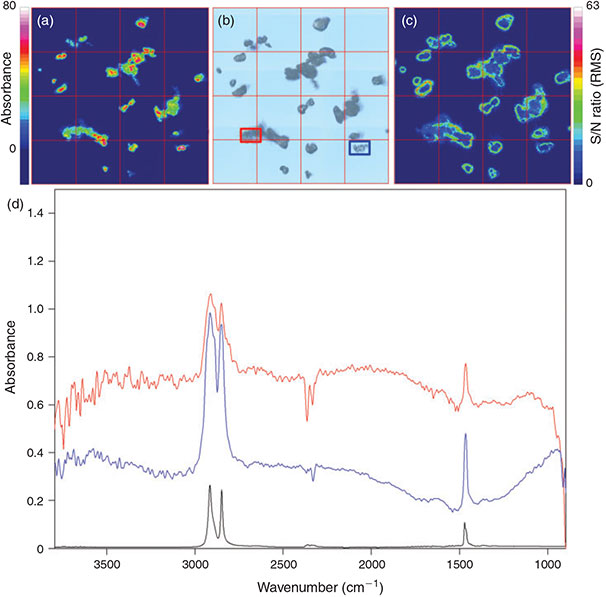
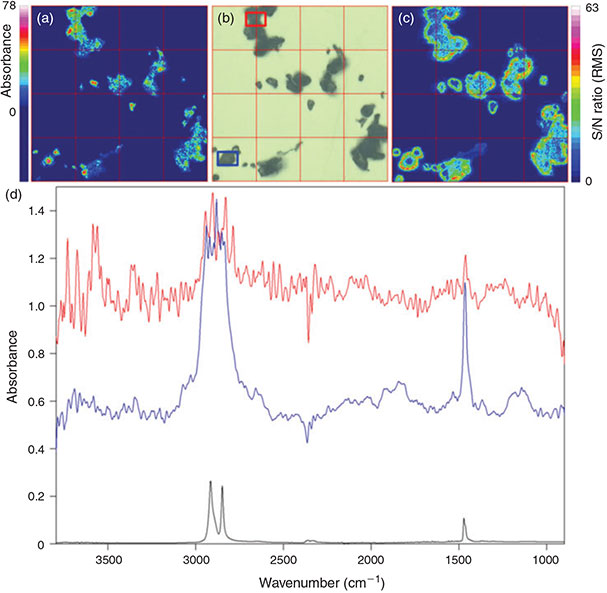
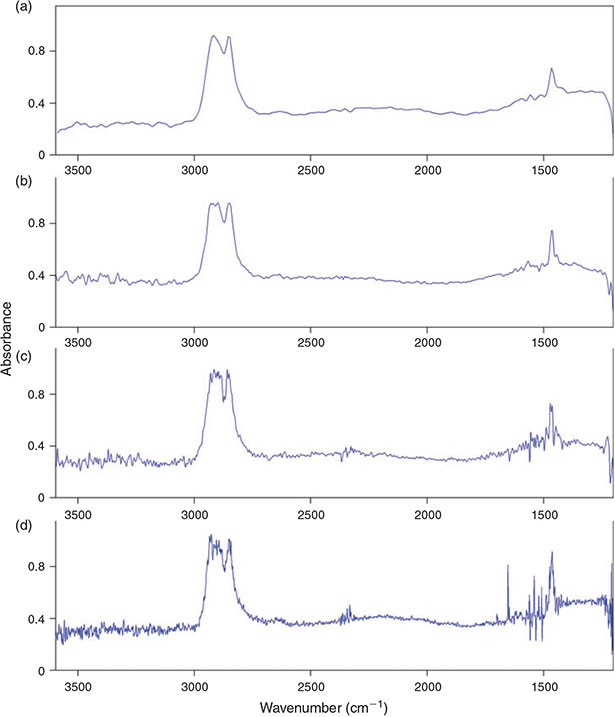
For the general comparison of the two available measurement modes chemical images of the intensity of the C–H stretch region (2980–2780 cm–1) for marking the PE powder in the measured filter area were created (Figs 1, 2). Although both modes facilitated the detection of all particles present in this area down to a size of 20 µm the measurement in transmittance yielded the better imaging result (compare Fig. 1). Because of higher intensities (visible in green to purple) in the integrated band region the particles were marked more clearly by chemical imaging after transmittance measurements and thus their shape and contour was depicted more precisely when compared to results from reflectance measurements. The imaging after reflectance measurement often resulted in medium to low intensities represented by blue to green colours for many parts of the surface of the investigated PE particles and only a few areas yielded a high intensity. This observation is attributable to the refractive error resulting from the superposition of directed and undirected reflection of the IR radiation by irregular shaped particle surfaces and has been reported before during the analysis of microplastics in environmental samples.[23,59] This fact results in a higher S/N ratio in reflectance measurements which can be seen by direct comparison of the S/N ratio in the integrated band region as shown in Fig. 1c, d and Fig. 2c, d.
|
|
Although reflectance micro-FTIR is most suitable for plane surfaces where refractive errors are low it has the great advantage that as a surface technique it is suited for the production of IR spectra of thick, opaque samples[65] and not subjected to total absorption which occurs – depending on the material – when measuring samples of a certain thickness with transmittance micro-FTIR spectroscopy. On the other hand the polymer origin of larger particles that show total absorbance during transmittance micro-FTIR measurements can be verified by micro-ATR spectroscopy. However, for qualitatively good results during reflectance measurements it is important to focus directly on the surface of each particle,[23] which is impossible during automated chemical imaging if particles of different size are present directly next to each other. Because both measuring modes have advantages and disadvantages we compared both modes during the test of appropriate filter material for micro-FTIR measurements.
Appropriate filter material for FTIR measurements
Ten different filter types (Table 1) were tested for their applicability for FPA-based miro-FTIR during this experiment, each type in reflectance and transmittance mode. The results are listed in Table 3. Eight of the filter types tested were not suitable for FPA-based micro-FTIR measurements of microplastics as their IR window range, i.e. IR transparency, was either too narrow or their IR characteristics led to high diffractive error (reflectance mode) or to absorbance values much higher than 0.5 both resulting in unclear IR spectra. The value of 0.5 – as an empirical value – was prior defined as a maximum acceptable absorbance offset by the filter material to also facilitate the measurement of weaker bands of microplastic samples.

|
Vianello et al.[23] tested different filter types for reflectance micro-FTIR mapping (i.e. polycarbonate membranes, cellulose ester-based filters, fibreglass filters) and reported a low quality of the spectroscopic results mainly because of interference caused by diffuse IR absorption from the filter matrices. Although the polycarbonate membranes and cellulose ester-based filters tested displayed plain and homogeneous surfaces, fibreglass filters were finally applied for the FTIR mapping study.[23]
However, in our study fibreglass filters were not suitable for FPA-based measurements. Only two of the filter types tested, the polycarbonate filter (Isopore Membrane Filter, 0.2 µm GTTP, Merck Millipore, Merck KGaA, Darmstadt, Germany) and the aluminium oxide filter (Anodisc 25, Whatman, GE Healthcare) showed good potential for chemical imaging of microplastics as tested with model PE particles by imaging of the C–H stretch (2980–2780 cm–1) and bend regions (1480–1440 cm–1) (Table 3). As already successfully applied during a previous chemical mapping study on microplastics[59] the polycarbonate filter was suitable for the chemical imaging of both investigated wavenumber regions and led to medium results in reflectance as well as good results in transmittance mode (Fig. 3a–f) for PE.

|
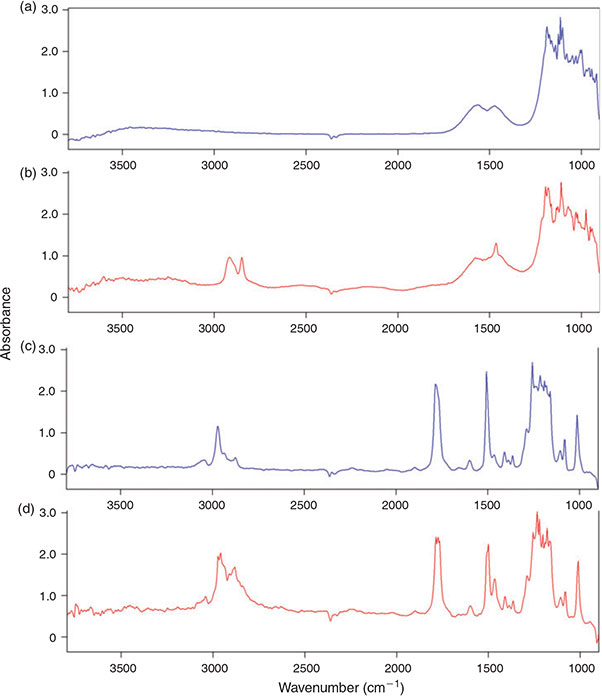
The aluminium oxide filter yielded good results in the transmittance mode (Fig. 3j–l) and even clearer imaging results in the region 2980–2780 cm–1 when compared to the polycarbonate filter (Fig. 3e, k), however, the C–H bend region (1480–1440 cm–1) could not be imaged in reflectance mode (Fig. 3i) with this filter type. This is because of the characteristic of the material which shows a doublet band absorbance pattern between 1620 and 1420 cm–1 (Fig. 4a). The characteristic does not play such a prominent role in transmittance mode as the C–H peak in the bend region of the PE sample is still visible on top of the IR spectrum of aluminium oxide (Fig. 4b).
|
Because the polycarbonate membrane itself has a characteristic ‘plastic’ IR spectrum, i.e. the investigated IR range (3800–900 cm–1) is interrupted by at least eight bands with an absorbance higher than 0.5 units, many bands of the filter interfere with IR bands of the most common synthetic polymers (Fig. 4c, d, compare also Fig. 10). Thus, it is not well suited for the analysis of microplastics, although PE particles could be visualised with this filter type by chemical imaging. By contrast, the fact that – except from the above-mentioned band region which interferes in reflectance mode – the aluminium oxide filter offered a good IR transparency down to a wavenumber of 1250 cm–1 led to the decision to use this type of filter for the subsequent experiments. Based on the better imaging and spectroscopic results of the transmittance measurements compared to reflectance mode (Fig. 3g–l) when using aluminium oxide filters we also decided to apply this mode for our subsequent experiments.
Optimised measurement settings for micro-FTIR imaging of whole filters
In order to facilitate the measurement of a large filter area with respect to the maximum data amount that can be processed by the FTIR system (10 gigabytes) and the time needed for the measurement (not exceeding one workday) we investigated the following parameters for the potential to reduce data amount and measurement time:
Recorded wavenumber range
The extent of the recorded wavenumber range, i.e. the spectroscopic information to be saved, has a large effect on the data amount produced. It has a smaller effect on the time needed for a measurement because of the fast FT postprocessing of the measured interferogram by the computer. Because the selected filter material aluminium oxide is IR intransparent below a wavenumber of 1200 cm–1 this value was chosen as the lower boundary for the measurement. The upper boundary of 3600 cm–1 was chosen because no mid-IR spectra of plastic polymers are to be expected above this value (Fig. 10). Consequently the wavenumber range 3600–1200 cm–1 was used during the further optimisation of the measurement parameters.
Resolution of the measurement
The spectral resolution of the measurement has a direct effect on the IR spectrum of the sample, the higher the resolution the better small IR bands are represented. We compared the spectrum quality as well as the time needed and the amount of data produced for the measurement of one FPA field with a resolution of 2, 4, 8 and 16 cm–1. As can be seen in Fig. 5a the time needed and amount of data produced for measuring one FPA field decreased strongly from 100 s and 45.3 MB at a resolution of 2 cm–1 to 56 s and 25.4 MB at 4 cm–1, 36 s and 15.4 MB at 8 cm–1 and to 26 s and 11.3 MB at 16 cm–1.
|
Although no obvious difference was visible during imaging of the C–H stretch region (2980–2780 cm–1) of PE for the four different resolutions, the comparison of the IR spectra of PE (Fig. 6) of the same particle resulting from the measurement with different revolutions revealed a relatively high noise in the spectra below a resolution of 8 cm–1. On the other hand a resolution of 16 cm–1 led to broader peaks and the risk of loss of small scale spectral information. Consequently we concluded that a resolution of 8 cm–1 yielded the best result in terms of quality and also an optimum with respect to data amount produced and time needed for the measurement. Harrison et al.[59] used a resolution of 4 cm–1 for the measurement of microplastic samples with reflectance micro-FTIR spectroscopy, however, the resolution of 8 cm–1 has also been used by Vianello et al.[23] in their study and proved the ability to resolve plastic polymer spectra in a proper way. Thus, this resolution was chosen for the subsequent optimisation process.
|
Binning
Binning is an option to pool several FPA detector-pixels together to a new single pixel thereby reducing the lateral resolution but also the data amount. This option (2 × 2, 4 × 4, 8 × 8 and 16 × 16 binning) was investigated for its influence on the lateral resolution of the chemical images of PE microplastic samples as well as on the data amount produced and time needed for measuring one FPA field, again to find the optimum between lateral resolution, data amount produced and time needed for a measurement. The measurement of one FPA field without binning took 36 s and produced 15.4 MB. Whereas a great difference to ‘no binning’ was recognisable (32 s and 7.5 MB at 2 × 2 binning, 31 s and 6.2 MB at 4 × 4 binning, 30 s and 5.2 MB at 8 × 8 binning and 30 s and 4.9 MB at 16 × 16 binning), the difference between the single binning options was not of such magnitude (Fig. 5b). In a second approach the maximum possible number of FPA detector fields when using the different binning options was investigated. According to the measurement software the maximum number of spectra that can be processed during one measurement was 3 936 256 (10 030 MB data). With the highest possible resolution (2.7-µm lateral pixel resolution), i.e. when no binning was applied, this corresponded to a maximum number of 961 FPA fields equalling a quadrate with an edge length of 5.27 mm. The corresponding measurement would take 353 min at a scan number of 6 and 793 min at a scan number of 32 co-added scans. The maximum number of FPA fields, which corresponds to the edge length of a quadrate, that can be measured increases by a factor of 4, in case of the edge length by a factor of 2, with each binning step when compared to no binning (2 × 2: 3844 fields, 10.54-mm edge length; 4 × 4: 15 376 fields, 21.08-mm edge length; 8 × 8: 61 504 fields, 42.16-mm edge length; 16 × 16: 246 016 fields, 84.32-mm edge length) and simultaneously the lateral pixel resolution decreases by a factor of 2 (2 × 2: 5.3 µm, 4 × 4: 10.6 µm, 8 × 8: 21.3 µm, 16 × 16: 42.5 µm). The time for the measurement for the maximum number of FPA fields assumed by the software logically increases with every binning step and ends at 16 × 16 binning with 34 651 min (24 days) at 6 scans or 147 317 min (102 days) at 32 scans when measuring 246 016 FPA fields virtually covering a quadrate with 84.32-mm edge length. This time demand shows that the sample area covered during a measurement should be as small as possible to reduce the measurement time. In terms of binning the quality of the lateral resolution, i.e. the minimum size of particles that can be recognised by chemical imaging, plays an important role. From a purely technical point of view – because of the diffraction of light – the FTIR system we used is able to resolve particles down to a size of 10 µm at a wavenumber of 1000 cm–1 (Bruker Optik GmbH). The comparison of the chemical images showed that the binning option 4 × 4 was able to mark PE particles down to a size between 15–20 µm (Fig. 7). With respect to the maximum area (see above) that can be measured with the different binning options and the time demand for the measurements we concluded that a lower threshold of 20 µm of particles that are definitely marked by chemical imaging would be justifiable. Thus, we decided to use the 4 × 4 binning option for the subsequent experiments.
|
Optimum number of scans co-added per measurement
Although the number of scans that are co-added per measurement has no effect on the data amount produced, it has a strong effect on the S/N ratio of the produced spectra and of course on the time needed for a measurement. Generally spoken, the higher the number of scans co-added per measurement the lower the noise in an IR spectrum. However, although the measurement time can be dramatically increased by a high number of co-added scans, the spectrum quality cannot. Thus, it should be considered that the positive effect of increasing the number of scans is limited (no infinite improvement) while it unnecessarily increases measurement time.[66] We investigated a scan number of 2, 4, 6, 8 and 10 scans for the co-addition for their effect on the quality of the produced IR spectra with the parameters chosen before (4 × 4 binning, 8 cm–1 resolution). Owing to the fact that as a consequence of 4 × 4 binning the IR spectra of 16 single FPA detector pixels are pooled together to a single new pixel, the IR spectrum of this new pixel contains the mean spectral information of 16 IR spectra. This pseudo co-addition of spectral information can improve the S/N ratio by up to ~45 %.[66] Bhargava et al.[66] found the S/N ratio for sampling co-addition to scale as ~N0.5 where N is the number of co-added pixels. In summary binning leads to an additional noise reduction and generally demands a lower scan number than a high resolved measurement for good spectroscopic results.
Our comparison of the scan numbers 2–10 (Fig. 8a–e) for 4 × 4 binning showed that there was no obvious improvement of the spectrum quality in terms of the visible noise in the IR spectra above a scan number of 6 and therefore this value was chosen with respect to the measurement time and an appropriate S/N ratio.
|
Proof of principle
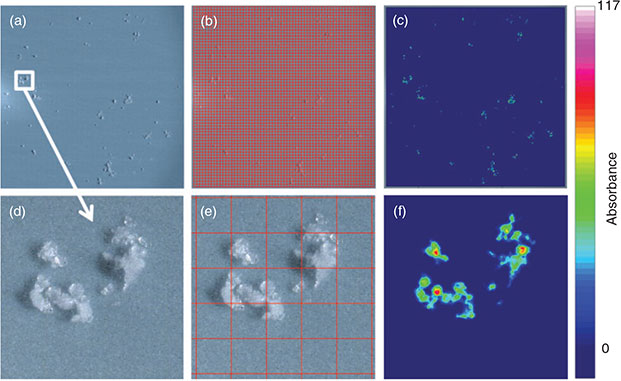
The measurement of the total filter surface is the only possibility to avoid bias introduced by the measurement of subsamples and the subsequent extrapolation to the whole sample area. According to the optimisation process for the measurement of large areas, i.e. whole filters, the measurement of 6 co-added scans at a resolution of 8 cm–1 with 4 × 4 binning in the range 3600–1200 cm–1 represented the optimum with respect to spectrum quality, time needed for a measurement and data amount produced. For a proof of principle the model PE powder was filtered on an Anodisc 25 filter and thereby concentrated on a circular area of ~11-mm diameter (Fig. 9a). The quadratic area covered by 3844 FPA (Fig. 9b) detector fields (62 × 62 FPA fields, edge length 10.54 mm, 984 064 spectra) was successfully measured during 10.75 h and yielded a measurement file of 2572 MB. Comparing the microscopic images (Fig. 9a, d) with the chemical imaging of the C–H stretch region (2980–2780 cm–1) (Fig. 9c, f) revealed that particles down to a size of at least 20 µm were successfully marked by chemical imaging. This proof of principle with PE powder is the first successful report of FPA-based micro-FTIR imaging of microplastics on a whole filter surface. In order to identify other plastic polymers with the operation protocol, an identification scheme had to be developed. Thus, in a further approach the measurement of microplastics of the most important plastic polymers with the optimised parameters and the subsequent chemical imaging according to common plastic characteristic band patterns were evaluated for their feasibility.
|
Development of an identification approach for different polymers by FPA-based micro-FTIR imaging
Based on the European demand in 2012 the most important polymers are PE (29.5 %), PP (18.8 %), PVC (10.7 %), PS (7.4 %), PUR (7.3 %) and PET (6.5 %). The remaining 20 % of industrially important polymers mainly consist of other polyesters and PA, whereas polymers like SAN and PC are of minor importance.[67]
The revision of the IR bands of these common plastic polymers in the self-generated plastic polymer ATR-FTIR library revealed that three band regions are necessary for marking potential plastic particles of the eight most important polymers by chemical imaging (Table 4, Fig. 10). For also marking the relatively unimportant PC a fourth integration step would be necessary (Table 4, Fig. 10). The defined band regions cover C–H vibrations, aromatic ring vibrations (Band region I, III) and carbonyl vibrations (Band region II, IV).[63,64]
|

|
The integration of these band regions should facilitate a visible pre-selection of potential microplastic particles by FTIR imaging on sample filters. In order to evaluate this identification approach in tandem with the optimised measurement settings eight different important plastic polymers were tested (Table 2).
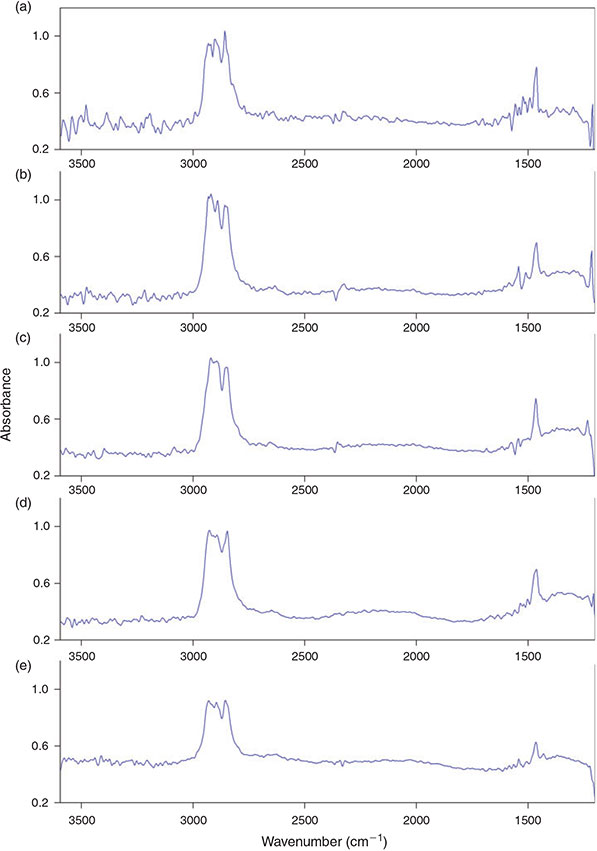
The chemical imaging of all the different polymer samples was successful when applying the identification scheme. However, not every polymer sample included particles or structures down to a size of 20 µm which was the minimum size threshold as found for the model PE powder for chemical imaging during the parameter optimisation process. The smallest particles or structures present and successfully measured were between 17–36 µm depending on the polymer (Table 2). However, the smallest particle, apart from very small particles <5 µm, in the PA sample was 16 µm and in the PUR sample 14 µm and in both cases these particles could not be marked following the identification scheme, which suggests that the size threshold of 20 µm as a consequence of the chosen measurement parameters found for PE also holds true for other polymers.
In this context – besides the lateral restriction resulting from binning – it has to be stated that in transmittance mode the particle thickness plays an important role for good spectroscopic results. Thereby very thick samples can lead to un-interpretable results because of total absorbance – a solution is to measure these particles subsequent to the imaging by micro-ATR-FTIR as suggested by Vianello et al.[23] On the contrary, samples that are too thin (below ~5 µm) do not yield enough absorbance for interpretable spectra. However, these restrictions cannot be generalised and differ from polymer to polymer.
Because other particles present in environmental samples harbor IR bands that are also present in plastic polymers, the developed identification scheme is an approach to mark potential microplastics. A clear differentiation between microplastics and non-microplastics is only possible after reviewing the IR spectra of the pre-selected potential microplastic particles and if necessary compare them to a spectroscopic library.
Test with environmental samples
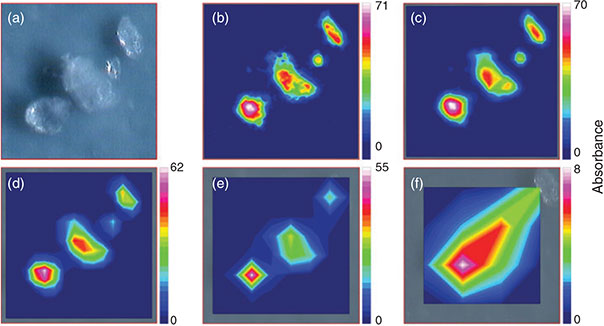
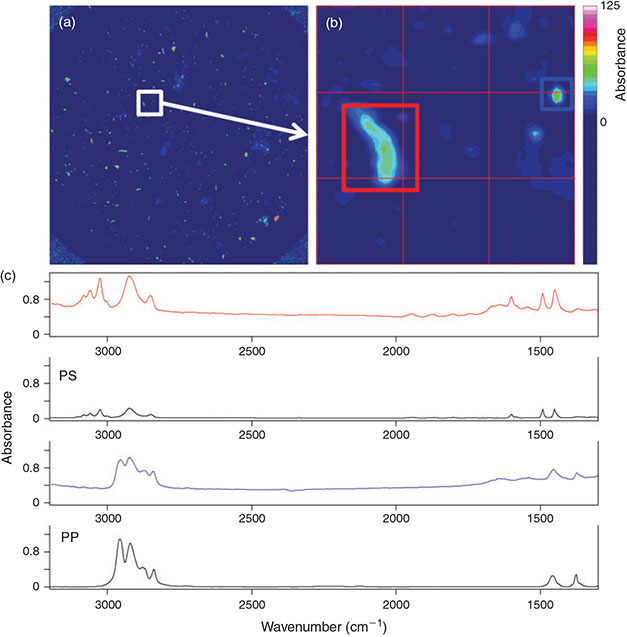
The optimised measurement protocol combined with the identification scheme was applied for the analysis of North Sea plankton and sediment samples with respect to microplastics (Figs 11, 12). In both samples microplastics of different polymers were detected. The sediment sample consisting of very fine sand contained 64 microplastics kg–1 sediment (dry weight) out of six different polymers comprising PP, PE, PVC, PS, polymethyl methacrylate (PMMA) and ethylene vinyl acetate (EVA). The abundance of microplastics in the plankton sample was 0.19 items m–3 for five different polymers: PP, PE, PS, PA and PUR.

|
|
Although comparability between studies is difficult because of the various methods applied and the report of the results in different units,[16] the abundances we detected were similar to results reported in the literature.
Information on microplastics in subtidal sediments of the North Sea generated with similar methods is rare. Claessens et al.[21] applied FTIR spectroscopy of visual pre-sorted microplastics >38 µm and found 72–270 items kg–1 sediment (dry weight) in subtidal sediments off the Belgian coast. They also found a similar polymer composition as we did in this study. However, another study reported between 3600 and 13 600 granular microplastics kg–1 sediment (dry weight) for North Sea tidal flat sediment.[50] These extremely high numbers were generated by visual identification under the microscope alone and were not verified by further techniques, which make them not really comparable with data generated by spectroscopic methods. Furthermore, data generated by visual identification generally lack the information on polymer composition of a sample.
Up to date no reliable information, e.g. generated by spectroscopic methods, on the abundance of microplastics in water samples in the German Bight, North Sea, is available. The abundance we report here (0.19 items m–3) is in the lower range reported for different oceanic regions in a review by Hidalgo-Ruz et al.[16] A study in the Jade Bay system reported a mean number of 64 000 granular microplastic particles m–3 (maximum 1.77 million m–3).[53] In this study water samples were directly filtered onto 1.2-µm filters and visually analysed. The extreme difference to our data can be a result of the different filtration (1.2 v. 300 µm); however, the fact that no further chemical verification of the polymer origin has been conducted has to be noticed. Noren[51] also identified microplastics visually and reported 0.01–0.14 particles m–3 seawater in Danish coastal waters when using a 450-μm net for the collection of microplastics. Although our result reaches the same scale, our samples were concentrated on a 300-µm net and are thus not directly comparable to the study of Noren.[51] This again shows the urgent need for a standardised protocol for microplastic sampling and analysis as already claimed by Hidalgo-Ruz et al.,[16] especially with respect to the un-comparability of data. Although first attempts have been made,[17] up to date no standard protocols are available. The integration of high-throughput techniques like FPA-based micro-FTIR imaging in such a protocol would also ensure the generation of reliable data.
Techniques for microplastic identification – current development and outlook
Visual sorting is, according to a review by Hidalgo-Ruz et al.,[16] an obligatory step for the identification of microplastics in environmental samples. However, especially for small microplastics – regardless of whether a size below 1 mm or 500 µm is chosen for this size category – it is highly recommended to analyse pre-sorted particles with techniques that allow for a proper identification.[16,56] One fundamental drawback of visual sorting is the size limitation, i.e. particles smaller then a certain size cannot be sorted out, as they are unmanageable because of their minuteness and they can only be called ‘potential’ microplastics as a definite analysis of polymer origin is not possible with visual identification alone. As particles become even smaller they cannot be discriminated visually from other material or be recognised even under the microscope. Thus visual identification can include an error rate ranging from 20[54] to 70 %[16] which increases with decreasing particle size. In particular microscopic particles that need to be concentrated on filters are prone to misidentification: a case study which re-analysed visually identified microplastic particles extracted from North Sea beach and sediment samples found that only 1.4 % of the ‘microplastics’ were of plastic polymer origin – the great majority (almost 80 %) were quartz particles.[55] The latter example illustrates the urgent need for a verification of the polymer origin during microplastic analysis.
More reliable techniques are those that used the repetitive fingerprint-like molecular composition of plastic polymers for a clear assignment of a sample to a certain polymer origin like pyrolysis GC-MS, Raman or FTIR spectroscopy.
Pyrolysis GC-MS[47,57] facilitates the assignment of potential microplastics to polymer type, however, it has the disadvantage that particles have to be sorted out visually beforehand. This again results in a downward size limit of particles that can be analysed. Furthermore, the technique is not suitable for processing large amounts of samples which are collected during sampling campaigns or routine monitoring programs as it allows the analysis of only one particle per run. Pyrolysis GC-MS approaches for analysing bulk samples concentrated on filters are currently under development and potentially facilitate the analysis of smaller microplastics in environmental samples.
Although Raman or FTIR spectroscopy are frequently applied during the analysis of microplastics only two studies[23,59] used micro-FTIR chemical mapping[62] during the analysis of microplastics. This point by point procedure is still extremely time-consuming when targeting the whole sample filter surface at a high spatial resolution because it uses only a single detector element.[23,59] Because of this chemical mapping realistically allows for the analysis of subsamples of the filter surface only, and involves an extrapolation of the results to the real sample size afterwards. Results of this extrapolation are prone to potential bias as a consequence of an unequal particle distribution on the filter.
Chemical imaging,[62] i.e. the simultaneous recording of several thousand spectra within one single measurement, facilitates a much faster generation of chemical maps. This can be realised by the use of micro-spectroscopy combined with FPA detectors (micro-FTIR, this study) or ultrafast electron multiplying charge coupled device (EMCCD, Raman micro-spectroscopy) detectors and allows for the fast acquisition of chemical images. By the sequential and automated measurement of FPA fields whole sample filters can be analysed for microplastics by chemical imaging.
However, before our study the applicability of FPA-based micro-FTIR imaging with a high spatial resolution has not yet been demonstrated in the field of microplastic research. After the optimisation of the measurement parameters and the development of an identification scheme our study was the first proof that FPA-based micro-FTIR imaging has the potential to be used as standard for the detection of microplastics in environmental samples on large sample surfaces. With our approach the verification of plastic polymer particles down to a size of 20 µm is possible. Another great advantage is that by measuring whole filter surfaces the above-mentioned bias resulting from the analysis of sub-areas of a filter is circumvented. Thus, with our method the generation of un-biased reliable data on microplastics in environmental samples is possible.
However, the time needed and the amount of data generated for the measurement of a whole filter surface (10.75 h and 2572 MB) is still a drawback from the viewpoint of developing a high-throughput SOP for the analysis of microplastics with chemical imaging. This is a fact that after our own search also holds true for micro-Raman imaging. Because our optimisation approach accounted for every possible adjustment the time requirement and data amount cannot be diminished significantly. Even the application of a lower lateral resolution, i.e. a higher binning option, which would decrease the minimum particle size that could be identified, does not lead to a significant decrease in time requirement and data amount (compare Fig. 5b).
The only reasonable possible solution to decrease time requirement and data amount would be a reduction of the measurement area (which was not large in this study: ~11-mm diameter). This could be achieved by the concentration of the sample on an even smaller filter area, with the imperative requirement for a very good purification of the microplastic sample from the corresponding environmental matrix. Another solution would be the measurement of subsamples of the filter area with FPA-based micro-FTIR imaging in only a fragment of time compared to chemical mapping.[23,59] This, however, involves the bias resulting from the unequal distribution of particles on the filter surface. In such a case the potential error rate should be quantified during investigations and methodological measures should be adopted to ensure that the distribution of particles on the filter surface is as homogeneous as possible. The chemical imaging of microplastic filters faces an unfavourable target/not target ratio. Thus, the most promising approach for an effective reduction of measurement area is to measure only the potential targets, i.e. the development of a reliable automated particle identification approach. The automated measurement of FPA-fields only at the location on the filter where potential particles have been identified should save a lot of time and data. This could potentially allow for a measurement without binning, a higher lateral resolution and thus the detection of even smaller microplastics.
Although the methodology we present here has a great potential to be implemented in a SOP for microplastic analysis of environmental samples, we showed that further improvements are possible and need to be investigated: In combination with an automated particle identification and measurement, an automated evaluation of the resulting spectra would facilitate the even faster and fully automated analysis of microplastic samples as needed during detailed monitoring studies.
Acknowledgements
The authors thank the German Federal Ministry of Education and Research (BMBF) and the Alfred Wegener Institute – Helmholtz Centre for Polar and Marine Research (AWI) for funding the project MICROPLAST. Furthermore, they thank several polymer manufacturers of plastic polymers (Schaetti AG, Betec Beschichtungstechnik GmbH, BASF, Bayer AG) for providing microplastic samples.
References
[1] R. C. Thompson, S. H. Swan, C. J. Moore, F. S. vom Saal, Our plastic age. Phil. Trans. R. Soc. B 2009, 364, 1973.| Our plastic age.Crossref | GoogleScholarGoogle Scholar | 19528049PubMed |
[2] D. W. Laist, Overview of the biological effects of lost and discarded plastic debris in the marine environment. Mar. Pollut. Bull. 1987, 18, 319.
| Overview of the biological effects of lost and discarded plastic debris in the marine environment.Crossref | GoogleScholarGoogle Scholar |
[3] M. Cole, P. Lindeque, C. Halsband, T. S. Galloway, Microplastics as contaminants in the marine environment: A review. Mar. Pollut. Bull. 2011, 62, 2588.
| Microplastics as contaminants in the marine environment: A review.Crossref | GoogleScholarGoogle Scholar | 1:CAS:528:DC%2BC3MXhsV2gsrfM&md5=fcc64c8a0c712ffd04c42c522f208e69CAS | 22001295PubMed |
[4] S. L. Wright, R. C. Thompson, T. S. Galloway, The physical impacts of microplastics on marine organisms: A review. Environ. Pollut. 2013, 178, 483.
| The physical impacts of microplastics on marine organisms: A review.Crossref | GoogleScholarGoogle Scholar | 1:CAS:528:DC%2BC3sXltVCrtLc%3D&md5=e8d21e474857816bde6b082a00007f7bCAS | 23545014PubMed |
[5] A. T. Pruter, Sources, quantities and distribution of persistent plastics in the marine environment. Mar. Pollut. Bull. 1987, 18, 305.
| Sources, quantities and distribution of persistent plastics in the marine environment.Crossref | GoogleScholarGoogle Scholar | 1:CAS:528:DyaL2sXlvVaqs7w%3D&md5=224467a56ce2c1d8503323cdf4d5084eCAS |
[6] A. L. Andrady, Microplastics in the marine environment. Mar. Pollut. Bull. 2011, 62, 1596.
| Microplastics in the marine environment.Crossref | GoogleScholarGoogle Scholar | 1:CAS:528:DC%2BC3MXovFKrt74%3D&md5=023b7d5ac18234cb7abff5171550439aCAS | 21742351PubMed |
[7] D. K. Barnes, F. Galgani, R. C. Thompson, M. Barlaz, Accumulation and fragmentation of plastic debris in global environments. Phil. Trans. R. Soc. B 2009, 364, 1985.
| Accumulation and fragmentation of plastic debris in global environments.Crossref | GoogleScholarGoogle Scholar | 1:CAS:528:DC%2BD1MXpt1Skt7w%3D&md5=c29927e7454ccee2ea68a6c4ffedea9bCAS | 19528051PubMed |
[8] J. G. B. Derraik, The pollution of the marine environment by plastic debris: a review. Mar. Pollut. Bull. 2002, 44, 842.
| The pollution of the marine environment by plastic debris: a review.Crossref | GoogleScholarGoogle Scholar | 1:CAS:528:DC%2BD38XmvVWns78%3D&md5=757914de79ed2efe1b2b0e3debf4df61CAS |
[9] M. A. Browne, P. Crump, S. J. Niven, E. Teuten, A. Tonkin, T. S. Galloway, R. C. Thompson, Accumulation of microplastic on shorelines woldwide: sources and sinks. Environ. Sci. Technol. 2011, 45, 9175.
| Accumulation of microplastic on shorelines woldwide: sources and sinks.Crossref | GoogleScholarGoogle Scholar | 1:CAS:528:DC%2BC3MXht1Gks7bN&md5=0004f85a816e01343ea841b1c13ca432CAS | 21894925PubMed |
[10] S. B. Sheavly, K. M. Register, Marine debris & plastics: environmental concerns, sources, impacts and solutions. J. Polym. Environ. 2007, 15, 301.
| Marine debris & plastics: environmental concerns, sources, impacts and solutions.Crossref | GoogleScholarGoogle Scholar | 1:CAS:528:DC%2BD1cXjslyqu7k%3D&md5=e0601c3287190235118b6621d380c697CAS |
[11] I. A. Hinojosa, M. Thiel, Floating marine debris in fjords, gulfs and channels of southern Chile. Mar. Pollut. Bull. 2009, 58, 341.
| Floating marine debris in fjords, gulfs and channels of southern Chile.Crossref | GoogleScholarGoogle Scholar | 1:CAS:528:DC%2BD1MXisFaisbk%3D&md5=334b4c082a9ebb0f46c3aebbe578d841CAS | 19124136PubMed |
[12] C. A. Ribic, S. B. Sheavly, D. J. Rugg, E. S. Erdmann, Trends and drivers of marine debris on the Atlantic coast of the United States 1997–2007. Mar. Pollut. Bull. 2010, 60, 1231.
| Trends and drivers of marine debris on the Atlantic coast of the United States 1997–2007.Crossref | GoogleScholarGoogle Scholar | 1:CAS:528:DC%2BC3cXpvFSms74%3D&md5=e7dbd6e1e6870f253a088f07c3a3067aCAS | 20378132PubMed |
[13] R. C. Thompson, Y. Olsen, R. P. Mitchell, A. Davis, S. J. Rowland, A. W. G. John, D. McGonigle, A. E. Russell, Lost at sea: where is all the plastic? Science 2004, 304, 838.
| Lost at sea: where is all the plastic?Crossref | GoogleScholarGoogle Scholar | 1:CAS:528:DC%2BD2cXjvVSntbg%3D&md5=155a0087d37591eee7bfac1da847674bCAS | 15131299PubMed |
[14] J. B. Colton, F. D. Knapp, B. R. Burns, Plastic particles in surface waters of Northwestern Atlantic. Science 1974, 185, 491.
| Plastic particles in surface waters of Northwestern Atlantic.Crossref | GoogleScholarGoogle Scholar | 17830390PubMed |
[15] M. R. Gregory, Accumulation and distribution of virgin plastic granules on New Zealand beaches. N. Z. J. Mar. Freshw. Res. 1978, 12, 399.
| Accumulation and distribution of virgin plastic granules on New Zealand beaches.Crossref | GoogleScholarGoogle Scholar |
[16] V. Hidalgo-Ruz, L. Gutow, R. C. Thompson, M. Thiel, Microplastics in the marine environment: a review of the methods used for identification and quantification. Environ. Sci. Technol. 2012, 46, 3060.
| Microplastics in the marine environment: a review of the methods used for identification and quantification.Crossref | GoogleScholarGoogle Scholar | 1:CAS:528:DC%2BC38XitVGhurY%3D&md5=2acb9685cd991453468574d7dc04148eCAS | 22321064PubMed |
[17] F. Galgani, G. Hanke, S. Werner, L. Oosterbaan, P. Nilsson, D. Fleet, S. Kinsey, R. C. Thompson, J. A. van Franeker, T. Vlachogianni, M. Scoullos, J. M. Veiga, A. Palatinus, M. Matiddi, T. Maes, S. Korpinen, A. Budziak, H. Leslie, J. Gago, G. Liebezeit, Guidance on Monitoring of Marine Litter in European Seas. EUR – Scientific and Technical Research series, European Commission, EUR 26113 EN 2013 (Joint Research Centre, Institute for Environment and Sustainability, Publications Office of the European Union: Luxembourg)
[18] M. A. Browne, T. S. Galloway, R. C. Thompson, Spatial patterns of plastic debris along estuarine shorelines. Environ. Sci. Technol. 2010, 44, 3404.
| Spatial patterns of plastic debris along estuarine shorelines.Crossref | GoogleScholarGoogle Scholar | 1:CAS:528:DC%2BC3cXktlyjtb4%3D&md5=6c6adb982561be02195c26f040eba178CAS | 20377170PubMed |
[19] V. Hidalgo-Ruz, M. Thiel, Distribution and abundance of small plastic debris on beaches in the SE Pacific (Chile): A study supported by a citizen science project. Mar. Environ. Res. 2013, 87–88, 12.
| Distribution and abundance of small plastic debris on beaches in the SE Pacific (Chile): A study supported by a citizen science project.Crossref | GoogleScholarGoogle Scholar | 23541391PubMed |
[20] K. L. Ng, J. P. Obbard, Prevalence of microplastics in Singapore’s coastal marine environment. Mar. Pollut. Bull. 2006, 52, 761.
| Prevalence of microplastics in Singapore’s coastal marine environment.Crossref | GoogleScholarGoogle Scholar | 1:CAS:528:DC%2BD28Xns1KhsLw%3D&md5=5ba4d3b8f3ecd9529cd981403989c47aCAS | 16388828PubMed |
[21] M. Claessens, S. De Meester, L. Van Landuyt, K. De Clerck, C. R. Janssen, Occurrence and distribution of microplastics in marine sediments along the Belgian coast. Mar. Pollut. Bull. 2011, 62, 2199.
| Occurrence and distribution of microplastics in marine sediments along the Belgian coast.Crossref | GoogleScholarGoogle Scholar | 1:CAS:528:DC%2BC3MXht1ajt7jF&md5=edeae5137c179ce9b5ad26009fc27ca5CAS | 21802098PubMed |
[22] L. Van Cauwenberghe, A. Vanreusel, J. Mees, C. R. Janssen, Microplastic pollution in deep-sea sediments. Environ. Pollut. 2013, 182, 495.
| Microplastic pollution in deep-sea sediments.Crossref | GoogleScholarGoogle Scholar | 1:CAS:528:DC%2BC3sXhsVejurbN&md5=fcbe5832343a67e12a491ee56c24eb7aCAS | 24035457PubMed |
[23] A. Vianello, A. Boldrin, P. Guerriero, V. Moschino, R. Rella, A. Sturaro, L. Da Ros, Microplastic particles in sediments of Lagoon of Venice, Italy: First observations on occurrence, spatial patterns and identification. Estuar. Coast. Shelf Sci. 2013, 130, 54.
| Microplastic particles in sediments of Lagoon of Venice, Italy: First observations on occurrence, spatial patterns and identification.Crossref | GoogleScholarGoogle Scholar | 1:CAS:528:DC%2BC3sXmt1Cmtrk%3D&md5=5beb1db8bfbf0b781d73c7228555c8fbCAS |
[24] E. J. Carpenter, S. J. Anderson, G. R. Harvey, H. P. Miklas, B. B. Peck, Polystyrene spherules in coastal waters. Science 1972, 178, 749.
| Polystyrene spherules in coastal waters.Crossref | GoogleScholarGoogle Scholar | 1:CAS:528:DyaE3sXkslGjsQ%3D%3D&md5=c89e0dc0d37775628878a6476877a376CAS | 4628343PubMed |
[25] E. J. Carpenter, K. L. Smith, Plastics on the Sargasso sea surface. Science 1972, 175, 1240.
| Plastics on the Sargasso sea surface.Crossref | GoogleScholarGoogle Scholar | 1:STN:280:DyaE387hvVaqsQ%3D%3D&md5=9d232b4421a4163cd798f076fbe3e0c6CAS | 5061243PubMed |
[26] M. R. Gregory, Virgin plastic granules on some beaches of Eastern Canada and Bermuda. Mar. Environ. Res. 1983, 10, 73.
| Virgin plastic granules on some beaches of Eastern Canada and Bermuda.Crossref | GoogleScholarGoogle Scholar |
[27] M. Cole, P. Lindeque, E. Fileman, C. Halsband, R. Goodhead, J. Moger, T. S. Galloway, Microplastic ingestion by zooplankton. Environ. Sci. Technol. 2013, 47, 6646.
| 1:CAS:528:DC%2BC3sXnvFSksr8%3D&md5=6fe9104bd1a81bbf892da06eee83264cCAS | 23692270PubMed |
[28] A. Ugolini, G. Ungherese, M. Ciofini, A. Lapucci, M. Camaiti, Microplastic debris in sandhoppers. Estuar. Coast. Shelf Sci. 2013, 129, 19.
| Microplastic debris in sandhoppers.Crossref | GoogleScholarGoogle Scholar | 1:CAS:528:DC%2BC3sXhtVensLjE&md5=a18f2507bd97742a943384ec7e2907a3CAS |
[29] E. M. Foekema, C. De Gruijter, M. T. Mergia, J. A. van Franeker, A. J. Murk, A. A. Koelmans, Plastic in North Sea fish. Environ. Sci. Technol. 2013, 47, 8818.
| 1:CAS:528:DC%2BC3sXps1yhsb0%3D&md5=fcb9a4d4561b44e6f65a57b208b3a4c8CAS | 23777286PubMed |
[30] F. Murray, P. R. Cowie, Plastic contamination in the decapod crustacean Nephrops norvegicus (Linnaeus, 1758). Mar. Pollut. Bull. 2011, 62, 1207.
| Plastic contamination in the decapod crustacean Nephrops norvegicus (Linnaeus, 1758).Crossref | GoogleScholarGoogle Scholar | 1:CAS:528:DC%2BC3MXnsVCntrs%3D&md5=eef311478031c1d495d9cc287e02f9b3CAS | 21497854PubMed |
[31] M. A. Browne, A. Dissanayake, T. S. Galloway, D. M. Lowe, R. C. Thompson, Ingested microscopic plastic translocates to the circulatory system of the mussel, Mytilus edulis (L.). Environ. Sci. Technol. 2008, 42, 5026.
| Ingested microscopic plastic translocates to the circulatory system of the mussel, Mytilus edulis (L.).Crossref | GoogleScholarGoogle Scholar | 1:CAS:528:DC%2BD1cXmsVKhtb8%3D&md5=b4626ca3c3e4bda09b7035ddf2d396e4CAS | 18678044PubMed |
[32] A. Bakir, S. J. Rowland, R. C. Thompson, Competitive sorption of persistent organic pollutants onto microplastics in the marine environment. Mar. Pollut. Bull. 2012, 64, 2782.
| Competitive sorption of persistent organic pollutants onto microplastics in the marine environment.Crossref | GoogleScholarGoogle Scholar | 1:CAS:528:DC%2BC38Xhslagtr%2FI&md5=9d34d8ebd067be58ea09404d4848f460CAS | 23044032PubMed |
[33] R. E. Engler, The complex interaction between marine debris and toxic chemicals in the ocean. Environ. Sci. Technol. 2012, 46, 12302.
| The complex interaction between marine debris and toxic chemicals in the ocean.Crossref | GoogleScholarGoogle Scholar | 1:CAS:528:DC%2BC38XhsFClsLfN&md5=b48fb4fb09eeead1ccf2315489220d5aCAS | 23088563PubMed |
[34] L. M. Rios, C. Moore, P. R. Jones, Persistent organic pollutants carried by synthetic polymers in the ocean environment. Mar. Pollut. Bull. 2007, 54, 1230.
| Persistent organic pollutants carried by synthetic polymers in the ocean environment.Crossref | GoogleScholarGoogle Scholar | 1:CAS:528:DC%2BD2sXotlKju7w%3D&md5=eebee4c97581a575c19b9eb95bc4845fCAS | 17532349PubMed |
[35] E. L. Teuten, J. M. Saquing, D. R. Knappe, M. A. Barlaz, S. Jonsson, A. Bjorn, S. J. Rowland, R. C. Thompson, T. S. Galloway, R. Yamashita, D. Ochi, Y. Watanuki, C. Moore, P. H. Viet, T. S. Tana, M. Prudente, R. Boonyatumanond, M. P. Zakaria, K. Akkhavong, Y. Ogata, H. Hirai, S. Iwasa, K. Mizukawa, Y. Hagino, A. Imamura, M. Saha, H. Takada, Transport and release of chemicals from plastics to the environment and to wildlife. Phil. Trans. R. Soc. B 2009, 364, 2027
[36] C. M. Rochman, E. Hoh, T. Kurobe, S. J. Teh, Ingested plastic transfers hazardous chemicals to fish and induces hepatic stress. Sci. Rep. 2013, 3, 3263.
| Ingested plastic transfers hazardous chemicals to fish and induces hepatic stress.Crossref | GoogleScholarGoogle Scholar | 24263561PubMed |
[37] E. Besseling, A. Wegner, E. M. Foekema, M. J. van den Heuvel-Greve, A. A. Koelmans, Effects of microplastic on fitness and PCB bioaccumulation by the lugworm Arenicola marina (L.). Environ. Sci. Technol. 2013, 47, 593.
| Effects of microplastic on fitness and PCB bioaccumulation by the lugworm Arenicola marina (L.).Crossref | GoogleScholarGoogle Scholar | 1:CAS:528:DC%2BC38XhslaksL%2FK&md5=3c79c26259181e576f0d50d0f7941b48CAS | 23181424PubMed |
[38] Y. Mato, T. Isobe, H. Takada, H. Kanehiro, C. Ohtake, T. Kaminuma, Plastic resin pellets as a transport medium for toxic chemicals in the marine environment. Environ. Sci. Technol. 2001, 35, 318.
| Plastic resin pellets as a transport medium for toxic chemicals in the marine environment.Crossref | GoogleScholarGoogle Scholar | 1:CAS:528:DC%2BD3cXosFyqt70%3D&md5=1f1dfc41306b8562a15cac65ed97b43aCAS | 11347604PubMed |
[39] T. Gouin, N. Roche, R. Lohmann, G. Hodges, A thermodynamic approach for assessing the environmental exposure of chemicals absorbed to microplastic. Environ. Sci. Technol. 2011, 45, 1466.
| A thermodynamic approach for assessing the environmental exposure of chemicals absorbed to microplastic.Crossref | GoogleScholarGoogle Scholar | 1:CAS:528:DC%2BC3MXhtVKns7c%3D&md5=d5bf914bcf7ef4f6604592e3a069308eCAS | 21268630PubMed |
[40] A. A. Koelmans, E. Besseling, A. Wegner, E. M. Foekema, Plastic as a carrier of POPs to aquatic organisms: a model analysis. Environ. Sci. Technol. 2013, 47, 7812.
| Plastic as a carrier of POPs to aquatic organisms: a model analysis.Crossref | GoogleScholarGoogle Scholar | 1:CAS:528:DC%2BC3sXptFeisbk%3D&md5=588ca2660f26b0ff83fc4fad12828a12CAS | 23758580PubMed |
[41] C. C. Ebbesmeyer, W. J. Ingraham, Pacific toy spill fuels ocean current pathways research. Eos Trans. AGU 1994, 75, 425.
| Pacific toy spill fuels ocean current pathways research.Crossref | GoogleScholarGoogle Scholar |
[42] J. P. Harrison, M. Sapp, M. Schratzberger, A. M. Osborn, Interactions between microorganisms and marine microplastics: a call for research. Mar. Technol. Soc. J. 2011, 45, 12.
| Interactions between microorganisms and marine microplastics: a call for research.Crossref | GoogleScholarGoogle Scholar |
[43] E. R. Zettler, T. J. Mincer, L. A. Amaral-Zettler, Life in the ‘Plastisphere’: microbial communities on plastic marine debris. Environ. Sci. Technol. 2013, 47, 7137.
| 1:CAS:528:DC%2BC3sXptFeht7w%3D&md5=ba4d5cb31e1d289133f39f3ee5b73b6dCAS | 23745679PubMed |
[44] A. McCormick, T. J. Hoellein, S. A. Mason, J. Schluep, J. J. Kelly, Microplastic is an abundant and distinct microbial habitat in an urban river. Environ. Sci. Technol. 2014, 48, 11863.
| Microplastic is an abundant and distinct microbial habitat in an urban river.Crossref | GoogleScholarGoogle Scholar | 1:CAS:528:DC%2BC2cXhsFGlsrjL&md5=ee63405e95eefec83cf1456e8717c442CAS | 25230146PubMed |
[45] M. Claessens, L. Van Cauwenberghe, M. B. Vandegehuchte, C. R. Janssen, New techniques for the detection of microplastics in sediments and field collected organisms. Mar. Pollut. Bull. 2013, 70, 227.
| New techniques for the detection of microplastics in sediments and field collected organisms.Crossref | GoogleScholarGoogle Scholar | 1:CAS:528:DC%2BC3sXmtVagtbs%3D&md5=b4f4051dbc086997db32828088f58c11CAS | 23601693PubMed |
[46] H. K. Imhof, J. Schmid, R. Niessner, N. P. Ivleva, C. Laforsch, A novel, highly efficient method for the separation and quantification of plastic particles in sediments of aquatic environments. Limnol. Oceanogr. Methods 2012, 10, 524.
| 1:CAS:528:DC%2BC38XhtlyntrfN&md5=b2457dab3b418e16f52c1327551bf523CAS |
[47] M.-T. Nuelle, J. H. Dekiff, D. Remy, E. Fries, A new analytical approach for monitoring microplastics in marine sediments. Environ. Pollut. 2014, 184, 161.
| A new analytical approach for monitoring microplastics in marine sediments.Crossref | GoogleScholarGoogle Scholar | 1:CAS:528:DC%2BC3sXhvVWlt7%2FL&md5=6c46200a245f87066cf6d3f148a5a9beCAS | 24051349PubMed |
[48] S. Morét-Ferguson, K. L. Law, G. Proskurowski, E. K. Murphy, E. E. Peacock, C. M. Reddy, The size, mass, and composition of plastic debris in the western North Atlantic Ocean. Mar. Pollut. Bull. 2010, 60, 1873.
| The size, mass, and composition of plastic debris in the western North Atlantic Ocean.Crossref | GoogleScholarGoogle Scholar | 20709339PubMed |
[49] M. J. Doyle, W. Watson, N. M. Bowlin, S. B. Sheavly, Plastic particles in coastal pelagic ecosystems of the Northeast Pacific ocean. Mar. Environ. Res. 2011, 71, 41.
| Plastic particles in coastal pelagic ecosystems of the Northeast Pacific ocean.Crossref | GoogleScholarGoogle Scholar | 1:CAS:528:DC%2BC3MXnsVemsg%3D%3D&md5=43413eba44fce91c7516703af800aedeCAS | 21093039PubMed |
[50] G. Liebezeit, F. Dubaish, Microplastics in beaches of the East Frisian Islands Spiekeroog and Kachelotplate. Bull. Environ. Contam. Toxicol. 2012, 89, 213.
| Microplastics in beaches of the East Frisian Islands Spiekeroog and Kachelotplate.Crossref | GoogleScholarGoogle Scholar | 1:CAS:528:DC%2BC38XosVKjsLY%3D&md5=5be4d015000451edd208b4ea7bda1b68CAS | 22526995PubMed |
[51] F. Noren, Small Plastic Particles in Coastal Swedish Waters 2007 (KIMO Sweden, N-Research: Lysekil, Sweden).
[52] F. Norén, L.-J. Naustvoll, Survey of Microscopic Anthropogenic Particles in Skagerrak. Report TA 2779 2010 (Klima- og forurensningsdirektoratet, N-Research Lysekil & Havforskningsinstituttet, Flødevigen). Available at www.miljodirektoratet.no/old/klif/publikasjoner/2779/ta2779.pdf [Verified 23 July 2015].
[53] F. Dubaish, G. Liebezeit, Suspended microplastics and black carbon particles in the Jade system, Southern North Sea. Water Air Soil Pollut. 2013, 224, 1352.
| Suspended microplastics and black carbon particles in the Jade system, Southern North Sea.Crossref | GoogleScholarGoogle Scholar |
[54] M. Eriksen, S. Mason, S. Wilson, C. Box, A. Zellers, W. Edwards, H. Farley, S. Amato, Microplastic pollution in the surface waters of the Laurentian Great Lakes. Mar. Pollut. Bull. 2013, 77, 177.
| Microplastic pollution in the surface waters of the Laurentian Great Lakes.Crossref | GoogleScholarGoogle Scholar | 1:CAS:528:DC%2BC3sXhs1yrtbrO&md5=e7ba2955d1cea1d616864efbc09ba802CAS | 24449922PubMed |
[55] M. G. J. Löder, G. Gerdts, Methodology used for the detection and identification of microplastics – a critical appraisal, in Marine Anthropogenic Litter (Eds M. Bergmann, L. Gutow, M. Klages) 2015, pp. 201–227 (Springer: Berlin).
[56] J. H. Dekiff, D. Remy, J. Klasmeier, E. Fries, Occurrence and spatial distribution of microplastics in sediments from Norderney. Environ. Pollut. 2014, 186, 248.
| Occurrence and spatial distribution of microplastics in sediments from Norderney.Crossref | GoogleScholarGoogle Scholar | 1:CAS:528:DC%2BC2cXhvVWmsbs%3D&md5=d575caebf98a45bf17a1c8caca7af3c9CAS | 24448461PubMed |
[57] E. Fries, J. H. Dekiff, J. Willmeyer, M. T. Nuelle, M. Ebert, D. Remy, Identification of polymer types and additives in marine microplastic particles using pyrolysis-GC/MS and scanning electron microscopy. Environ. Sci. Process. Impacts 2013, 15, 1949.
| Identification of polymer types and additives in marine microplastic particles using pyrolysis-GC/MS and scanning electron microscopy.Crossref | GoogleScholarGoogle Scholar | 1:CAS:528:DC%2BC3sXhsFWlurnP&md5=097be75fc57068f7942244d968d9a57eCAS | 24056666PubMed |
[58] H. K. Imhof, N. P. Ivleva, J. Schmid, R. Niessner, C. Laforsch, Contamination of beach sediments of a subalpine lake with microplastic particles. Curr. Biol. 2013, 23, R867.
| Contamination of beach sediments of a subalpine lake with microplastic particles.Crossref | GoogleScholarGoogle Scholar | 1:CAS:528:DC%2BC3sXhsF2gtbfI&md5=6e11592ca247c7597cdffb6b3d2e79b6CAS | 24112978PubMed |
[59] J. P. Harrison, J. J. Ojeda, M. E. Romero-Gonzalez, The applicability of reflectance micro-Fourier-transform infrared spectroscopy for the detection of synthetic microplastics in marine sediments. Sci. Total Environ. 2012, 416, 455.
| The applicability of reflectance micro-Fourier-transform infrared spectroscopy for the detection of synthetic microplastics in marine sediments.Crossref | GoogleScholarGoogle Scholar | 1:CAS:528:DC%2BC38XhsV2jtrc%3D&md5=55d8aa753fc7204320bf0e7c0bfb7becCAS | 22221871PubMed |
[60] J. Frias, P. Sobral, A. M. Ferreira, Organic pollutants in microplastics from two beaches of the Portuguese coast. Mar. Pollut. Bull. 2010, 60, 1988.
| Organic pollutants in microplastics from two beaches of the Portuguese coast.Crossref | GoogleScholarGoogle Scholar | 1:CAS:528:DC%2BC3cXhtlKmt7fO&md5=a9f55b6b21e16c5ed5c9049cbab4a14aCAS | 20800853PubMed |
[61] M. S. Reddy, S. Basha, S. Adimurthy, G. Ramachandraiah, Description of the small plastics fragments in marine sediments along the Alang-Sosiya ship-breaking yard, India. Estuar. Coast. Shelf Sci. 2006, 68, 656.
| Description of the small plastics fragments in marine sediments along the Alang-Sosiya ship-breaking yard, India.Crossref | GoogleScholarGoogle Scholar |
[62] I. W. Levin, R. Bhargava, Fourier transform infrared vibrational spectroscopic imaging: Integrating microscopy and molecular recognition. Annu. Rev. Phys. Chem. 2005, 56, 429.
| Fourier transform infrared vibrational spectroscopic imaging: Integrating microscopy and molecular recognition.Crossref | GoogleScholarGoogle Scholar | 1:CAS:528:DC%2BD2MXps1Grtrw%3D&md5=86c575306a017a919670979f0d2388aeCAS | 15796707PubMed |
[63] B. Stuart, Infrared Spectroscopy – Fundamentals and Applications 2004 (Wiley: Chichester, UK).
[64] J. Coates, Interpretation of infrared spectra, a practical approach, in Encyclopedia of Analytical Chemistry (Ed. R. A. Meyers) 2000, pp. 10815–10837 (Wiley: Chichester, UK).
[65] J. J. Ojeda, M. E. Romero-González, S. A. Banwart, Analysis of bacteria on steel surfaces using reflectance micro-Fourier transform infrared spectroscopy. Anal. Chem. 2009, 81, 6467.
| Analysis of bacteria on steel surfaces using reflectance micro-Fourier transform infrared spectroscopy.Crossref | GoogleScholarGoogle Scholar | 1:CAS:528:DC%2BD1MXotFKmsbY%3D&md5=36c682f2d1194f15e6e497bceba85d97CAS | 19580254PubMed |
[66] R. R. Bhargava, T. Ribar, J. L. Koenig, Towards faster FTIR imaging by reducing noise. Appl. Spectrosc. 1999, 53, 1313.
| Towards faster FTIR imaging by reducing noise.Crossref | GoogleScholarGoogle Scholar | 1:CAS:528:DyaK1MXnsV2rt7s%3D&md5=a7e127e24b06abe62bbc0bacea4c3809CAS |
[67] Plastics – The Facts 2013, an Analysis of European Latest Plastics Production, Demand and Waste Data 2013 (Plastics Europe, Association of Plastic Manufacturers: Brussels). Available at http://www.plasticseurope.org/documents/document/20131014095824-final_plastics_the_facts_2013_published_october2013.pdf [Verified 3 February 2014].