

Comparative evaluation of iron leach from different sources of fly ash under atmospherically relevant conditions
Jaya Borgatta A , Amanda Paskavitz A , Deborah Kim A and Juan G. Navea A BA Chemistry Department, Skidmore College, Saratoga Springs, NY 12866-1632, USA.
B Corresponding author. Email: jnavea@skidmore.edu
Environmental Chemistry 13(5) 902-912 https://doi.org/10.1071/EN16046
Submitted: 29 February 2016 Accepted: 30 May 2016 Published: 6 July 2016
Journal Compilation © CSIRO Publishing 2016 Open Access CC BY-NC-ND
Environmental context. Iron, a limiting nutrient of plankton in the ocean, is deposited to the sea from atmospheric aerosols. In particular, atmospheric acidic conditions promote dissolution of iron from fly ash, a by-product of coal-fired power plants. Here, we report that the iron leached from fly ash depends on its source region, and that the type of combustion process may influence the iron species mobilized.
Abstract. Fly ash, an iron-containing by-product of coal-fired power plants, has been observed in atmospheric aerosol plumes. Under the acidic atmospheric conditions resulting from the uptake of atmospheric gases, iron leached from fly ash can impact global biogeochemical cycles. However, the fly ash source region, as well as its generating power plant, plays an important role in the amount, speciation and lability of iron. Yet no comparative studies have been made on iron leached from fly ash from different sources. This study reports the iron mobilisation by proton-promoted dissolution from well-characterised fly ash samples from three distinctive locations: the USA Midwest, north-east India and Europe. In addition, pH dependency was also investigated. Proton-promoted dissolution showed a variability between source regions with a relative iron leach in the order USA Midwestern > north-east Indian > European ash. In addition, the initial rate of iron leach suggests that source region is indeed a determining factor in the iron leaching capacity of fly ash, because dissolution from Midwestern fly ash is also faster than both European and Indian ash. Finally, the combustion process of fly ash proved to be significant for the iron speciation, given that well-combusted fly ash samples leached mostly Fe3+ rather than bioavailable Fe2+. The role of fly ash should therefore be taken into account in order to better understand the effects of combustion particles in atmospheric iron deposition.
Additional keywords: aerosols, acidic processing, combustion particles, dissolution.
Introduction
Over the last few decades, the global production of fly ash, a by-product of coal-fired power plants, has risen.[1] In the early 1990s, fly ash production was estimated at over 300 Tg per year worldwide.[2] Recent annual estimates indicate that the production of fly ash in the United States is ~66 Tg, 90 Tg in China and India each, and over 31 Tg in Europe.[3–6] Although efforts have been made to dispose of fly ash and prevent its emission into the atmosphere, field studies performed over the last decade have found fly ash particles in isolated regions, suggesting long-range atmospheric transport.[7–10] All fly ash particles found in the atmosphere are fine particulate matter (<2.5 μm) released either by direct emission or by fugitive emissions from the handling of fly ash.[10–13] Because of its size and morphology, fly ash tends to have long residence times, long-range transport and high atmospheric lifetimes.[7,8,10] Owing to their high iron oxide content, these combustion particles have been suggested as a source of atmospheric aqueous iron.[13,14] In fact, anthropogenic aerosols, including fly ash, have been shown to contribute ~50 % of the iron deposited near industrial regions and at least 5 % over open oceans.[15]
Iron leach from tropospheric aerosols during atmospheric acidic processing has been suggested as a source of bioavailable iron, Fe2+, in open oceans.[16,17] As a limiting nutrient in isolated regions of the ocean, Fe2+ stimulates phytoplankton growth and promotes the sequestration of atmospheric CO2.[18–21] Thus, the wet deposition of Fe2+ from fly ash may impact climate fluxes.[22,23] Recently, laboratory studies on fly ash standards have shown that combustion anthropogenic aerosols may have a similar stimulatory effect on phytoplankton growth.[13,15,24] Specifically, Chen et al. have shown that fly ash standards leach iron ions under atmospherically relevant conditions.[13,25] These studies observed the leach of both Fe2+ and Fe3+ from fly ash, indicating that fly ash may contribute a significant fraction of iron to the atmosphere.[13,24,25] However, the availability of iron from fly ash depends closely on its minerology and particle size.[26] Moreover, fly ash chemical composition and particle morphology vary with the source region and combustion process employed. The mineralogy and particle size of fly ash are determined by the chemical composition of the coal employed in the power plant, as well as the combustion process parameters in the boiler, such as air supply, heat of the combustion and duration of the combustion.[27] Therefore, coal-fired power plants using coal extracted from different sources may produce fly ash particles with distinctive physicochemical properties and varying environmental implications. Yet there is no comparative study on the leach and rate of dissolution of iron from fly ash from different source regions.
Recent studies have shown that other tropospheric aerosols, such as mineral dust, are a natural source of iron in oceans.[24–26,28] These laboratory studies suggest that 24-h proton-promoted iron solubility from mineral dust ranges between 4 and 14 % of the initial total iron content in the mineral sample.[28] In contrast to combustion particles, which are generated through a highly oxidative process, speciation of trace metals in mineral dust can show a higher fraction of reduced species.[27] In fact, proton-promoted iron dissolution from mineral dust has shown a fairly important fraction of Fe2+, ranging between 5 and 38 % of the total iron leached from mineral dust, depending on the source region.[28] This fairly large fraction of Fe2+ has the potential to impact on the bioavailable iron mobility in the environment. However, combustion particle speciation is thought to depend not only on the source region but also on the boiler combustion efficiency.[26,27] Thus, a comparative study on the effect of combustion particles such as fly ash from distinctive sources and power plants is important to establish its impact in the environmental availability of iron.
In the present work, we investigate the initial leach rate and yield of Fe2+ and Fe3+ from fly ash samples from three different source regions: the United States, India and Europe. All samples were captured in the flue-gas stack before atmospheric acidic processes take place. The significant difference in location ensures a different coal and thermal power-plant boiler, providing a comparative element to this study. This study investigates the leach of iron from fly ash at pH 1 and 2, acidic conditions that simulate the deliquescent layer of an aerosol particle on the uptake of acidic atmospheric gases.
Experimental
Source materials
Three fly ash (FA) samples were obtained from coal-fired power plants located in different regions: the United States of America (USFA) from the Midwest region, Indian fly ash (INFA) from north-eastern India, and European fly ash (EUFA) from a commercially available standard of fly ash (BCR®-176R) obtained from the European Commission. All reagents employed for sample characterisation and dissolution experiments were analytical grade. All reagents were used without further purification.
Morphology and spectroscopy of fly ash
The morphology and bulk composition of the FA samples were investigated using scanning electron microscopy (JEOL 6480 LV) coupled with energy-dispersive X-ray analysis (SEM-EDX; Bruker-AXS). In addition, surface areas for all dust samples were determined using an 11-point N2-BET (Brunauer–Emmett–Teller) adsorption isotherm that was acquired with a Quantachrome Nova 1200 surface-area analyser. The samples were evacuated overnight before the surface area measurement.
Bulk elemental composition analysis of FA particles was measured using Bruker Tracer III-SD X-ray fluorescence spectroscopy (XRF). In addition, total iron content of all three FA samples was measured by atomic absorption spectroscopy (AAS) using a PerkinElmer AAnalyst 800 spectrometer. Approximately 0.1 g of fly ash samples was acid-digested in Teflon vessels using a mixture of 5 mL HNO3 and 3 mL H2O2. The vessels were tightly sealed and microwaved in a microwave digestion system (Ethos model, Milestone) for a two-stage digestion method as described by Iwashita et al.[28]
Total attenuated reflectance Fourier-transform infrared spectra (ATR-FTIR) of all fly ash samples were recorded with a single-beam Perkin–Elmer FTIR spectrometer, equipped with a ZnSe ATR element and a deuterated, L-alanine-doped triglycine sulfate (DLaTGS/KBr) detector. All samples were deposited on the ATR crystal by pressing the dry powder onto the ZnSe crystal surface. Typically, 400 scans were acquired at an instrument resolution of 4 cm–1 over the full spectral range extending from 800 to 4000 cm–1. Prior to FTIR analysis, all fly ash samples were vacuum-dried overnight at 373 K.
Iron leach experiments
Dissolution of iron species from fly ash was performed on fly ash suspensions of 1 g L–1. Isothermal iron leach experiments were performed in a jacketed glass beaker at 298 K with constantly stirred solutions acidified with hydrochloric acid to a controlled pH set to 1.0 ± 0.1 or 2.0 ± 0.1. These conditions simulate cloud processing of tropospheric aerosol particles.[29] Note, Fe3+ shows low solubility above pH 3.6.[30] The solubility product of concentrations above 60 ppm, a concentration relevant for our iron leach experiments, Fe3+ begins to precipitate as Fe(OH)3 above pH 2.4. In fact, increases in pH above this threshold of 2.4 have shown ferric iron precipitation in aqueous solutions with concentrations of Fe3+ of ~60 ppm.[31] Thus, an upper pH limit of 2.0 ± 0.1 allows the measurement of Fe3+ in solution without hydrolysis loss of iron.[25]
Even though the rate of ferrous iron oxidation is slow, its dependency on pH can lead to oxidation of Fe2+, particularly as the pH increases.[32] Thus, in order to prevent oxidation of Fe2+ once leached from fly ash, all dissolution experiments were carried out under constant nitrogen purge to prevent oxidation by dissolved atmospheric oxygen.[31] This oxygen-free environment allowed a better quantification of both Fe3+ and Fe2+ leached from fly ash samples during the suspension experiments. In addition, to control the variations in ion strength in the suspension solution as the dissolution of fly ash particles took place, all acidic solutions were adjusted to an activity of 1 N NaCl.
Kinetic measurements started at time t = 0 min, defined as the moment of fly ash loading into the solution. After t = 0 min, aliquots of the suspension were taken periodically, filtered with a 0.2-μm filter, and colorimetrically analysed for dissolved iron content.[33] Dissolved iron speciation was quantified using 1,10-phenanthroline, which forms an orange complex with Fe2+ with an absorbance band at 510 nm. Total dissolved iron was quantified in the same samples by adding hydroxylamine to reduce all Fe3+ to Fe2+ before phenanthroline complexation. For the colorimetric calibration, primary standard ammonium iron(II) sulfate hexahydrate was used to prepare aqueous standard solutions of Fe2+ at a concentration range from 0.1 to 10 ppm. Hydroxyl ammonium sulfate was also added to each standard solution as a reducing agent, ensuring the presence of Fe2+ only. On addition of 1,10-phenanthroline solution, a 10-min passivation time was allowed before the absorbance measurement for every standard and sample. All colorimetric complexes absorbances were measured in a Lambda 35 Perkin–Elmer UV-vis spectrophotometer.
Results and discussions
Morphological study of fly ash samples
Particle size and morphology have been shown to have important implications in the leaching of iron from aerosol particles. In general, as particles become smaller, a greater proportion of their surface is in physical contact with the acid media and, consequently, available for dissolution.[34] In addition, surface defects and porosity can increase acid media contact area, potentially increasing the initial rate and yield of particle dissolution. In particular, the predominantly spherical particles composing fly ash, which are the result of a controlled combustion process characteristic of high-efficiency power plants, offer a fairly large contact area between surface and proton. As the size of the particles increases, their exposed surface area decreases and their surface–proton contact area drops; nevertheless, as more defects are present in the particles, the surface–acid contact area increases.[34] Therefore, in order to better understand iron leach from the dissolution of the fly ash particles, specific surface area and particle size were investigated.
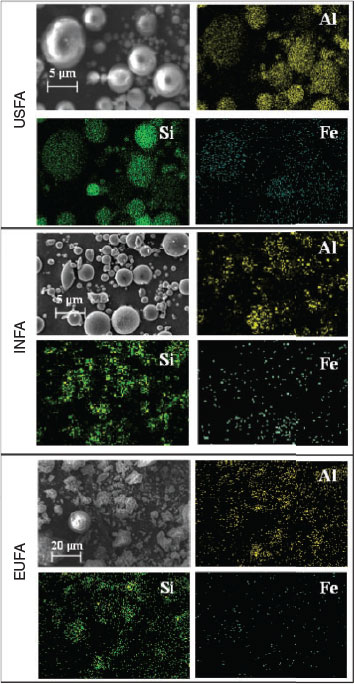
Specific surface areas, SBET, of the three fly ash samples examined are 1.8 ± 0.1, 0.98 ± 0.03 and 2.8 ± 0.1 m2 g–1 for USFA, INFA and EUFA respectively. Most particles examined in the fly ash samples were spherical in shape; however, EUFA showed a high proportion of irregular-shaped particles. The relatively high fraction of non-spherical particles found in EUFA suggests an incomplete combustion process, because a higher fraction of spherical particles is an indication of a thorough combustion process.[13] In general, particles are observed to aggregate, with clusters of smaller particles attached onto larger ones, as seen in the micrograph for the fly ash samples investigated in Fig. 1. Overall, the specific surface area indicates that EUFA will have a larger area exposed to the acidic media, whereas INFA will have a smaller area in contact with the aqueous phase.
|
Each micrograph shown in Fig. 1 has an elemental mapping that corresponds to the same micrograph, which shows that particles have a homogeneous distribution of minerals containing aluminium, silicon and iron in the spherical particles. In addition, the elemental composition of particles of different sizes is also homogeneous, with no significant difference in the elemental composition between particles of different sizes, consistent with observations made on standard fly ash samples.[12,13]
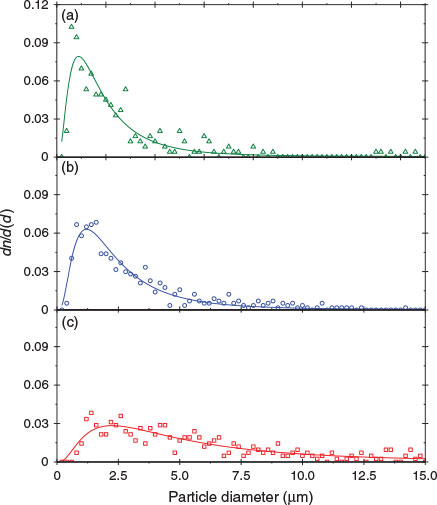
Fig. 2 shows the size distribution of fly ash particles examined. All size distributions consider only spherically shaped particles, even in EUFA, which has significant number of irregular-shaped particles. In general, spherical particles show a good fit to a log-normal size distribution,[35] as described by Eqn 1:
|
where n is the number of particles,  is the normalised particle diameter, A and w are the amplitude and width of the normal distribution, d is the particle diameter and
  is the arithmetic mean of the particle diameter. For each sample examined,
  was determined from a sample of at least 350 particle counts, yielding values of (1.59 ± 0.05), (2.07 ± 0.04) and (4.6 ± 0.2) μm for USFA, INFA and EUFA respectively. The modal diameter, dm, corresponds to the maxima in the log-normal fit shown in Fig. 2, and it represents the most probable particle diameter in each sample. The dm was determined from the optimisation of the log-normal particle size distribution, the first-order derivative of Eqn 1:
As expected, the maxima in the log-normal modal suggest that the distribution diameters yield values below the arithmetic mean: 0.89 ± 0.08, 1.21 ± 0.06 and 2.2 ± 0.3 μm for USFA, INFA and EUFA respectively. The higher proportion of particles represented by the maxima in the plots in Fig. 2 is ~50 % smaller that the particle size median. Thus, fly ash samples examined have a size distribution and average size representative of those fly ash particles found in the atmosphere, with sizes <2.5 μm.[11,12]
The probability of smaller particles in the fly ash samples, as suggested by modal diameters, can have important implications in the iron leach on acidic processing. A greater abundance of smaller particles may lead to enhancements in particle dissolution and iron leach, because the available surface–acid interface that leads to the metal leach is inherently larger in smaller particles.[26,36,37] In addition, particle defects and porosity will tend to increase the surface available for reaction with H+ ions during the particle acidic processing, which can play an important role in iron solubility.[34]
An evaluation of the available surface with respect to the sphericity of the particles, ψ, allows a comparative assessment of the surface defects of the particles and the combustion process that produced the fly ash samples. The sphericity, as proposed by Wadell,[38] is a dimensionless parameter that was estimated as the ratio of the arithmetic mean diameter of the particles,  , to the geometric diameter of a perfect sphere calculated from the specific surface areas determined through BET, dBET:
For the purpose of the present study, ψ values lower than 1 are a good indicator of a large number of surface defects and porosity rather than just particle shape. Indeed, given the defects observed through micrographs, all ψ values are significantly lower than 1. USFA and INFA were found to have sphericity values of (2.1 ± 0.1) × 10–6 and (3.7 ± 0.1) × 10–6, indicating that USFA has larger surface defects, allowing a larger physical contact between the particle surface and the acid media. However, the ψ ratio for EUFA was found to be (4.9 ± 0.3) × 10–6. For USFA and INFA samples, where the particles are mostly spherical, the low ψ values are an indication of surface defects and porosity. Moreover, EUFA has a smaller specific surface area than suggested by the spherical particles owing to partially combusted particles. Table 1 summarises the morphological parameters in all fly ash samples.

|
Although the physical contact between particle surface and the acid media suggests a greater surface–proton interaction for USFA, where the largest deviation from a spherical surface is observed, the chemical composition of the particles indicates the effectiveness of the surface–proton interaction towards particle dissolution.
Elemental composition
XRF shows a relative higher bulk content of iron than any other trace element. Table 2 summarises the bulk elemental composition of trace elements in all three fly ash samples, normalised without Al or Si. The difference in trace elemental composition in the bulk can be attributed to differences in coal mineralogy for the different regions.
|
In general, the relative content of iron, with respect to other trace elements, was found to be lower in European fly ash, whereas the largest was found in Indian fly ash. In fact, other than Al, Si and Fe, INFA has less than 5 % of all other trace elements. However, both USFA and EUFA showed a relatively higher content of Ca, with a higher content of Zn in EUFA.
When analysed using AAS, the content of total iron was found to be 38 ± 2, 25 ± 3 and 9.4 ± 0.8 mg g–1 for USFA, INFA, and EUFA respectively. The higher amount of iron in USFA indicates that INFA has a smaller proportion of trace elements relative to USFA. Thus, INFA has a relatively significant fraction of aluminosilicates in its bulk composition, where Al and Si are outside the XRF detection range and not shown in Table 2. Overall, atomic spectroscopy indicates that the largest amount of iron is found in United States fly ash, whereas European ash has the lowest content of iron. However, the incomplete combustion of EUFA suggests an iron speciation with a higher proportion of Fe2+ relative to that in USFA and INFA, because inefficient combustion will not completely oxidise all Fe2+ contained in coal samples.[15]
ATR-FTIR spectroscopy of fly ash samples
ATR-FTIR spectroscopy provides insight into the composition and chemical properties of the ash samples. The spectra of the dried fly ash samples are shown in Fig. 3.
|
Fig. 3a shows the entire region from 700 to 4000 cm–1, with an insert showing an expansion of the region from 2750 to 3800 cm–1 whereas Fig. 3b shows a magnified view of the region from 700 to 1750 cm–1. Based on previous literature assignments, the vibrational absorption bands are assigned to fundamental vibrational modes in Table 3.

|
The inset in Fig. 3a shows a band centred at ~3673 cm–1 for both Indian and European fly ash, assigned to the ν(OH) of structural hydroxyl groups. These spectral features suggest that both EUFA and INFA have the potential for formation of relatively more hydrogen bonds on surfaces than USFA. In addition, EUFA shows additional inner structural hydroxyl bands in the region of 3600 cm–1 not observed in either USFA or INFA. In particular, EUFA shows a broad band attributed to the hydrogen bonding stretching region at ~3455 cm–1 due to H-bonded hydroxyl groups. This observation indicates that the mineralogy of EUFA contains non-combusted particles with many interlayers capable of adsorbing water and interacting with H+ ions in the acidic solutions.[39,40]
In Fig. 3b, European fly ash shows absorption bands in the 1400 cm–1 region, assigned to the bending mode of carbonates. In addition, EUFA shows a characteristic band at 1628 cm–1 due to the stretching vibration of –COO– of bicarbonates.[41] These carbonate and bicarbonate spectral features are absent in both United States and Indian fly ashes, indicating the fairly poor combustion of EUFA, as suggested by the higher presence of non-spherical particles seen in the micrographs shown in Fig. 1.
All fly ash samples show bands in the spectral region from 900 to 1700 cm–1, assigned to vibrational absorptions bands due to lattice stretching motions of Si–O. Fig. 3b shows differences in frequency and peak intensities over this region for the three fly ash samples. In particular, both USFA and EUFA show ν(Si–O) centred at 931 to 1100 cm–1, contrasting with the same bands displayed at ~1037 and 1152 cm–1 for INFA. This difference can be attributed to the lattice structures. In addition, bands near 780 cm–1 were assigned to deformation modes of Fe3+ and alkaline earth, δ(FeCa–OH).[42] The bands at ~875 cm–1 were also deformation modes of Fe3+ associated with aluminium, δ(FeAl–OH). All fly ash samples showed iron content associated with alkaline earth elements or aluminium. Finally, spectra for all three samples showed δ(AlAl–OH) at 930 cm–1. Overall, the ATR-FTIR spectra showed that Al and Si were abundant in all three fly ash samples, with some Fe. Moreover, the ATR-FTIR bands indicate the presence of Fe in the samples, which is likely in the oxidation state Fe3+ because this oxidation state is consistent with the combustion process that generates fly ash.[40] Thus, iron leach from fly ash particles was expected to contain more Fe3+. In addition, spectral features suggest that all fly ash samples have exposed edge sites with Al–OH and Si–OH bond terminals,[43] which is consistent with literature reports of silica and mullite (3Al2O3·2SiO2) content in fly ash.[44] The formation of mullite and silica in fly ash has been suggested to follow a two-step mechanism during the combustion process, where kaolinite (Al2O3·2SiO2·2H2O) forms metakalin (Al2O3·2SiO2), and further combustion leads to mullite:


where the loss of the well-crystallised aluminosilicate clay minerals leading to mullite and silica has been suggested to decrease the stability of the mineral, which can lead to faster dissolution rates in an acidic media.[13] Overall, the differences between ATR-FTIR spectra are a reflection of the variations in mineralogy due to the difference in power-plant efficiency and their coal source. The exposed surface available for dissolution will interact with protons and the aqueous phase as a function of its chemical composition and affinity towards water and acidic media. A sample with higher affinity towards dissolution will lead to higher iron dissolution rates.[34]
Iron leach experiments
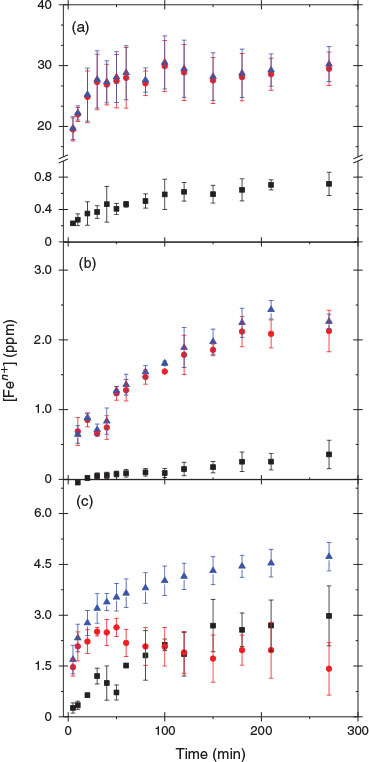
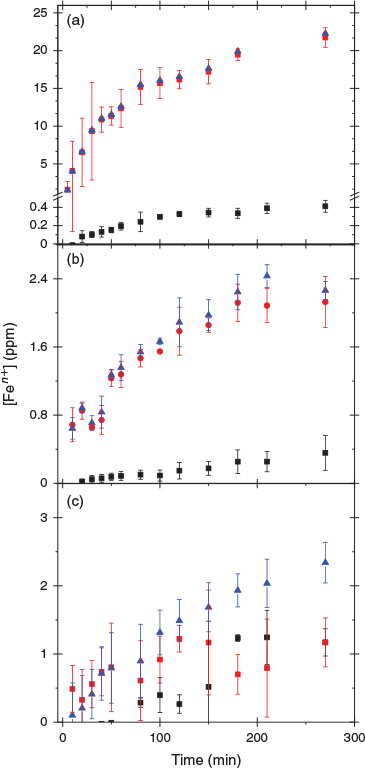
Fly ash samples were allowed to dissolve in an acidic suspension, and periodically extracted aliquots were analysed colorimetrically for Fe2+ and Fe3+. Fig. 4 shows the dissolution speciation of iron as a function of suspension time for the three different ashes examined at pH 1.0 ± 0.1. An increase in the concentration of both Fe2+ and Fe3+ was observed in all acid solutions. For the suspensions of USFA and INFA, the amount of Fe3+ in solution was higher than Fe2+ at any point of the dissolution experiment, as can be seen in Fig. 4a, b.
|
For comparison purposes, Table 4 summarises the iron speciation in the leach experiments at two different reference points: at 500 min of fly ash suspension in the acidic media,  , and at 1440 min (1 day) of suspension,
  . This finding supports the observation that Fe3+ is the predominant form of iron in fly ash, because the combustion process will favour the formation of Fe3+ oxide over Fe2+ species.[45] The relatively higher amount of Fe3+ oxides has been explained as the result of the complete combustion of pyrite (
 ) and magnetite (Fe3O4, a mixture of Fe2O3 and FeO), common components of coal, through the following suggested two-step mechanism[46]:

|
 , and 1440 min of suspension,

Indeed, after 500 min of suspension, the concentration of Fe3+ in solution leached from USFA was nearly 31 times larger than that of Fe2+, whereas INFA only showed detectable Fe3+ in solution. Leach of Fe2+ from the INFA suspension was only detectable after 700 min; before that time, the concentration of Fe2+ in solution was below 30 ppb, the limit of detection of the colorimetric method. In contrast, the suspension of EUFA in a pH 1 solution showed statistically similar concentrations of Fe3+ and Fe2+ between 80 min and 1440 min of reaction. As reported in Table 4, after 1440 min of EUFA suspension, the amount of Fe2+ leached into the solution became higher than the amount of Fe3+ found in solution. This supports the observation of an incomplete combustion of coal in the formation of the EUFA sample, as suggested by the micrographs and FTIR analysis (see above). The iron speciation in the solution phase in the EUFA suspension was the result of dissolution of iron-containing minerals in non-combusted coal particles, as well as the dissolution of both Fe3+ and Fe2+ in the partially combusted particles.
After a complete combustion process, the iron leach should yield Fe3+ only. However, the presence of both Fe3+ and Fe2+ in all fly ash suspension experiments was the product of iron oxides contained in magnetite, Fe2O3 and FeO, a common component in partially combusted coal as shown in Eqn 6, which can leach Fe2+[45]:


Fig. 4 suggests that iron dissolution from the fly ash samples examined was faster in USFA than in the other samples. Overall, the proton-promoted iron leach from fly ash suspensions exhibits two pathways: an initial, rapid iron leach on fly ash introduction into the pH 1 solution, followed by a slower leach of iron. The fast iron leach occurred on a time-scale faster than our experimental resolution and it was clearly observed in USFA and EUFA leach of total iron, whereas iron leaching from INFA did not show the faster iron dissolution pathway. The rapid dissolution suggested the presence of surface iron species interacting directly with protons through reactions similar to Eqn 8 and Eqn 9.[47] The fast pathway rate is extracted from the slope between t = 0 min and the first data point (5 min). However, the slower initial rate was taken from the slope of the linear segment from the first data point, t = 5 min, to the limit of linearity, which was determined from the deviation of the data point with respect to the linear extrapolation at a 95 % level of confidence.[48] Based on our experimental resolution, the lower boundary of the initial rate of this rapid total iron (Fe3+ + Fe2+) leach, vf, was estimated to be (3.9 ± 0.4) × 1015 molecules cm–3 s–1 and (3.3 ± 0.8) × 1014 molecules cm–3 s–1 for USFA and EUFA at pH 1 respectively. In addition, iron leaching from fly ash slowly reached a plateau to a maximum iron leachate concentration in all cases. Considering the iron content in each fly ash sample examined, INFA yielded a considerably lower proportion of its iron content at a slower rate. These observations suggest that the mineralogy variations evidenced by the differences in the ATR-FTIR spectral features, a reflection of the coal source and combustion efficiency, play an important role in the leaching of iron.
The initial, fast leach of iron was followed by a slower leach attributed to the proton-promoted dissolution taking place as the result of H+ ions interacting with particle surface functional groups, such as hydroxyl terminals and, in the case of the incomplete combustion particles found in EUFA, carbonates and hydroxyl groups.[49] As the proton complexes with the fly ash surface, it frees additional iron oxides or iron-containing incompletely combusted particles to continue the dissolution process.[13] The initial rate of the slower proton-promoted leach of iron, vs, and the fast pathway, vf, is summarised in Table 5.

|
The slow pathway of USFA is relatively faster than that in INFA, which mirrors the initial rate sequence observed for the fast pathway. It can be observed in Table 5 that the leaching of Fe2+ was slower than that of Fe3+. The observed initial rate of the slow pathway, vs, for each iron species has a different dependency on the pH:
where  is the iron available in fly ash present at the surface and in the bulk, n = 2 or 3 and m is the iron leach reaction order. Given the stoichiometric coefficients in Eqn 8 and Eqn 9, the initial rate of Fe3+ leach from the oxide particles primarily present in USFA and INFA was more susceptible to changes in pH than that of Fe2+ leach. Thus, because the pH was constant throughout the experiment, the initial rate of the second (slow) pathway, vs was faster for the leach of Fe3+, as indicated in the data summarised in Table 5. In addition, ferrous iron is mostly found in the bulk of the particle rather than the surface. This suggests that, as the particle progressively dissolves and breaks down in the acidic solution, a higher fraction of Fe2+ species becomes available for acidic processing.[13] As a consequence, the dissolution initial rate of Fe2+ is dependent on the dissolution of the surface ferric iron.
The amount of Fe2+ leached from the EUFA suspension was the highest of the three samples examined. This observation is consistent the characterisation of EUFA particles, which showed an important fraction of non-combusted or partially combusted particles. Iron in non-combusted particles may have been present as part of the crystallised aluminosilicate composition, whereas partially combusted particles have been suggested to have an important magnetite (Fe3O4) fraction, as shown in Eqn 6.[46] In all these cases, the composition of the sample includes Fe2+. Because the content of iron in EUFA was not necessarily in an oxide form, the initial rate was the result of a combination of Eqn 10 and the leaching of iron content in non-combusted particles. Contrary to the leaching of Fe3+ in the EUFA suspension, the leaching of Fe2+ did not undergo the fast pathway observed in USFA, suggesting that the dissolution of Fe2+ from EUFA samples was the result of bulk Fe2+ rather than surface iron. This observation suggests that Fe2+ was mostly contained in unburned minerals, because the combustion process did not consume the framework of the well-crystallised aluminosilicate to expose Fe2+. Because the crystal aluminosilicate provides stability to the particles, no rapid dissolution of Fe2+ was possible. Overall, the initial slow rate of iron leach from EUFA suspension was slower than that from USFA, as summarised in Table 5.
Fig. 5 shows the dissolution speciation of iron for the three different fly ash samples examined at pH 2.0 ± 0.1. As observed in pH 1 suspensions, an increase in the concentration of both iron species was observed throughout the experiment. Overall, as expected from Eqn 8 and Eqn 9, the leach of iron slows down for all samples with the decrease in concentration of H+ ions. In fact, the fast leach pathway observed in the pH 1 suspension of USFA and EUFA decreases substantially as the pH increases. In the case of USFA, the fast pathway was only observed in the leach of Fe3+, whereas the fast pathway in EUFA was completely suppressed at pH 2. The fast initial rate of the total iron leach from USFA decreased from (3.9 ± 0.4) × 1015 molecules cm–3 s–1 at pH 1 to (4.2 ± 0.5) × 1014 molecules cm–3 s–1 at pH 2, a drop of ~90 %. Table 5 summarises the initial rate for both the slower proton-promoted leach of iron, vs, and the fast pathway, vf.
|
In addition, for pH 2 solutions the slow pathway rate showed a similar trend to that observed at pH 1, with USFA having the fastest dissolution rate and the slowest being in INFA. Table 5 summarises the initial rates for both pH 1 and pH 2. It can be seen that the values of vs at pH 2 show no statistically significant change for the leach of total iron, Fe2+ and Fe3+ from USFA. However, vs for the leach of total iron at pH 2 significantly dropped for the other samples studied, with a decline from pH 1 of 83 and 47 % for INFA and EUFA respectively. In all cases, the concentration of iron slowly reached a plateau to equilibrium concentrations.
In order to make a direct comparison of the iron leached from each fly ash sample, the concentration of total iron remaining in fly ash at a given suspension time t was calculated from the normalised concentration of total iron leached and the iron content in the fly ash loading, as determined by AAS analysis and the experimental suspended fly ash loading of 1 g L–1:
where  and
and  represent the concentration of iron(II) and iron(III) available in fly ash, and
  and
and  represent the concentration of total iron(II) and iron(III) leached at a time t, respectively. Fig. 6 shows the time progression of the fraction of total iron remaining in the fly ash samples. Using Eqn 11, the fraction of total iron leached from USFA was estimated ~80 % beyond 500 min of suspension for both pH 1 and 2. Conversely, total iron dissolution from INFA was ~10 % for both pH 1 and 2. Finally, EUFA in pH 1 solutions reached a maximum fraction of iron leached at ~150 min of suspension, with a higher fraction of iron leached at pH 1.

|
Previous dissolution experiments at pH 1 that used fly ash standard materials with higher Fe2+ content than the samples used in the present study showed a total iron leaching of ~50 %.[13,25] Although this observation is consistent with the total iron leaching from EUFA, the sample with the largest leaching of ferrous ions, our results suggest that a combination of particle size and mineralogy, as well as the coal-combustion efficiency, plays an important role not only in the solubility of total iron but also in the iron speciation in the solution phase. In fact, Fig. 6b indicates that the dissolution yield does not correlate with a single property, suggesting that it is a combined effect of the mineralogy, surface area and morphology of the fly ash sample. Significantly, USFA, the fly ash sample with the largest relative iron content reported in the current work, shows the highest iron solubility at the fastest rates. In fact, the fast pathway at pH 1 for USFA accounted for over 50 % of the total iron leached. However, the fast pathway at pH 1 for EUFA accounted for ~18 % of total iron leached into solution. In addition, as observed in Figs 4 and 5, only a short fast pathway was observed at pH 2 in USFA, which accounted for only 2 % of the total iron leached. With the exception of EUFA samples, most of the total iron reported in Fig. 6 corresponded to Fe3+. Finally, Fig. 6 shows that pH 1 total iron dissolution was consistently faster than at pH 2, because the fraction of total iron in fly ash reached a plateau earlier at the lower pH. This observation supports the rate dependency on the concentration of H+, as expressed in Eqn 10. This result suggests that variability between fly ash source regions has distinctive atmospheric effects.
Conclusions
Recent field observations suggest that fly ash particles can be considered a source of atmospheric iron.[1,7,8,50] However, most laboratory studies available use fly ash standards, with no distinction between source regions of combustion process.[13,25] The comparative study we present here shows that the atmospheric acidic processing of three different fly ash samples from three different sources, the United States, India and Europe, yields significant variations in iron mobilisation. The proton-promoted dissolution of iron shows the relative percentage of iron leached from each sample is in the order USFA > EUFA > INFA. Compared with mineral dust dissolution, combustion aerosol samples may play a more important role in mobilising Fe3+ than Fe2+.[26,51] Our study suggests that particles that are only partially combusted or not-well-combusted particles will leach bioavailable Fe2+ in the deliquescent layer of an aerosol particle on the uptake of acidic atmospheric gases. Thus, the combustion efficiency of coal-fired power plants plays a significant role in the speciation of iron mobilised by atmospheric acidic processing.
Our results also indicate that the impact of pH on the rate of iron dissolution varies significantly with the source region. In particular, USFA shows a two-step pathway of iron leaching: the initial rate of iron leached from USFA shows a pH effect only for an initial fast dissolution pathway; there is no statistically significant influence of pH for the slower pathway. Conversely, samples from India and Europe show mostly a single slow pathway, with a rate that drops when the solution acidity decreases from pH 1 to 2. This difference could be due to a higher proportion of surface and labile iron in USFA compared with that in INFA and EUFA. Nevertheless, changes in the pH continue to show the same proportion of iron speciation, showing a significantly higher proportion of acid-mobilised Fe3+ with respect of Fe2+. In fact, the acidic processing of the fully combusted samples (USFA and INFA) examined in our work shows that for USFA, 93 % of the iron leached is Fe3+, whereas for INFA, 88 % of the total iron leached is Fe3+. On the basis of these results, it can be proposed that coal that is only partially combusted could be a significant source of bioavailable iron in the atmosphere. In order to better understand the biogeochemical cycle of atmospheric iron, additional reduction mechanisms of iron should be considered.[52,53]
Supplementary material
Iron dissolution data of the fly ash samples at pHs 1 and 2 are available from the journal online (see http://www.publish.csiro.au/?act=view_file&file_id=EN16046_AC.pdf).
Acknowledgements
Financial support from Skidmore College is gratefully acknowledged. The authors also acknowledge Matthew Lueckheide’s assistance in the bulk iron analysis of fly ash samples using AAS.
References
[1] K. Ojha, N. C. Pradhan, A. N. Samanta, Zeolite from fly ash: synthesis and characterization. Bull. Mater. Sci. 2004, 27, 555.| Zeolite from fly ash: synthesis and characterization.Crossref | GoogleScholarGoogle Scholar | 1:CAS:528:DC%2BD2MXms1Cj&md5=ed1204968eb775ded10ed477e716682fCAS |
[2] O. E. Manz, Worldwide production of coal ash and utilization in concrete and other products. Fuel 1997, 76, 691.
| Worldwide production of coal ash and utilization in concrete and other products.Crossref | GoogleScholarGoogle Scholar | 1:CAS:528:DyaK2sXkt1ejs70%3D&md5=7739caed997c8ebe6d07446616563497CAS |
[3] 2013 Coal Combustion Product (CCP) Production & Use Survey Report 2014 (American Coal Ash Association: Aurora, CO).
[4] E. Haque, Indian fly-ash: production and consumption scenario. International Journal of Waste Resources 2013, 3, 22.
| Indian fly-ash: production and consumption scenario.Crossref | GoogleScholarGoogle Scholar |
[5] H. J. Feuerborn, in Coal Combustion Products in Europe – An Update on Production and Utilisation Standardization and Regulation, World of Coal Conference, Denver, CO, 9–12 May 2011.
[6] X. P. Cai, S. Q. Zhang, J. G. Li, in Proceedings of the 2015 International Conference on Water Resources and Environment 2015, pp. 35–37 (CRC Press: Beijing).
[7] V. Ramanathan, P. J. Crutzen, J. T. Kiehl, D. Rosenfeld, Aersols, climate and the hydrological cycle. Science 2001, 294, 2119.
| Aersols, climate and the hydrological cycle.Crossref | GoogleScholarGoogle Scholar | 1:CAS:528:DC%2BD3MXptVOnur8%3D&md5=090b1554aefaaac4b1d5582f952daedeCAS | 11739947PubMed |
[8] J. Inoue, A. Momose, T. Okudaria, A. Murakami-Kitase, H. Yamazaki, S. Yoshikawa, Chemical characteristics of north-east Asian fly ash particles: implications for their long-range transportation. Atmos. Environ. 2014, 95, 375.
| Chemical characteristics of north-east Asian fly ash particles: implications for their long-range transportation.Crossref | GoogleScholarGoogle Scholar | 1:CAS:528:DC%2BC2cXht1CnsrvF&md5=feb127bcc4d229055eb20fdf77a17377CAS |
[9] P. Nowinski, V. F. Hodge, S. Gerstenberger, Application of field portable X-ray fluorescence to the analysis of desert varnish samples in areas affected by coal-fired power plants. Environ. Chem. 2012, 9, 379.
| Application of field portable X-ray fluorescence to the analysis of desert varnish samples in areas affected by coal-fired power plants.Crossref | GoogleScholarGoogle Scholar | 1:CAS:528:DC%2BC38Xht1ajsb%2FO&md5=ea23a9b62be9c55334d31f9f85b65905CAS |
[10] M. O. Andreae, P. J. Crutzen, Atmospheric aerosols: biogeochemical sources and role in atmospheric chemistry. Science 1997, 276, 1052.
| Atmospheric aerosols: biogeochemical sources and role in atmospheric chemistry.Crossref | GoogleScholarGoogle Scholar | 1:CAS:528:DyaK2sXjt12ls7g%3D&md5=ef8cb201599f8407f259725c29415cf3CAS |
[11] W. Li, L. Shao, Transmission electron microscopy study of aerosol particles from the brown hazes in northern China. Journal of Geophysical Research: Atmospheres 2009, 114(D9), D09302.
| Transmission electron microscopy study of aerosol particles from the brown hazes in northern China.Crossref | GoogleScholarGoogle Scholar |
[12] S. F. Mueller, J. W. Mallard, Q. Mao, S. L. Shaw, Fugitive particulate emissions from a dry coal fly ash disposal. J. Air Waste Manag. Assoc. 2013, 63, 806.
| Fugitive particulate emissions from a dry coal fly ash disposal.Crossref | GoogleScholarGoogle Scholar | 23926850PubMed |
[13] H. Chen, A. Laskin, J. Baltrusaitis, C. A. Gorski, M. M. Scherer, V. H. Grassian, Coal fly ash as a source of iron in atmospheric dust. Environ. Sci. Technol. 2012, 46, 2112.
| Coal fly ash as a source of iron in atmospheric dust.Crossref | GoogleScholarGoogle Scholar | 1:CAS:528:DC%2BC38XnvFynsw%3D%3D&md5=9d85daf29451114ad02105e931b17e4bCAS | 22260270PubMed |
[14] B. G. Kutchko, A. G. Kim, Fly ash characterization by SEM-EDS. Fuel 2006, 85, 2537.
| Fly ash characterization by SEM-EDS.Crossref | GoogleScholarGoogle Scholar | 1:CAS:528:DC%2BD28XnsFGitr0%3D&md5=7305a4020ba9adb6041c4cd3d42782d3CAS |
[15] C. Luo, N. Mahowald, T. Bond, P. Y. Chuan, J. Schauer, Combustion iron distribution and deposition. Global Biogeochem. Cycles 2008, 22, GB1012.
| Combustion iron distribution and deposition.Crossref | GoogleScholarGoogle Scholar |
[16] R. A. Duce, N. W. Tindale, Atmospheric transport of iron and its deposition in the ocean. Limnology and Oceanography 1991, 36, 1715.
| Atmospheric transport of iron and its deposition in the ocean.Crossref | GoogleScholarGoogle Scholar | 1:CAS:528:DyaK38XktFeqtrk%3D&md5=bdb9e6653ac2c9413810e1bbe83ee311CAS |
[17] S. Fan, W. J. Moxim, H. Levy, Aeolian input of bioavailable iron to the ocean. Geophys. Res. Lett. 2006, 33, L07602.
[18] I. Y. Fung, S. K. Meyn, I. Tegen, S. C. Doney, J. G. John, J. K. B. Bishop, Iron supply and demands in the upper ocean. Global Biogeochem. Cycles 2000, 14, 281.
| Iron supply and demands in the upper ocean.Crossref | GoogleScholarGoogle Scholar | 1:CAS:528:DC%2BD3cXhvVGmsrc%3D&md5=5fdc3f75bef22937cd48df1c56cb19e0CAS |
[19] J. H. Martin, S. E. Fitzwater, Iron deficiency limits phytoplankton growth in the north-east Pacific Subarctic. Nature 1988, 331, 341.
| Iron deficiency limits phytoplankton growth in the north-east Pacific Subarctic.Crossref | GoogleScholarGoogle Scholar | 1:CAS:528:DyaL1cXhsVKrtbk%3D&md5=af2f64d796e054540ba7f745d07c12dcCAS |
[20] S. Bonnet, C. Guieu, Dissolution of atmospheric iron in seawater. Geophys. Res. Lett. 2004, 31, L03303.
[21] P. W. Boyd, A. J. Watson, C. S. Law, E. R. Abraham, T. Trull, R. Murdoch, D. C. E. Bakker, A. R. Bowie, K. O. Buesseler, H. Chang, M. Charette, P. Croot, K. Downing, R. Frew, M. Gall, M. Hadfield, J. Hall, M. Harvey, G. Jameson, J. LaRoche, M. Liddicoat, R. Ling, M. T. Maldonado, M. R. McKay, S. Nodder, S. Pickmere, R. Pridmore, S. Rintoul, K. Safi, P. Sutton, R. Strzepek, K. Tanneberger, S. Turner, A. Waite, J. Zeldis, A mesoscale phytoplankton bloom in the polar Southern Ocean stimulated by iron fertilization. Nature 2000, 407, 695.
| A mesoscale phytoplankton bloom in the polar Southern Ocean stimulated by iron fertilization.Crossref | GoogleScholarGoogle Scholar | 1:CAS:528:DC%2BD3cXnsFShtbk%3D&md5=f98c0c1c2cb3d49c0722c3ca64f9e75fCAS | 11048709PubMed |
[22] U. Riebesell, D. A. Wolf-Gladrow, V. Smetacek, Carbon dioxide limitation of marine phytoplankton growth rates. Nature 1993, 361, 249.
| Carbon dioxide limitation of marine phytoplankton growth rates.Crossref | GoogleScholarGoogle Scholar | 1:CAS:528:DyaK3sXhs1Cqurc%3D&md5=df1d56ae1a31bf822f116e5c4d9aeb91CAS |
[23] R. Lal, Carbon sequestration. Phil. Trans. R. Soc. B 2008, 363, 815.
| Carbon sequestration.Crossref | GoogleScholarGoogle Scholar | 1:CAS:528:DC%2BD1cXislGgtbw%3D&md5=43d6ce9ee257ffdb13e693d803b273f7CAS | 17761468PubMed |
[24] K. V. Desboeufs, A. Sofitkitis, R. Losno, L. Colin, P. Ausset, Dissolution and solubility of trace metals from natural and anthropogenic aerosol particulate metal. Chemosphere 2005, 58, 195.
| Dissolution and solubility of trace metals from natural and anthropogenic aerosol particulate metal.Crossref | GoogleScholarGoogle Scholar | 1:CAS:528:DC%2BD2cXhtVahu7rO&md5=b89a81de835e36cf500454a11538f3c7CAS | 15571751PubMed |
[25] H. Chen, V. H. Grassian, Iron dissolution of dust source materials during simulated acidic processing: the effect of sulfuric, acetic, and oxalic acids. Environ. Sci. Technol. 2013, 47, 10312.
| 1:CAS:528:DC%2BC3sXhtFKlsLrF&md5=f271098c83b6aa2734c2603ed4065062CAS | 23883276PubMed |
[26] G. Rubasinghege, L. W. Robert, S. M. Michelle, V. H. Grassian, Simulated atmospheric processing of iron oxyhydroxide minerals at low pH: roles of particle size and acid anion in iron dissolution. Proc. Natl. Acad. Sci. USA 2010, 107, 6628.
| Simulated atmospheric processing of iron oxyhydroxide minerals at low pH: roles of particle size and acid anion in iron dissolution.Crossref | GoogleScholarGoogle Scholar | 1:CAS:528:DC%2BC3cXltFSjsL8%3D&md5=abf28976f925cd5cead420be829774f9CAS | 20360560PubMed |
[27] L. Morawska, J. Zhang, Combustion sources of particles. 1. Health relevance and source signatures. Chemosphere 2002, 49, 1045.
| Combustion sources of particles. 1. Health relevance and source signatures.Crossref | GoogleScholarGoogle Scholar | 1:CAS:528:DC%2BD38Xotlynurk%3D&md5=2bc9480c88a4b624565c56a8f1ed59a7CAS | 12492164PubMed |
[28] D. Cwiertny, J. Baltrusaitis, G. Hunter, A. Laskin, M. M. Scherer, V. H. Grassian, Characterization and acid-mobilization study of iron-containing mineral dust source materials. J. Geophys. Res. 2008, 113, D05202.
| Characterization and acid-mobilization study of iron-containing mineral dust source materials.Crossref | GoogleScholarGoogle Scholar |
[29] A. Iwashita, T. Nakajima, H. Takanashi, A. Ohki, Y. Fujita, T. Yamashita, Determination of trace elements in coal and coal fly ash by joint-use of ICP-AES and atomic absorption spectrometry. Talanta 2007, 71, 251.
| Determination of trace elements in coal and coal fly ash by joint-use of ICP-AES and atomic absorption spectrometry.Crossref | GoogleScholarGoogle Scholar | 1:CAS:528:DC%2BD2sXlsFCjsA%3D%3D&md5=974dcd2f2b33dafdf79fbac33d186c75CAS | 19071296PubMed |
[30] W. C. Keene, R. Sander, A. A. P. Pszenny, R. Vogt, P. J. Crutzen, J. N. Galloway, Aerosol pH in the marine boundary layer: a review and model evaluation. J. Aerosol Sci. 1998, 29, 339.
| Aerosol pH in the marine boundary layer: a review and model evaluation.Crossref | GoogleScholarGoogle Scholar | 1:CAS:528:DyaK1cXis1aqsLk%3D&md5=13d60765711fb270434f2be640c470cfCAS |
[31] J. H. Seinfeld, S. N. Pandis, Atmospheric Chemistry and Physics: From Air Pollution to Climate Change 2006 (Wiley: Hoboken, NJ).
[32] D. C. Harris, Exploring Chemical Analysis, 2nd edn 1997 (WH Freeman and Company: New York, NY).
[33] W. Stumm, G. F. Lee, Oxygenation of ferrous iron. Ind. Eng. Chem. 1961, 53, 143.
| Oxygenation of ferrous iron.Crossref | GoogleScholarGoogle Scholar | 1:CAS:528:DyaF3MXnslymsQ%3D%3D&md5=e522264cd002565adcecb905eb3d5af1CAS |
[34] W. B. Fortune, M. G. Mellon, Determination of iron with o-phenanthroline: a spectrophotometric study. Ind. Eng. Chem. 1938, 10, 60.
| 1:CAS:528:DyaA1cXhslerug%3D%3D&md5=f6d2b7fb731e75b73b5389f6f70564f8CAS |
[35] A. R. Baker, T. D. Jickells, Mineral particle size as a control on aerosol iron solubility. Geophys. Res. Lett. 2006, 33, L17608.
| Mineral particle size as a control on aerosol iron solubility.Crossref | GoogleScholarGoogle Scholar |
[36] J. Heintzenberg, Properties of the log-normal particle size distribution. Aerosol Sci. Technol. 1994, 21, 46.
| Properties of the log-normal particle size distribution.Crossref | GoogleScholarGoogle Scholar |
[37] O. Laskina, H. S. Morris, J. R. Grandquist, Z. Qin, E. A. Stone, A. V. Tivanski, V. H. Grassian, Size matters in the water uptake and hygroscopic growth of atmospherically relevant multicomponent aerosol particles. J. Phys. Chem. A 2015, 119, 4489.
| Size matters in the water uptake and hygroscopic growth of atmospherically relevant multicomponent aerosol particles.Crossref | GoogleScholarGoogle Scholar | 1:CAS:528:DC%2BC2cXitFehs73O&md5=45eae1800652ab0c5e38e4d8ed32924bCAS | 25521409PubMed |
[38] J. W. Mauchly, Significance test for sphericity of a normal n-variate distribution. Ann. Math. Stat. 1940, 11, 204.
| Significance test for sphericity of a normal n-variate distribution.Crossref | GoogleScholarGoogle Scholar |
[39] J. D. Schuttlefield, D. Cox, V. H. Grassian, An investigation of water uptake on clay minerals using ATR-FTIR spectroscopy coupled with quartz crystal microbalance measurements. J. Geophys. Res., D, Atmospheres 2007, 112, D21303.
| An investigation of water uptake on clay minerals using ATR-FTIR spectroscopy coupled with quartz crystal microbalance measurements.Crossref | GoogleScholarGoogle Scholar |
[40] J. Baltrusaitis, C. Usher, V. H. Grassian, Reactions of sulfur dioxide on calcium carbonate single-crystal and particle surfaces at the adsorbed water–carbonate interface. Phys. Chem. Chem. Phys. 2007, 9, 3011.
| Reactions of sulfur dioxide on calcium carbonate single-crystal and particle surfaces at the adsorbed water–carbonate interface.Crossref | GoogleScholarGoogle Scholar | 1:CAS:528:DC%2BD2sXmtVylsbk%3D&md5=82f9f2fdbe699dcac6d7105fb641b0a9CAS | 17551626PubMed |
[41] L. Ferretto, A. Glisenti, Study of the surface acidity of an hematite powder. J. Mol. Catal. Chem. 2002, 187, 119.
| Study of the surface acidity of an hematite powder.Crossref | GoogleScholarGoogle Scholar | 1:CAS:528:DC%2BD38XmsVWiu74%3D&md5=0386c29e3c35c0db797a7dd8b0288d53CAS |
[42] H. D. Lutz, H. Möller, M. Schmidt, Lattice vibration spectra. Part LXXXII. Brucite-type hydroxides M(OH)2 (M = Ca, Mn, Co, Fe, Cd) – IR and Raman spectra, neutron diffraction of Fe(OH)2. J. Mol. Struct. 1994, 328, 121.
| Lattice vibration spectra. Part LXXXII. Brucite-type hydroxides M(OH)2 (M = Ca, Mn, Co, Fe, Cd) – IR and Raman spectra, neutron diffraction of Fe(OH)2.Crossref | GoogleScholarGoogle Scholar | 1:CAS:528:DyaK2MXisFehsLk%3D&md5=60145ae890de99ccf5b80ddbdbcb32cfCAS |
[43] K. L. Konan, C. Peyratout, J.-P. Bonnet, A. Smith, A. Jacquet, P. Magnoux, P. Ayrault, Surface properties of kaolin and illite suspensions in concentrated calcium hydroxide medium. J. Colloid Interface Sci. 2007, 307, 101.
| Surface properties of kaolin and illite suspensions in concentrated calcium hydroxide medium.Crossref | GoogleScholarGoogle Scholar | 1:CAS:528:DC%2BD2sXhtFWjsLY%3D&md5=6f54f4eff01026537ba4f441267345b9CAS | 17174321PubMed |
[44] S. C. White, E. D. Case, Characterization of fly ash from coal-fired power plants. J. Mater. Sci. 1990, 25, 5215.
| Characterization of fly ash from coal-fired power plants.Crossref | GoogleScholarGoogle Scholar | 1:CAS:528:DyaK3MXivFGksg%3D%3D&md5=abcee40e0031a2b1942a4d784e73fe1cCAS |
[45] J. Tomeczek, H. Palugniok, Kinetics of mineral matter transformation during coal combustion. Fuel 2002, 81, 1251.
| Kinetics of mineral matter transformation during coal combustion.Crossref | GoogleScholarGoogle Scholar | 1:CAS:528:DC%2BD38XjtlGitrw%3D&md5=acff3ef4b7736873c007c3d1007545c1CAS |
[46] S. Srinivasachar, J. J. Helble, A. A. Boni, Mineral behaviour during coal combustion 1. Pyrite transformations. Pror. Energy Combust. Sci. 1990, 16, 281.
| Mineral behaviour during coal combustion 1. Pyrite transformations.Crossref | GoogleScholarGoogle Scholar | 1:CAS:528:DyaK3MXitFSgsL4%3D&md5=600e97b476bacdb6eea788a8177b94b3CAS |
[47] B. Zinder, G. Furrer, S. Werner, The coordination chemistry of weathering: II. Dissolution of FeIII oxides. Geochim. Cosmochim. Acta 1986, 50, 1861.
| The coordination chemistry of weathering: II. Dissolution of FeIII oxides.Crossref | GoogleScholarGoogle Scholar | 1:CAS:528:DyaL28XlslKjtb8%3D&md5=7479789fc62f425fcfe56f8f47cbad89CAS |
[48] D. M. B. Lesko, E. M. Coddens, H. D. Swomley, R. M. Welch, J. Borgatta, J. G. Navea, Photochemistry of nitrate chemisorbed on various metal oxide surfaces. Phys. Chem. Chem. Phys. 2015, 17, 20775.
| Photochemistry of nitrate chemisorbed on various metal oxide surfaces.Crossref | GoogleScholarGoogle Scholar | 1:CAS:528:DC%2BC2MXht1Sqt7zI&md5=092fd2d4b887084d5761b87a359f57c3CAS |
[49] C. K. Remucal, D. L. Sedlak, The role of iron coordination in the production of reactive oxidants from ferrous iron oxidation by oxygen and hydrogen peroxide, in Aquatic Redox Chemistry (Ed. Paul G. Tratnyek, Timothy J. Grundl, Stefan B. Haderlein) 2011, Vol. 1071, p. 177 (American Chemical Society: Washington, DC).
[50] B. Srinivas, M. M. Sarin, A. Kumar, Impact of anthropogenic sources on aerosol iron solubility over the Bay of Bengal and the Arabian Sea. Biogeochemistry 2012, 110, 257.
| Impact of anthropogenic sources on aerosol iron solubility over the Bay of Bengal and the Arabian Sea.Crossref | GoogleScholarGoogle Scholar | 1:CAS:528:DC%2BC38XhsVCjt7bM&md5=32b863ede2c1a8597099aa87d34e1edeCAS |
[51] C. R. Usher, A. E. Michel, V. H. Grassian, Reactions on mineral dust. Chem. Rev. 2003, 103, 4883.
| Reactions on mineral dust.Crossref | GoogleScholarGoogle Scholar | 1:CAS:528:DC%2BD3sXovVOjtbk%3D&md5=a9759c1b20d5eb76d1fb8dd9e9a76549CAS | 14664636PubMed |
[52] J. Borgatta, G. Navea, Fate of aqueous iron leached from tropospheric aerosols during atmospheric acidic processing: study of the effects of humic-like substances. WIT Transactions of Ecology and the Environment 2015, 198, 155.
| Fate of aqueous iron leached from tropospheric aerosols during atmospheric acidic processing: study of the effects of humic-like substances.Crossref | GoogleScholarGoogle Scholar | 1:CAS:528:DC%2BC28Xos1SltLs%3D&md5=2f05bb468808803a37d39d3603207d6fCAS |
[53] H. A. Al-Abadleh, Review of the bulk and surface chemistry of iron in atmospherically relevant systems containing humic-like substances. RSC Adv. 2015, 5, 45785.
| Review of the bulk and surface chemistry of iron in atmospherically relevant systems containing humic-like substances.Crossref | GoogleScholarGoogle Scholar | 1:CAS:528:DC%2BC2MXnslOqtL4%3D&md5=3deac88b67c6938e6e65675182e8a1acCAS |
[54] J. G. Navea, H. Chen, M. Huang, G. R. Carmichel, V. H. Grassian, A comparative evaluation of water uptake on several mineral dust sources. Environ. Chem. 2010, 7, 162.
| A comparative evaluation of water uptake on several mineral dust sources.Crossref | GoogleScholarGoogle Scholar | 1:CAS:528:DC%2BC3cXlsFeltbs%3D&md5=708ff263ca3dbcdcd83748bd5d841f2dCAS |
[55] J. Madejová, P. Komadel, Baseline studies of the clay minerals society source clays: infrared methods. Clays Clay Miner. 2001, 49, 410.
| Baseline studies of the clay minerals society source clays: infrared methods.Crossref | GoogleScholarGoogle Scholar |
[56] H. Namduri, S. Nasrazadi, Quantitative analysis of iron oxides using Fourier-transform infrared. Corros. Sci. 2008, 50, 2493.
| Quantitative analysis of iron oxides using Fourier-transform infrared.Crossref | GoogleScholarGoogle Scholar | 1:CAS:528:DC%2BD1cXhtFersr3I&md5=993f50bbede3de790c4143777074fcfdCAS |