

Occurrence of fluorotelomer alcohols at two Alpine summits: sources, transport and temporal trends
Zhenlan Xu A B C E , Lingxiangyu Li D , Bernhard Henkelmann B and Karl-Werner Schramm B C EA Institute of Quality and Standard of Agro-Products, Zhejiang Academy of Agricultural Sciences, Hangzhou 310021, China.
B Helmholtz Center Munich – National Research Center for Environmental Health (GmbH), Molecular EXposomics (MEX), Ingolstädter Landstr.1, Neuherberg D85764, Germany.
C Technische Universität München, Wissenschaftszentrum Weihenstephan für Ernährung und Landnutzung, Department für Biowissenschaften, Weihenstephaner Steig 23, Freising D85350, Germany.
D School of Sciences, Zhejiang Sci-Tech University, Hangzhou 310018, China.
E Corresponding authors. Email: xuzhenlan330@163.com; schramm@helmholtz-muenchen.de
Environmental Chemistry 14(4) 215-223 https://doi.org/10.1071/EN16190
Submitted: 22 November 2016 Accepted: 14 April 2017 Published: 8 May 2017
Journal Compilation © CSIRO Publishing 2017 Open Access CC BY-NC-ND
Environmental context. The transport and fate of organic pollutants such as fluorotelomer alcohols (FTOHs) in the atmosphere affect their risks to the environment and human health. On the basis of hourly trajectory predictions, we found that, from 2007 to 2010, individual levels of 6:2, 8:2 and 10:2 FTOH were from non-detectable to 72.4 pg m–3 at two Alpine summits. Air mass origin was an important factor determining the Alpine atmospheric FTOH levels.
Abstract. The transport and fate of fluorotelomer alcohols (FTOHs) in the atmosphere affect their risks to the environment and human health. In this study, we aimed to investigate the sources, transport and temporal variations of FTOHs (6:2, 8:2 and 10:2 FTOH) at two Alpine summits (Sonnblick and Zugspitze). The active air sampler consisting of four XAD cartridges was applied to collect FTOHs from 2007 to 2010. Four separate cartridges were assigned for four air flow regimes (three European sectors and one mixed source origin), and switched and controlled on the basis of an hourly trajectory prediction. FTOH (6:2, 8:2 and 10:2) was measured with individual concentrations ranging from less than the limit of detection to 72.4 pg m–3. Also, 8:2 FTOH was the dominant compound, accounting for 41–72 % of the total FTOH (ΣFTOH) concentration. Significant differences were not observed in FTOH concentrations between Sonnblick and Zugspitze since the two sites are relatively close compared with the geographic extent of the area studied. Air-flow regime was an important factor determining the atmospheric FTOH levels. Particularly at Zugspitze, air mass from the NE (regions north-east of the Alps) showed the highest median ΣFTOH concentration (36.9 pg m–3), followed by S (the Po basin in Italy), NW (regions north-west of Alps) and M (mixed source origin, polar regions or high altitudes). Furthermore, the seasonal variation in FTOH concentrations was not correlated with the site temperatures, but was dependent on the wind speed. Overall, the results indicated low FTOH concentrations at these two Alpine summits compared with European populated cities and provided important information for understanding the fate of FTOHs in the Alpine atmosphere.
Introduction
Long-chain perfluorinated carboxylates (PFCA), such as perfluorooctanoate (PFOA), are characterised by their extreme persistence,[1,2] potential of bioaccumulation[3–5] and toxicity.[6,7] They have been found ubiquitously in various environmental compartments. The observation of PFCAs in snow, sediment and biota from the Arctic has drawn scientific attention to the mechanisms as to how these chemicals transport to remote areas.[2,3,8] It is proposed that volatile polyfluorinated precursors, such as fluorotelomer alcohols (FTOH) could be atmospherically transported to remote regions and transformed to PFCAs.[9–12] There are many field observations and laboratory evidence in support of this assumption, including the detection of the precursors in remote atmosphere,[3,8,12,13] smog chamber degradation studies[14] and modelling calculations.[15]
FTOHs are applied in a variety of products, e.g. to repel water and dirt on carpets and furniture, etc., and they are released into the environment intentionally or accidentally during the production, use and disposal of fluorotelomer-derived products.[16–18] Normally, their atmospheric lifetimes are approximately ~20 days.[19] Thus, they can undergo long-range atmospheric transport (LRAT) and reach remote–mountainous regions.[3,8,12,13] FTOHs have been detected in the atmosphere over the Atlantic Ocean,[20] the Arctic,[13,21,22] Greenland,[23] the Canadian Rocky and Purcell mountains[24] and Mount Bachelor, Oregon.[25] The Alps are situated in the centre of Europe, and its summits are regarded to be domains for investigating the LRAT of pollution since they are far from industrial and domestic areas. Semi-volatile organic pollutants are normally transported via the atmosphere to the Alpine area.[26–28] However, there are no studies investigating the occurrences and temporal trends of FTOHs in the Alpine atmosphere, which restricts our comprehensive understanding of their risks to human and environmental health. In particular, PFCAs have been detected in Alpine lake sediment.[9] Thus, it is of importance to explore the occurrence of FTOHs in the Alpine atmosphere, which is helpful in understanding the contribution of airborne FTOHs to the existence of PFCAs in the Alpine environment.
Measurements of FTOHs combined with back trajectory analysis for tracking the air mass history have been applied to identify the potential source areas of FTOHs at the receptor sites.[21,25,29,30] Shoeib et al.[20] found that the elevated FTOH concentrations in GOMECC samples (Gulf of Mexico and East Coast Carbon Cruise) were attributed to land-based sources. Dreyer et al.[30] determined the origins of airborne FTOHs at Barsbüttel regions in the south-west and west of Hamburg with a high density of population and industries. However, in the air backward trajectory analysis, the occurrence of overlaying trajectories was enhanced with the increase in backward time, which made the spatial definition unreliable.[27] Herein, a novel sampling method depending on the air trajectory prediction was developed to investigate the LRAT of semi-volatile organic compounds (SVOCs).[28]
In this study, the sampling method established by Offenthaler et al.[28] was applied to study the occurrences of FTOH at two alpine summits (Sonnblick and Zugspitze). On the basis of an hourly trajectory prediction, air masses arriving from the NW (areas to the north-west of the Alps, including Germany, Great Britain, Belgium and the Netherlands), NE (areas in the north-east of Alps, including the Czech Republic, Slovakia and Poland), S (the Po basin in the Italy) and M (the mixed origin, air mass moving from the Atlantic or the Arctic, or descending from high altitudes) were sampled separately, and analysed for 6:2, 8:2 and 10:2 FTOH. The purpose was to identify the potential source regions for FTOHs at two alpine summits, and to quantitatively evaluate the FTOH levels in air masses arriving from those different potential source regions. Seasonal variations of FTOH concentrations in air masses from four trajectories were also investigated.
Experimental
Standards and chemicals
Native analytical standards of FTOH (6:2, 8:2 and 10:2 FTOH, purity 97 %) were purchased from Fluorochem (Old Glossop, UK). All mass-labelled FTOH standards (purity 98 %): 2-perfluorohexyl-[1,1-2H2]-[1,2-13C2]-ethanol (mass-labelled 6:2 FTOH), 2-perfluorooctyl-[1,1-2H2]-[1,2-13C2]-ethanol (mass-labelled 8:2 FTOH) and 2-perfluorodecyl-[1,1-2H2]-[1,2-13C2]-ethanol (mass-labelled10:2 FTOH) were purchased from Wellington (Laboratories Guelph, Ontario, Canada). Fluorinated alcohol (9:2) (9:2 FA, purity 98 %) was purchased from Fluorochem (Old Glossop, UK). Acetone, n-hexane, dichloromethane and pentane (all picograde quality) were purchased from LGC-Standards (Wesel, Germany).
Active air sampling
Sampling sites
Sampling sites were selected focussing on remoteness within the investigated region of the Alps, and they were Zugspitze (Germany, 10°59′E, 47°25′N, 2650 m above sea level) and Sonnblick (Austria, 12°58′E, 47°03′N, 3100 m above sea level) as displayed in Fig. 1. Zugspitze belongs to the Wetterstein Mountains in the Northern Limestone Alps and is a border mountain between Austria and Germany. The distance between Zugspitze and the northernmost mountain range of the Bavarian Alps is ~20 km. The Sonnblick is a peak of the Austrian Central Alps and is situated 70 km from the Austrian Alpine foothills and 80 km from the southernmost mountain range of the Venetian Alps (Italy).[31] The sampling sites are not accessible for tourists, only for technical staff.

|
Samplers and source regions
An active air sampling device as described in a publication of Offenthaler et al.[28] was used in this study. Low volume samplers (flow rate: 3 m3 h–1; DigitelEnviro-Sense, Hegnau, Switzerland) were used, which comprised four XAD cartridges (XAD-2 resin, 50 g) and for each XAD cartridge, there was a glass fibre filter (GF8, Ø = 45 mm). Four XAD cartridges were switched among four origins depending on daily trajectory forecasts to obtain information on the geographic origin of the collected pollutants. The general scheme of the active air sampler is shown in Fig. S1 (Supplementary material). Cartridges were controlled and rotated physically according to the forecasts which were sent to the samplers via the internet. Three European sectors and one mixed origin were differentiated, and they were (1) areas north-west of the Alps (denoted by NW), including Germany, Great Britain, Belgium and the Netherlands, (2) areas north-east of the Alps (denoted by NE), including the Czech Republic, Slovakia and Poland, (3) the Po basin in Italy (denoted by S) and (4) the mixed origin (denoted by M) indicating the air masses having a residence time of less than 2–3 days over any regions before the sampling site, and these were typically fast air masses moving from the Atlantic or the Arctic or descending from high altitudes.[28] The status such as the cartridge in operation, temperature and sampling air volume was recorded and retrieved as required. The sampling campaign was initiated in 2007 and ended in 2010. Generally, each cartridge was deployed for three months. However, adverse weather conditions made this not always possible. Sampling periods are listed in Table S1 (Supplementary material). The temperature and frequency of the air flow regimes NW, NE, S and M as a percentage of the total sampling period at two sites are presented in Table S2 (Supplementary material). Field blanks were sealed XAD cartridges stored next to the sampling cartridges for the same period. In total, 17 field blanks corresponding to 17 periods and 68 air samples (17 periods and 4 source regions) were collected.
Trajectory prediction and evaluation
Trajectories were predicted daily at a resolution of one hour. Forecasts combined expert meteorological prognosis with the predictions of two numerical trajectory models: ECMWF (European Centre for Medium-Range Weather Forecasts) and ALADIN (Numerical Weather Prediction Project). The subsequent inspection of the trajectories of air actually collected by each cartridge was performed to evaluate the accuracy of forecasts, i.e. air masses from certain origin when the corresponding filter was in operation.[28]
Breakthrough experiment
For 6:2, 8:2 and 10:2 FTOH, tests of breakthrough in the active air sampling were carried out indoors at the Helmholtz Center Munich, Munich, Germany, where FTOHs were detected. A filter unit with a glass fibre filter (GF8, Ø = 45 mm), a first cartridge with 50 g of XAD-2 (equivalent to a normal sample) and a second cartridge with 50 g of XAD-2 (collecting compounds that have a breakthrough) were connected in line. The room temperature was in the range of 22–24 °C. The sampling air volume was 1061 m3 after 13 days with an approximate flow rate of 3.4 m3 h–1. The filter, first cartridge and second cartridge were extracted separately in order to determine the distribution of FTOHs among these three parts and to calculate the breakthrough rates. One field blank, a cartridge with 50 g of XAD-2, was shipped to the sampling room and shipped back to the laboratory.
Extraction and clean-up methods
The XAD-2 cartridge with a glass fibre filter was Soxhlet extracted with n-hexane–acetone (volume ratio of 3 : 1) for 24 h. The extract was concentrated to 2 mL, and 1 mL of the extract was used for FTOH analysis except for eight samples collected in 2007 (only 0.5 mL of the extract was used). They were kept frozen at –20 °C until further analysis. When analysed, the concentrated extract was first fortified with mass-labelled FTOH standards, and cleaned by silica gel. The self-made silica gel cartridge (500 mg, heated at 550 °C overnight and deactivated with 10 % H2O, Wesel Germany, grade 60) was initially conditioned with 10 mL of pentane–dichloromethane (1 : 1) and 10 mL of hexane. The sample was then loaded onto the cartridge, followed by 6 mL of pentane for washing, and finally FTOHs were eluted with 10 mL of pentane–dichloromethane (1 : 1). The eluate was concentrated to 25 µL under a gentle flow of N2. Prior to analysis by gas chromatography–mass spectrometry (GC-MS), 10 µL of internal standard 9:2 FA (2.5 ng µL–1) was added. In each batch, one procedure blank was prepared and analysed in the same way as the air samples.
Instrumental analysis
FTOHs were measured using a HP 5890 Series II gas chromatograph (Agilent Technologies, Waldbronn, Germany) coupled with a Finnegan MAT SSQ 7000 mass selective detector (Thermo Scientific, Germany). The gas chromatograph was equipped with a 5-m Rxi guard column (0.53-mm inner diameter, Restek, Bad Homburg, Germany) followed by a 30-m SUPELCOWAX analysis column (0.25-mm inner diameter, 0.25-μm film thickness, Supelco, Bellefonte, PA). A 1-µL aliquot of the sample was injected in splitless mode at 250 °C. The oven temperature program was as follows: initial temperature 50 °C, held for 1 min, heated at 3 °C min–1 to 80 °C, heated at 10 °C min–1 to 140 °C, held for 4 min, heated at 20 °C min–1 to 260 °C, and then held for 15 min. The carrier gas was helium. The mass spectrometer system was operated in positive chemical ionisation (PCI) mode, and methane was used as the reagent gas. Selected-ion monitoring (SIM) was applied for data acquisition and the m/z monitored is listed in Table S3 (Supplementary material).
Calculations and statistical analysis
The air volume reported in this work was converted into the equivalent volume under the standard state (0 °C, 101.325 kPa). The breakthrough rate was calculated as the ratio of the amounts of FTOH captured by the back cartridge to those by the master cartridge and back cartridge. The limit of detection (LOD) was a value corresponding to a signal-to-noise ratio of 3 (s/n = 3). For analytes with no blank contamination, the method detection limit (MDL) was defined as the same as the LOD. When blank contamination was detected, the MDL was estimated as the mean blank value plus three times the standard deviation (MDL = mean blank value + 3 × s.d.). Values lower than the LOD or MDL were set as LOD/sqrt(2) or MDL/sqrt(2) in the calculation. Peak height was used to calculate the ratio of mass-labelled FTOH to 9:2 FA in either samples or calibration standard, and then the recovery of mass-labelled FTOHs was estimated by using the values. The SPSS 16.0 software was used for statistical analysis. A Shapiro-Wilk test was used to test the normality of the dataset. In order to investigate bivariate relationships, the Spearman Rank correlation was applied on the non-normally distributed data. Datasets of FTOH concentrations were normally distributed when log-transformed, and a t-test was applied to determine whether concentrations differed significantly between sampling sites and air mass origins. A significance level of P = 0.05 was applied.
Results and discussion
Method validation
The isotope dilution method was applied to quantify FTOHs as described in our previous study.[32] Field blanks and procedure blanks were performed to track the contamination of FTOHs during air sampling, handling and treatment. 6:2 FTOH was not detected in procedure blanks (n = 11) and field blanks (n = 17). 8:2 and 10:2 FTOH were detected in procedure and field blanks with detection rates of 18–54 %. 8:2 and 10:2 FTOH in field blanks were comparable with those measured in procedure blanks (Table S4, Supplementary material), indicating that the contamination of field blanks was not due to the sampling or sample handling. Average 8:2 FTOH in field blanks and procedure blanks was measured at 1.0 and 1.2 pg m–3, respectively, while average 10:2 FTOH was 0.5–0.6 pg m–3 (Table S4). However, the concentrations of 8:2 and 10:2 FTOH observed in blanks were generally less than 10 % of the sample values in the same batch. The LODs for 6:2, 8:2 and 10:2 FTOH (sampling volume of 750 m3 used) were 0.8, 0.3 and 0.2 pg m–3, respectively. The MDLs for 8:2 and 10:2 FTOH (sampling volume of 750 m3 used) were 1.0 and 0.5 pg m–3, respectively. FTOH concentrations reported in this study were blank corrected by subtracting the procedure blank value from the sample value.
The mean recoveries (standard deviations) of mass-labelled 6:2, 8:2 and 10:2 FTOH in samples (n = 86, 11 of procedure blanks, 17 of field blanks and 58 air samples) were 55 ± 11, 67 ± 9 and 80 ± 15 %, respectively. Since mass-labelled FTOH standards were spiked in the concentrated extracts, the loss of FTOH during the Soxhlet extraction and the first solvent evaporation was not included. Herein, two blanks were performed with mass-labelled FTOHs spiked before the Soxhlet extraction, to evaluate the FTOH losses during the whole procedure, including the extraction and the first solvent evaporation. The mean recoveries of mass-labelled 6:2, 8:2 and 10:2 FTOH were 35, 55 and 98 %, respectively. The recoveries of 6:2 FTOH of these two blanks were slightly lower than those obtained in air samples, which may lead to the underestimation of atmospheric concentrations of 6:2 FTOH.
The breakthrough of FTOH was assessed by comparing the vapour pressure over the subcooled liquid (log PL) and log KOA values of FTOHs to those compounds (polycyclic aromatic hydrocarbons (PAHs) and organochlorine pesticides (OCPs)) whose breakthrough at field were available. For various PAH and OCP analogues, the breakthrough was negligible at field when the air sampling volume was up to 1789 m3 (Table S5, Supplementary material). Naphthalene is the most volatile compound with log PL and log KOA values of 1.60 and 5.19,[33] respectively. The comparable log PL and log KOA values of 6:2, 8:2 and 10:2 FTOH were –0.70–1.26[34] and 5.26–5.72,[35,36] respectively, which implies that the breakthrough of FTOHs during field air sampling was also negligible. Moreover, a breakthrough experiment was conducted indoor at a temperature of 22–24 °C, which gave breakthrough rates of 18, 11 and 5 % for 6:2, 8:2 and 10:2 FTOH, respectively. The breakthrough of FTOHs in the field sampling for most samples was expected to be insignificant due to the low temperature at the Sonnblick and Zugspitze sites (Table S2), and smaller sampling air volumes than that in the breakthrough experiment. However, 10 samples with a sampling volume above 1061 m3 were excluded from data analysis due to uncertainty in concentrations of analyte that resulted from the potential breakthrough.
Air-flow regime frequency
Thirty two air samples from Sonnblick and 26 samples from Zugspitze collected from June 2007 to July 2010 were analysed for 6:2, 8:2 and 10:2 FTOH. The subsequent examination proved that the trajectory predictions were accurate. However, the construction at sampling stations, hardware failures, power outages and computer program faults reduced the measurement hours. The percentage of the total sampling period was listed in Table S2 with a median value of 83 %. The Zugspitze and Sonnblick sites were mainly influenced by the S source region (median: 38 and 35 %) and the NW source region (median: 23 and 29 %), whereas few air masses were from the NE source region (median: 13 and 14.5 %).
FTOH concentrations
In this study, the filter and cartridge were extracted by Soxhlet extraction together, and the concentrations presented were the sum of gaseous and particle-bound FTOHs, although FTOHs were predominantly in the gas phase rather than the particle-bound phase.[29,30,37–39] At Sonnblick, the frequencies of detection above the MDLs and LODs for 6:2, 8:2 and 10:2 FTOH were 76, 92 and 92 %, respectively. At Zugspitze, all samples contained 8:2 and 10:2 FTOH whereas in 78 % of the samples 6:2 FTOH was determined. FTOHs were not detected mainly in the samples collected during June–October in 2007, which might be caused by the low fraction of the extract used in the analysis. Twenty five percent of the extract was analysed for samples from June–October in 2007 in comparison to 50 % for others. The high detection frequency indicated the ubiquitous occurrences of FTOHs in the Alpine atmospheric environment. The total FTOH concentrations in air ranged from 3.6 to 109 pg m–3 at Zugspitze and from not detected to 36.1 pg m–3 at Sonnblick. 8:2 FTOH was found to be the dominant compound, constituting 41–72 % of the total FTOHs at both sites, which is consistent with the observations in European air masses,[29,30,37] the Asian air mass[25,40] and the Arctic air mass.[13,21]
Fig. 2 shows an overview of the distribution of FTOH concentrations in the air masses from four potential source regions (NW, NE, S and M). At Zugspitze, FTOH concentrations of two samples from NE are evidently high (20.3 pg m–3 of 6:2 FTOH, 62.0–72.4 pg m–3 of 8:2 FTOH and 26.7–28.5 pg m–3 of 10:2 FTOH) compared with other samples. Thus, median concentrations were used to track the FTOH variations among NW, NE, S and M. Air masses from NE resulted in the highest median ΣFTOH concentration (36.9 pg m–3), followed by S, NW and M. For individual compounds, medians of NE were 4.9 pg m–3 for 6:2 FTOH, 22.9 pg m–3 for 8:2 FTOH, and 6.8 pg m–3 for 10:2 FTOH, which were 2–30 times higher than those of M. At Sonnblick, the highest median of ΣFTOH was observed in the air masses from NW (Fig. 2) with the concentration of 15.4 pg m–3. However, statistical analysis showed that there were no significant differences in FTOH concentrations distributed among four trajectories (t-test, P > 0.05).

|
FTOH levels are evidently lower than those reported in the corresponding potential source regions, such as 55–980 pg m–3 in Barsbüttel (during April 2007–June 2008), Germany,[29,30,41] 527 pg m–3 in Manchester (during February 2005–March 2006), UK,[37] 194 pg m–3 in Hamburg and 146 pg m–3 in Waldhof (in spring 2005), Germany,[38,39] indicating the reduction of FTOH levels in air flows when undergoing LRAT. The reduction is probably due to the dilution within the air masses. The forest filter effect of the Alps was observed for compounds such as polychlorinated biphenyls (PCBs),[42] while it was probably not applicable to FTOHs. There was little forest filter effect for compounds with log KOA < 7,[43] and the log KOA of FTOH fell in this range with values of 5.26–5.72.[35,36] This is also supported by the investigation that FTOHs could not be detected in the spruce needle samples implying a low tendency for FTOH to partition to needle surfaces.[44]
At the Zugspitze site, the variable median values of FTOH among NW, NE, S and M indicated that the air mass origin was an important factor influencing the levels of atmospheric FTOH. High population and industrialised areas in sectors of NW and NE, such as the UK, France, Belgium, Germany, the Netherlands and Poland[45] might result in the elevated FTOH levels in corresponding air flows. In particular, the air mass from the NE of Zugspitze and from the NW of Sonnblick showing high FTOH concentrations may be due to the fluoropolyer manufacturer in Burghausen, Bavaria, Germany, which is located to the NW of Sonnblick and NE of Zugspitze. It was not surprising that the air mass from M showed the lowest FTOH concentrations, since M comprised of high speed air masses from the Atlantic or the Arctic, or great heights.[27,28] Overall, our observation of elevated FTOH levels in air masses from densely populated and industrialised areas and low FTOH levels in air masses from the Atlantic or the Arctic is in agreement with the reports by Jahnke et al.[38,39] and Dreyer et al.[29,30] However, at Sonnblick, the variability of FTOHs in the air masses from four air flow regimes was not so pronounced compared with those at the Zugspitze site. These results imply that not only the air mass origins but also other factors, for instance climate such as precipitations and valley wind systems, may affect atmospheric FTOH concentrations. Wet depositions of FTOH dependent on the amount of precipitation may lead to reduced atmospheric FTOH concentrations. FTOHs released from regions nearby the Alps might be transported into the valleys, and then from the valley floor up to the slopes by valley and slope wind systems;[46] however these effects cannot be separated from those of large scale transport of air masses. For the majority of analytes, arithmetic concentration means and median values were slightly higher at the Zugspitze site than the Sonnblick site; however, there was no significant differences (t-test, P > 0.05) since the two observation sites are relatively close compared with the geographic extent of the area studied, and the trajectory predictions did not show substantial differences.[27,28]
Seasonal variations
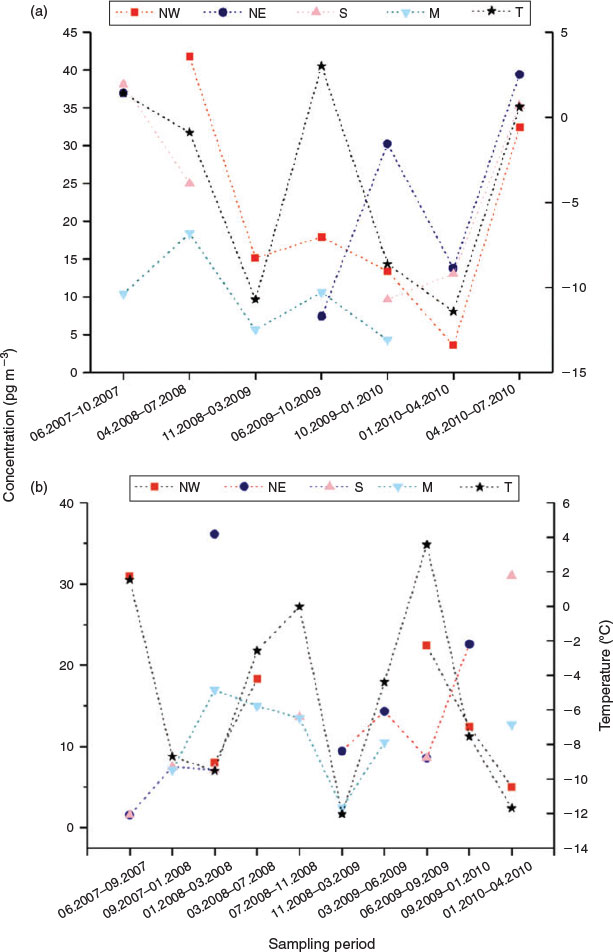
Sampling periods generally covering 3–4 months were attributed to the warm and cool half of the year (summer and winter) based on the calendar data. The variation of FTOH concentrations in four air flow regimes over sampling periods is shown in Figs S2 and S3. At Zugspitze, take air mass from NE as an example, the highest FTOH concentrations were generally observed in periods of April–July in 2008 and November 2008 to March 2009 with levels of 20.4–72.2 pg m–3 for three individuals (Fig. S2). At Sonnblick, also taking NE as an example, the highest FTOH levels were generally found in the period of January–March 2008 with values of 5.5–23.4 pg m–3 for three individuals, and the lowest FTOH concentrations were measured in June–September 2009 with levels of 0.6–4.1 pg m–3 (Fig. S3). No obvious seasonal tendency was observed partly due to the interrupted time course. Many other factors could affect seasonal variations of atmospheric FTOH concentrations, such as deposition, temperature and radicals. High temperatures of –7.8 to 15.2 °C in summer compared with –20.1 to 1.4 °C in winter (Table S2) increased the emissions of FTOHs from diffusive sources,[29,30] which could lead to the high FTOH concentrations in summer. On the other hand, slowed degradation by OH radicals in winter due to the reduced concentrations of OH radicals[47] could lead to increased FTOH levels.
Fig. 3 shows the time courses of ΣFTOH concentrations and site temperatures. Correlation analysis showed that ΣFTOH and individual FTOH concentrations were not significantly correlated with temperatures at both sites (Spearman Rank correlation, P > 0.05). The non-correlation between FTOH concentrations and site temperatures was also observed by Piekarz et al.[25] It contradicted the observations of Jahnke et al.[39] and Dreyer et al.[29] Wania et al.[48] modelled the relations between site temperatures and atmospheric concentrations of volatile organic compounds, and pointed out that the independence of air concentrations on site temperatures was indicative that air concentrations were controlled by LRAT. Clearly, the independence of FTOH concentrations in air masses on the site temperatures implied that the concentrations of FTOH at two Alpine summits were mainly governed by LRAT.
|
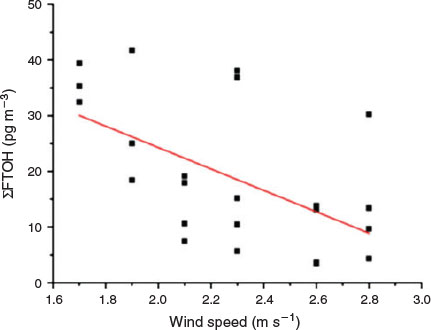
At Zugspitze, ΣFTOH was significantly negatively correlated with the wind speed (Fig. 4, r = 0.51, P < 0.05), which implied that high wind speed representing the short residence time of the air parcel at the potential source regimes led to the low FTOH concentrations.
|
Conclusions
This study provided important information about the contribution of airborne FTOHs to their occurrence in the atmosphere of the German and Austrian Alpine summits. The atmospheric FTOH levels were related to the air mass origin; at Zugspitze, air mass from the NE showed the highest median ΣFTOH concentration, while at Sonnblick the highest value was observed in air mass from the NW. Moreover, the changes in seasonal FTOH concentrations were correlated with the wind speed, but independence of site temperatures. Given the fact that PFOA has been detected in the Alpine deposition samples,[44] it is important to further investigate the contribution of airborne FTOHs to the deposition of PFOA in Alps in future work.
Supplementary material
Sampling details and FTOH concentration details in blanks are available from the Journal’s website.
Acknowledgement
This research was funded by the Bayerisches Landesamt für Umwelt (FKZ 16-8733.3-37683/2008). We also thank Mr Neumann as a representative of Umweltforschungsstation Schneefernerhaus for his support at the sampling sites and the anonymous reviewers for helpful comments and suggestions.
References
[1] O. S. Arvaniti, A. S. Stasinakis, Review on the occurrence, fate and removal of perfluorinated compounds during wastewater treatment. Sci. Total Environ. 2015, 524–525, 81.| Review on the occurrence, fate and removal of perfluorinated compounds during wastewater treatment.Crossref | GoogleScholarGoogle Scholar |
[2] Z. Wang, Z. Xie, A. Möller, W. Mi, H. Wolschke, R. Ebinghaus, Atmospheric concentrations and gas/particle partitioning of neutral poly- and perfluoroalkyl substances in northern German coast. Atmos. Environ. 2014, 95, 207.
| Atmospheric concentrations and gas/particle partitioning of neutral poly- and perfluoroalkyl substances in northern German coast.Crossref | GoogleScholarGoogle Scholar | 1:CAS:528:DC%2BC2cXht1Cns77L&md5=7d3940c741c85166504cc9bdf5e9d08aCAS |
[3] C. M. Butt, U. Berger, R. Bossi, G. T. Tomy, Levels and trends of poly- and perfluorinated compounds in the arctic environment. Sci. Total Environ. 2010, 408, 2936.
| Levels and trends of poly- and perfluorinated compounds in the arctic environment.Crossref | GoogleScholarGoogle Scholar | 1:CAS:528:DC%2BC3cXntV2isL0%3D&md5=8f5c704f3ab56208953258599493a39aCAS |
[4] Y. Gao, J. Fu, H. Cao, Y. Wang, A. Zhang, Y. Liang, T. Wang, C. Zhao, G. Jiang, Differential accumulation and elimination behavior of perfluoroalkyl acid isomers in occupational workers in a manufactory in China. Environ. Sci. Technol. 2015, 49, 6953.
| Differential accumulation and elimination behavior of perfluoroalkyl acid isomers in occupational workers in a manufactory in China.Crossref | GoogleScholarGoogle Scholar | 1:CAS:528:DC%2BC2MXnsVantLc%3D&md5=6b54d2e0359a86560ebac5593850bae7CAS |
[5] R. A. Hoke, B. D. Ferrell, T. Ryan, T. L. Sloman, J. W. Green, D. L. Nabb, R. Mingoia, R. C. Buck, S. H. Korzeniowski, Aquatic hazard, bioaccumulation and screening risk assessment for 6:2 fluorotelomer sulfonate. Chemosphere 2015, 128, 258.
| Aquatic hazard, bioaccumulation and screening risk assessment for 6:2 fluorotelomer sulfonate.Crossref | GoogleScholarGoogle Scholar | 1:CAS:528:DC%2BC2MXisVOktrs%3D&md5=6570141ec4ac4930880e4195a0e81cb9CAS |
[6] C. Lau, K. Anitole, C. Hodes, D. Lai, A. Pfahles-Hutchens, J. Seed, Perfluoroalkyl acids: a review of monitoring and toxicological findings. Toxicol. Sci. 2007, 99, 366.
| Perfluoroalkyl acids: a review of monitoring and toxicological findings.Crossref | GoogleScholarGoogle Scholar | 1:CAS:528:DC%2BD2sXhtFKru7%2FI&md5=4ca05dfcad62931b405b4f99305d8457CAS |
[7] M. H. Russell, M. W. Himmelstein, R. C. Buck, Inhalation and oral toxicokinetics of 6:2 FTOH and its metabolites in mammals. Chemosphere 2015, 120, 328.
| Inhalation and oral toxicokinetics of 6:2 FTOH and its metabolites in mammals.Crossref | GoogleScholarGoogle Scholar | 1:CAS:528:DC%2BC2cXhsVSqsbzI&md5=7ecc633c996ad9e1054aa2d92d584633CAS |
[8] Z. Xie, Z. Wang, W. Mi, A. Möller, H. Wolschke, R. Ebinghaus, Neutral poly-/perfluoroalkyl substances in air and snow from the Arctic. Sci. Rep. 2015, 5, 8912.
| Neutral poly-/perfluoroalkyl substances in air and snow from the Arctic.Crossref | GoogleScholarGoogle Scholar | 1:CAS:528:DC%2BC2MXotlWqtbw%3D&md5=3242d226c8414862996671170a3abe27CAS |
[9] J. P. Benskin, V. Phillips, V. L. St. Louis, J. W. Martin, Source elucidation of perfluorinated carboxylic acids in remote Alpine lake sediment cores. Environ. Sci. Technol. 2011, 45, 7188.
| Source elucidation of perfluorinated carboxylic acids in remote Alpine lake sediment cores.Crossref | GoogleScholarGoogle Scholar | 1:CAS:528:DC%2BC3MXpvVyhtb8%3D&md5=a16ba40385ceeb15f49dd6e9be61ba49CAS |
[10] J. Li, S. D. Vento, J. Schuster, G. Zhang, P. Chakraborty, Y. Kobara, K. C. Jones, Perfluorinated compounds in the Asian atmosphere. Environ. Sci. Technol. 2011, 45, 7241.
| Perfluorinated compounds in the Asian atmosphere.Crossref | GoogleScholarGoogle Scholar | 1:CAS:528:DC%2BC3MXhtVWntrfN&md5=5893f87edafa64478db6630b360399fcCAS |
[11] K. Prevedouros, I. T. Cousins, R. C. Buck, S. H. Korzeniowski, Sources, fate and transport of perfluorocarboxylates. Environ. Sci. Technol. 2006, 40, 32.
| Sources, fate and transport of perfluorocarboxylates.Crossref | GoogleScholarGoogle Scholar | 1:CAS:528:DC%2BD2MXht1Gru7zK&md5=47e84f896a239d4c19bef2fba2efcfa5CAS |
[12] M. Shoeib, T. Harner, P. Vlahos, Perfluorinated chemicals in the Arctic atmosphere. Environ. Sci. Technol. 2006, 40, 7577.
| Perfluorinated chemicals in the Arctic atmosphere.Crossref | GoogleScholarGoogle Scholar | 1:CAS:528:DC%2BD28Xht1SlsrzK&md5=4d262469b1093a4e2e8a222cf8ea6316CAS |
[13] K. Y. Kwok, E. Yamazaki, N. Yamashita, S. Taniyasu, M. B. Murphy, Y. Horii, G. Petrick, R. Kallerborn, K. Kannan, K. Murano, P. K. S. Lam, Transport of perfluoroalkyl substances (PFAS) from an arctic glacier to downstream locations: implications for sources. Sci. Total Environ. 2013, 447, 46.
| Transport of perfluoroalkyl substances (PFAS) from an arctic glacier to downstream locations: implications for sources.Crossref | GoogleScholarGoogle Scholar | 1:CAS:528:DC%2BC3sXjvFemtrw%3D&md5=0cd5a03e8b0d81f9a24511fe8096e79dCAS |
[14] D. A. Ellis, J. W. Martin, A. O. De Silva, S. A. Mabury, M. D. Hurley, S. M. P. Andersen, T. J. Wallington, Degradation of fluorotelomer alcohols: a likely atmospheric source of perfluorinated carboxylic acids. Environ. Sci. Technol. 2004, 38, 3316.
| Degradation of fluorotelomer alcohols: a likely atmospheric source of perfluorinated carboxylic acids.Crossref | GoogleScholarGoogle Scholar | 1:CAS:528:DC%2BD2cXjvVShsb0%3D&md5=7a2479460ab1c318ae4882708c831728CAS |
[15] M. I. Gomis, Z. Wang, M. Scheringer, I. T. Cousins, A modeling assessment of the physicochemical properties and environmental fate of emerging and novel per- and polyfluoroalkyl substances. Sci. Total Environ. 2015, 505, 981.
| A modeling assessment of the physicochemical properties and environmental fate of emerging and novel per- and polyfluoroalkyl substances.Crossref | GoogleScholarGoogle Scholar | 1:CAS:528:DC%2BC2cXhvVCrsr%2FF&md5=9830d25920716a4bf1c51ededdc70476CAS |
[16] S. Fiedler, G. Pfister, K.-W. Schramm, Poly- and perfluorinated compounds in household consumer products. Toxicol. Environ. Chem. 2010, 92, 1801.
| Poly- and perfluorinated compounds in household consumer products.Crossref | GoogleScholarGoogle Scholar | 1:CAS:528:DC%2BC3cXhtlSht7rN&md5=7e4424f0d7d870ea96db20fe3bacfb35CAS |
[17] A. Gawor, C. Shunthirasingham, S. J. Hayward, Y. D. Lei, T. Gouin, B. T. Mmereki, W. Masamba, C. Ruepert, L. E. Castillo, M. Shoeib, S. C. Lee, T. Harner, F. Wania, Neutral plyfluoroalkyl substances in the global atmosphere. Environ. Sci. Process. Impacts 2014, 16, 404.
| Neutral plyfluoroalkyl substances in the global atmosphere.Crossref | GoogleScholarGoogle Scholar | 1:CAS:528:DC%2BC2cXjt1alsr4%3D&md5=281441d69a6595744fd1a52cca8c9ab8CAS |
[18] H. Kim, H. Seok, H. Kwon, S. Choi, K. Seok, J. E. Oh, A national discharge load of perfluoroalkyl acids derived from industrial wastewater treatment plants in Korea. Sci. Total Environ. 2016, 563–564, 530.
| A national discharge load of perfluoroalkyl acids derived from industrial wastewater treatment plants in Korea.Crossref | GoogleScholarGoogle Scholar |
[19] D. A. Ellis, J. W. Martin, S. A. Mabury, Atmospheric lifetime of fluorotelomer alcohols. Environ. Sci. Technol. 2003, 37, 3816.
| Atmospheric lifetime of fluorotelomer alcohols.Crossref | GoogleScholarGoogle Scholar | 1:CAS:528:DC%2BD3sXltlaqt7o%3D&md5=96280ab4222d28b795ea42671f2595c3CAS |
[20] M. Shoeib, P. Vlahos, T. Harner, A. Peters, M. Graustein, J. Narayan, Survey of polyfluorinated chemicals (PFCs) in the atmosphere over the northeast Atlantic Ocean. Atmos. Environ. 2010, 44, 2887.
| Survey of polyfluorinated chemicals (PFCs) in the atmosphere over the northeast Atlantic Ocean.Crossref | GoogleScholarGoogle Scholar | 1:CAS:528:DC%2BC3cXnvFOisrw%3D&md5=be272f585a03eb5be5dd41daefc26167CAS |
[21] L. Ahrens, M. Shoeib, S. D. Vento, G. Codling, C. Halsall, Polyfluoroalkyl compounds in the Canadian Arctic atmosphere. Environ. Chem. 2011, 8, 399.
| Polyfluoroalkyl compounds in the Canadian Arctic atmosphere.Crossref | GoogleScholarGoogle Scholar | 1:CAS:528:DC%2BC3MXhtFaqsLrM&md5=0fde8fbf0f6845445917d733bd88917dCAS |
[22] M. Cai, Z. Xie, A. Möller, Z. Yin, P. Huang, M. Cai, H. Yang, R. Sturm, J. He, R. Ebinghasu, Polyfluorinated compounds in the atmosphere along a cruise pathway from the Japan Sea to the Arctic Ocean. Chemosphere 2012, 87, 989.
| Polyfluorinated compounds in the atmosphere along a cruise pathway from the Japan Sea to the Arctic Ocean.Crossref | GoogleScholarGoogle Scholar | 1:CAS:528:DC%2BC38XltValurs%3D&md5=43874ca0b504483e6084f63282fc6888CAS |
[23] R. Bossi, K. Vorkamp, H. Skov, Concentrations of organochlorine pesticides, polybrominated diphenyl ethers and perfluorinated compounds in the atmosphere of North Greenland. Environ. Pollut. 2016, 217, 4.
| Concentrations of organochlorine pesticides, polybrominated diphenyl ethers and perfluorinated compounds in the atmosphere of North Greenland.Crossref | GoogleScholarGoogle Scholar | 1:CAS:528:DC%2BC28XhtFOksLs%3D&md5=d1d33353c18dcb66065f623bdcc05857CAS |
[24] M. Loewen, F. Wania, F. Y. Wang, G. Tomy, Altitude transect of atmospheric and aqueous fluorinated organic compounds in Western Canada. Environ. Sci. Technol. 2008, 42, 2374.
| Altitude transect of atmospheric and aqueous fluorinated organic compounds in Western Canada.Crossref | GoogleScholarGoogle Scholar | 1:CAS:528:DC%2BD1cXisFWkt7Y%3D&md5=503a59008d74f383cf13bc03be478f5dCAS |
[25] A. M. Piekarz, T. Primbs, J. A. Field, D. F. Barofsky, S. Simonich, Semi-volatile fluorinated organic compounds in Asian and Western U.S. air masses. Environ. Sci. Technol. 2007, 41, 8248.
| Semi-volatile fluorinated organic compounds in Asian and Western U.S. air masses.Crossref | GoogleScholarGoogle Scholar | 1:CAS:528:DC%2BD2sXhtlSgurzM&md5=0426be178a9e627d2fa02ed62b4cd624CAS |
[26] T. Kirchgeorg, A. Dreyer, J. Gabrieli, N. Kehrwald, M. Sigl, M. Schwikowski, C. Boutron, A. Gambaro, C. Barbante, R. Ebinghaus, R. Ossi, K. Vorkamp, H. Skov, Temporal variations of perfluoroalkyl substances and polybrominated diphenyl ethers in alpine snow. Environ. Pollut. 2013, 178, 367.
| Temporal variations of perfluoroalkyl substances and polybrominated diphenyl ethers in alpine snow.Crossref | GoogleScholarGoogle Scholar | 1:CAS:528:DC%2BC3sXotlCqtbk%3D&md5=bb36bbb56f59f1dfbaad8a3a1809bab4CAS |
[27] I. Offenthaler, R. Bassan, C. Belis, I. Garo-Stach, S. Ganz, S. Iozza, G. Jakobi, A. Kaiser, M. Kirchner, W. Knoth, N. Kräuchi, W. Levy, W. Moche, J. Nurmi-Legat, S. Raccanelli, K.-W. Schramm, P. Schröder, I. Sedivy, P. Simoncic, M. Staudinger, G. Thanner, M. Uhl, U. Vilhar, P. Weiss, Monarpop Technical Report 2009 (Federal Ministry of Agriculture, Forestry, Environment and Water Management: Wien, Austria).
[28] I. Offenthaler, G. Jakobi, A. Kaiser, M. Kirchner, N. Kräuchi, B. Niedermoser, K.-W. Schramm, I. Sedivy, M. Staudinger, G. Thanner, P. Weiss, W. Moche, Novel sampling methods for atmospheric semi-volatile organic compounds (SOCs) in a high altitude alpine environment. Environ. Pollut. 2009, 157, 3290.
| Novel sampling methods for atmospheric semi-volatile organic compounds (SOCs) in a high altitude alpine environment.Crossref | GoogleScholarGoogle Scholar | 1:CAS:528:DC%2BD1MXhtlyrurbK&md5=65512ac514d7b85c9e242de59f96465eCAS |
[29] A. Dreyer, V. Matthias, C. Temme, R. Ebinghaus, Annual time series of air concentrations of polyfluorinated compounds. Environ. Sci. Technol. 2009, 43, 4029.
| Annual time series of air concentrations of polyfluorinated compounds.Crossref | GoogleScholarGoogle Scholar | 1:CAS:528:DC%2BD1MXltVKks7w%3D&md5=bcf7f67429809e44471c889e7a2121f2CAS |
[30] A. Dreyer, I. Weinberg, C. Temme, R. Ebinghaus, Polyfluorinatedcompounds in the atmosphere of the Atlantic and Southern Oceans: evidence for a global distribution. Environ. Sci. Technol. 2009, 43, 6507.
| Polyfluorinatedcompounds in the atmosphere of the Atlantic and Southern Oceans: evidence for a global distribution.Crossref | GoogleScholarGoogle Scholar | 1:CAS:528:DC%2BD1MXptlSmsLc%3D&md5=138cd5f0e563091c65673fbb85bf7d25CAS |
[31] M. Kirchner, G. Jakobi, W. Körner, W. Levy, W. Moche, B. Niedermoser, M. Schaub, L. Ries, P. Weiss, F. Antritter, N. Fischer, B. Henkelmann, K.-W. Schramm, Ambient air levels of organochlorine pesticides at three high Alpine monitoring stations: trends and dependencies on geographical origin. Aerosol Air Qual. Res. 2016, 16, 738.
| Ambient air levels of organochlorine pesticides at three high Alpine monitoring stations: trends and dependencies on geographical origin.Crossref | GoogleScholarGoogle Scholar | 1:CAS:528:DC%2BC2sXhtVyjsLg%3D&md5=6a261b8fea96ffdf985379ce9288e573CAS |
[32] Z. Xu, S. Fiedler, G. Pfister, B. Henkelmann, C. Mosch, W. Völkel, H. Fromme, K.-W. Schramm, Human exposure to fluorotelomer alcohols, perfluorooctane sulfonate and perfluorooctanoate via house dust in Bavaria, Germany. Sci. Total Environ. 2013, 443, 485.
| Human exposure to fluorotelomer alcohols, perfluorooctane sulfonate and perfluorooctanoate via house dust in Bavaria, Germany.Crossref | GoogleScholarGoogle Scholar | 1:CAS:528:DC%2BC3sXhsFKnsbc%3D&md5=cfef49b95543384fc285ec9cf5065787CAS |
[33] Estimation Program Interface (EPI) Suite TM Suite Version 4.11. http://www.epa.gov/oppt/exposure/pubs/episuite.htm [accessed May 2013].
[34] P. J. Krusic, A. A. Marchione, F. Davidson, M. A. Kaiser, C.-P. C. Kao, R. E. Richardson, M. Botelho, R. L. Waterland, R. C. Buck, Vapor pressure and intramolecular hydrogen bonding in fluorotelomer alcohols. J. Phys. Chem. A 2005, 109, 6232.
| Vapor pressure and intramolecular hydrogen bonding in fluorotelomer alcohols.Crossref | GoogleScholarGoogle Scholar | 1:CAS:528:DC%2BD2MXlsFWmsrg%3D&md5=02813a0cb2daeecfc2d8e611343db939CAS |
[35] S. Thuens, A. Dreyer, R. Sturm, C. Temme, R. Ebinghaus, Determination of the octanol–air partition coefficient (KOA) of fluorotelomeralcohols. J. Chem. Eng. Data 2008, 53, 223.
| Determination of the octanol–air partition coefficient (KOA) of fluorotelomeralcohols.Crossref | GoogleScholarGoogle Scholar | 1:CAS:528:DC%2BD2sXhtlans7nN&md5=af15040cc0a8750bd730352bb5db8f76CAS |
[36] K.-A. Goss, G. Bronner, T. Harner, M. Hertel, T. C. Schmidt, The partition behavior of fluorotelomer alcohols and olefins. Environ. Sci. Technol. 2006, 40, 3572.
| The partition behavior of fluorotelomer alcohols and olefins.Crossref | GoogleScholarGoogle Scholar | 1:CAS:528:DC%2BD28Xjt1yhs70%3D&md5=e25d3ca805e3a2dda83f8c56af069b02CAS |
[37] J. L. Barber, U. Berger, C. Chaemfa, S. Huber, A. Jahnke, C. Temme, K. C. Jones, Analysis of per- and polyfluorinated alkyl substances in air samples from Northwest Europe. J. Environ. Monit. 2007, 9, 530.
| Analysis of per- and polyfluorinated alkyl substances in air samples from Northwest Europe.Crossref | GoogleScholarGoogle Scholar | 1:CAS:528:DC%2BD2sXmtFemsrw%3D&md5=e29ee3f90b49151c3630872d98a56600CAS |
[38] A. Jahnke, L. Ahrens, R. Ebinghaus, U. Berger, J. L. Barber, C. Temme, An improved method for the analysis of the volatile polyfluorinated alkyl substances in environmental air samples. Anal. Bioanal. Chem. 2007, 387, 965.
| An improved method for the analysis of the volatile polyfluorinated alkyl substances in environmental air samples.Crossref | GoogleScholarGoogle Scholar | 1:CAS:528:DC%2BD2sXht1Wiu7k%3D&md5=de6ef1fa83b2c797ceed1908392084aeCAS |
[39] A. Jahnke, U. Berger, R. Ebinghaus, U. Berger, C. Temme, Latitudinal gradient of airborne polyfluorinated alkyl substances in the marine atmosphere between Germany and South Africa (53°N–33°S). Environ. Sci. Technol. 2007, 41, 3055.
| Latitudinal gradient of airborne polyfluorinated alkyl substances in the marine atmosphere between Germany and South Africa (53°N–33°S).Crossref | GoogleScholarGoogle Scholar | 1:CAS:528:DC%2BD2sXjslWgsb0%3D&md5=0aa4c74cc8ac4ced0fb0f402554d990dCAS |
[40] S. Oono, K. H. Harada, M. A. M. Mahmoud, K. Inoue, A. Koizumi, Current levels of airborne polyfluorinated telomers in Japan. Chemosphere 2008, 73, 932.
| Current levels of airborne polyfluorinated telomers in Japan.Crossref | GoogleScholarGoogle Scholar | 1:CAS:528:DC%2BD1cXhtFCkt7%2FL&md5=72b4661f16ca34b0b000bd05f1a00667CAS |
[41] A. Dreyer, M. Shoeib, S. Fiedler, J. Barber, T. Harner, K.-W. Schramm, K. C. Jones, R. Ebinghaus, Field intercomparison on the determination of volatile and semi-volatile polyfluorinated compounds in air. Environ. Chem. 2010, 7, 350.
| Field intercomparison on the determination of volatile and semi-volatile polyfluorinated compounds in air.Crossref | GoogleScholarGoogle Scholar | 1:CAS:528:DC%2BC3cXht12jsbzN&md5=664fea92120f150fdadc8d4cd41c6812CAS |
[42] L. Nizzetto, C. Cassani, A. D. Guardo, Deposition of PCBs in mountains: the forest filter effect of different forest ecosystem types. Ecotoxicol. Environ. Saf. 2006, 63, 75.
| Deposition of PCBs in mountains: the forest filter effect of different forest ecosystem types.Crossref | GoogleScholarGoogle Scholar | 1:CAS:528:DC%2BD28XhvFylug%3D%3D&md5=ad25b384caba6156df4a52f0735e2f41CAS |
[43] M. McLachlan, M. Horstmann, Forests as filters of airborne organic pollutants: a model. Environ. Sci. Technol. 1998, 32, 413.
| Forests as filters of airborne organic pollutants: a model.Crossref | GoogleScholarGoogle Scholar | 1:CAS:528:DyaK1cXjtVem&md5=af7b952a7da54051397734cc46543691CAS |
[44] S. A. Fiedler, Method development and determination of anthropogenic poly- and perfluorinated compounds in air, water, soil, house dust and several consumer products 2010, Ph.D. Dissertation, Technische Universität München, Munich.
[45] NoMiracle, Report on the large-scale, predicted fate and exposure of perfluorooctanoic acid including evaluation against monitoring data 2007 (Stockholm University: Sweden). Available at http://nomiracle.jrc.ec.europa.eu/webapp/ViewPublicDeliverables.aspx [accessed May 2013].
[46] A. Kaiser, Origin of polluted air masses in the Alps. An overview and first results for MONARPOP. Environ. Pollut. 2009, 157, 3232.
| Origin of polluted air masses in the Alps. An overview and first results for MONARPOP.Crossref | GoogleScholarGoogle Scholar | 1:CAS:528:DC%2BD1MXhtlyrurnF&md5=d29e65e8c0d5f00d087561fe894c15c8CAS |
[47] C. N. Hewitt, R. M. Harrison, Tropospheric concentrations of the hydroxyl radical – a review. Atmos. Environ. 1985, 19, 545.
| Tropospheric concentrations of the hydroxyl radical – a review.Crossref | GoogleScholarGoogle Scholar | 1:CAS:528:DyaL2MXkt1GjtLg%3D&md5=f729b45d721b25f67591c509de005f06CAS |
[48] F. Wania, J. E. Haugen, Y. D. Lei, D. Mackay, Temperature dependence of atmospheric concentrations of semi-volatile organic compounds. Environ. Sci. Technol. 1998, 32, 1013.
| Temperature dependence of atmospheric concentrations of semi-volatile organic compounds.Crossref | GoogleScholarGoogle Scholar | 1:CAS:528:DyaK1cXhsFOqurY%3D&md5=67fc3fd06cf426fa0ea0dd308e41ba14CAS |