

Sex- and maturity-based differences in movement and migration patterns of grey nurse shark, Carcharias taurus, along the eastern coast of Australia
C. S. Bansemer A B and M. B. Bennett AA School of Biomedical Sciences, University of Queensland, St Lucia, Qld 4072, Australia.
B Corresponding author. Email: carley.bansemer@uqconnect.uq.edu.au
Marine and Freshwater Research 62(6) 596-606 https://doi.org/10.1071/MF10152
Submitted: 18 June 2010 Accepted: 17 April 2011 Published: 24 June 2011
Journal Compilation © CSIRO Publishing 2011 Open Access CC BY-NC-ND
Abstract
Photo-identification techniques were used to investigate temporal and spatial distributions of Carcharias taurus (Rafinesque, 1810) in relation to maturity, sex and pregnancy status at 19 sites along Australia’s eastern coastline. Of 931 individual sharks identified between 2004 and 2008, 479 were female (271 mature, 208 immature) and 452 male (288 mature, 164 immature). Mature, non-gravid females and mature males were mostly observed in the southern to central parts of this species range, along the eastern coast of Australia, in early summer to early winter. These sharks subsequently moved northward, and mating occurred in late spring to early summer in waters off the coast of northern New South Wales and southern Queensland. Pregnant C. taurus aggregated at Wolf Rock in southern Queensland, at the most northerly part of their known range, from late summer to early winter. These sharks subsequently migrated south to pup in central and southern waters of their range in late winter to late spring. Immature sharks of both sexes moved less than mature sharks, showed no synchronised migration patterns, and were mostly restricted to central and southern waters. The improved understanding of sex- and maturity-based migration of C. taurus provided here should facilitate a conservation strategy appropriate for this species in Australian waters.
Additional keywords: distribution, life-history, photo-identification, shark conservation.
Introduction
Conservation management of the Critically Endangered (www.iucnredlist.org; accessed 18 May 2011) population of grey nurse shark, Carcharias taurus, on the eastern coast of Australia is jeopardised by a lack of information about the species distribution and movement patterns. This problem is compounded by the fact that the species' range spans several legislative jurisdictions with different environmental and socioeconomic priorities, these being circumstances that often reduce the effectiveness of conservation initiatives and limit the scope of management plans (FAO 1999). Accurate information about these factors is required for the development of cohesive management plans with long-term objectives (Bruce et al. 2006; Domeier and Nasby-Lucas 2007; Jonahson and Harding 2007).
Temporal and spatial distributions of C. taurus have been studied using catch data from commercial and recreational fisheries off the coasts of southern Africa (Bass et al. 1975; Dicken et al. 2006, 2007) eastern South America (Lucifora et al. 2002) and the eastern seaboard of the United States of America (Gilmore 1993). These studies have all suggested that large seasonal migrations of thousands of kilometres occur annually and are driven by the reproductive cycle. Also, these studies have demonstrated that mating and subsequent early gestation occur in warm waters close to the respective tropics. Within Australia, a combination of anecdotal reports from fishers and SCUBA divers, catch records of shark-control programs in Queensland (Qld) and New South Wales (NSW), and passive acoustic- and archival-telemetry and conventional tag–recapture studies have suggested that C. taurus moves northward in the Austral autumn and winter, with a southward movement in spring and summer (Reid and Krogh 1992; Pollard et al. 1996; Otway and Burke 2004; Bruce et al. 2005), contrary to the pattern of movement in southern Africa (Bass et al. 1975; Dicken et al. 2006, 2007) and southern America (Lucifora et al. 2002). However, this paradigm has been challenged by the demonstration that mating occurs in more northern waters in late spring–early summer, with pregnant C. taurus individuals aggregating at Wolf Rock, Qld (25°54.630′S, 153°11.800′E), until about mid-winter, and males leaving the region before the end of summer (Bansemer and Bennett 2009).
The pattern of movements of C. taurus in eastern Australian waters is probably influenced by maturity, sex (Pollard and Smith 2000) and pregnancy status of individual sharks, the latter because females of this species have been shown to exhibit a biennial or triennial reproductive cycle (Bansemer and Bennett 2009). Here, we utilise photo-identification (Bansemer and Bennett 2008, 2009, 2010) to determine the timing, magnitude and direction of movement of C. taurus. Heterogeneity of movement in relation to maturity, sex and pregnancy status was examined on the basis of observations of individually recognisable sharks at aggregation sites along the eastern seaboard of Australia.
Materials and methods
Photographic-identification (PID) surveys and study sites
Carcharias taurus was photographed on 311 days between 2004 and 2008 by the primary author (C. S. Bansemer) and members of the diving community at 23 aggregation sites from Wolf Rock in the north to Montague Island in the south (Fig. 1). Four photo-identification (PID) surveys were conducted by C. S. Bansemer at 25 sites (Fig. 1) in July–August 2006 and 2007 and February–March 2007 and 2008, unless an absence of C. taurus was confirmed by local diver operators within the survey period. Each survey period was 27–48 days (weather dependent) (Bansemer and Bennett 2010). A PID survey comprised at least two 20–60-min dives conducted in a single day and aimed to photograph all C. taurus individuals at an aggregation site. To ensure most or all sharks at a site were photographed, sites with >20 sharks sometimes required several days of surveys, whereas sites with aggregations of <20 sharks generally required a single day’s effort to photograph all of the sharks (Bansemer and Bennett 2010). No sharks were observed at an additional two sites included in the surveys (Split Solitary and South-west Solitary Islands, NSW). Some areas that had multiple small aggregation sites in close proximity (<20 km apart) were grouped and analysed as a single entity, namely the ‘north Moreton Island’ site, which comprised Hutchison Shoal, China Wall, Cherubs Cave and Henderson Rock, and the ‘Other Solitary Island’ site, which comprised North-west Solitary Island, Split Solitary Island and South-west Solitary Island. Little Seal Rock and Big Seal Rock (<2 km apart) were also combined and analysed as a single ‘Seal Rocks’ site. Therefore, the results, tables and figures (except Fig. 1) refer only to 19 ‘sites’. Site abbreviations used in the paper are provided in Fig. 1.

|
Individual sharks were identified by the unique spot-patterns on their flanks, with photographic matches of individuals used to describe a particular shark’s movement patterns (Bansemer and Bennett 2008, 2009, 2010). Digital images of the flanks of sharks were obtained with cameras in underwater housings (video: DSRHC1000, Sony, Tokyo, Japan, and Invader Amphibico, Saint Laurent, Canada; still: DSC-100 and MPK-PHP, Sony, Tokyo, Japan; EOS400D, Canon, Tokyo, Japan; and SLR-DC, Ikelite, Indianapolis, USA). The diving community provided unedited images of C. taurus in their original format.
For each shark category (mature pregnant female, mature non-pregnant female, immature female, mature male, subadult male and juvenile male), data on the site, date and flank photographed (right or left) were recorded for each image used in the analysis. The number of sharks in each category was calculated as the number of individual sharks identified by the unique spot-pattern on their left or right flank only (which ever was greater), plus the number of sharks for which spot-patterns on both flanks was known. This eliminated the possibility of double-counting an individual shark.
The maturity status of each shark was based on published correlations between total length (Lt) and maturity (Bass et al. 1975; Lucifora et al. 2002; Dicken et al. 2007). Female sharks >2.2 m Lt were considered mature. Likewise, male sharks >2 m Lt were considered mature, 1.5–2 m Lt as subadults and those <1.5 m Lt as juvenile. The size (Lt) of individual sharks was estimated by eye for all four PID surveys and through subsequent analysis of high-resolution images, including those of sharks measured using laser photogrammetry (Bansemer and Bennett 2009; Rohner et al. 2011). Accuracy of measurements was assessed to be about ±5%. For male sharks, the clasper length was also used to help determine a shark’s maturity status and differentiate between mature and subadult categories. Female sharks could not be divided into subadult and juvenile categories. Many female sharks bore mating scars or were obviously pregnant, characterised by markedly distended flanks. However, external recognition of pregnancy was first noticeable from late February (Bansemer and Bennett 2009). To describe the distribution of pregnant and non-pregnant sharks, all individuals seen with mating scars only, seen with mating scars and subsequently observed to be pregnant, or only seen when pregnant were included as ‘pregnant sharks’. This definition was used for all photographic identifications between that year’s mating season (late October to early December) and their last photographic recapture before the expected parturition season (September–February).
Analysis
Distribution (sharks identified during PID surveys only)
To account for the variation in effort at different sites, only data collected during the four PID surveys (e.g. July–August 2006 and 2007, February–March 2007 and 2008) were used to characterise the temporal and spatial distribution of each of the shark categories across all sites surveyed. If an individual was photographed at the same site on more than one occasion during a PID survey period, only a single identification was recorded for that shark at that site and during that survey period. However, if a shark was identified at more than one site within a survey period or at the same site during multiple survey periods, all photographic recaptures were included in the analysis (one for each site or survey period).
To describe the distribution of the different shark categories, the number of sharks identified in each category for each site for all surveys combined was calculated as a proportion of the total number of sharks identified in each of the respective shark categories, and as a proportion of the total number of sharks identified (summed for the total number of identifications per site and per survey period). Chi-square analysis was used to test for significant deviations from a 1 : 1 sex ratio at sites where more than five individual C. taurus sharks were identified. PRIMER software v. 6 (Clarke and Gorley 2005) was used to calculate Jaccard’s index to ascertain any spatial similarities of distribution among the C. taurus categories within both the February–March and July–August PID surveys. The C. taurus categories were not normally distributed and, therefore, Wilcoxon signed rank tests were used to test for temporal differences in distribution of C. taurus categories between the February–March and July–August PID surveys.
Movements (all sharks identified between 2004 and 2008)
To analyse the distance travelled by an individual C. taurus and by sharks in the different categories, the total number of movements recorded between two or more sites within 365 days was used. For instance, if an individual shark moved between four sites within 365 days, the distances travelled across those four sites were summed. If, however, an individual shark moved between two or more sites within two different 365-day periods, then the distances travelled within each 365-day period were treated separately. The maximum distance travelled by any shark within each category was calculated from the total distance travelled between all sites visited by that individual between 2004 and 2008.
The rate of travel by an individual and by each shark category was calculated from the total number of movements recorded between two sites within 365 days. For instance, each movement between two sites was treated separately and the rate of travel (km day–1) was calculated as the distance travelled (km) between two sites by an individual shark divided by the days at liberty for that movement.
Because distances moved and rates of travel recorded for the different C. taurus categories were not normally distributed, a Kruskal–Wallis H test (ANOVA on ranks) was used to test for a difference in the median rate of travel per day and the median distance travelled by sharks in each of the different shark categories. Pairwise comparisons (Dunn’s method) were applied post hoc to determine where differences occurred.
Results
Between 2004 and 2008, 931 C. taurus individuals (452 male, 479 female), in total, were identified at 19 aggregation sites. Of these sharks, 29% (n = 271) were mature females, 22% (208) immature females, 31% (288) mature males and 18% (164) immature males (60 subadults, 104 juveniles). In total, 673 sharks were identified during the four PID surveys, comprising 170 mature females, 187 mature males, 167 immature females and 149 immature males (54 subadults and 95 juveniles). The female to male ratio for the PID surveys was 1 : 1 ( , P = 0.969), although sex ratios showed considerable variation among sites (Table 1). Of the 931 sharks, 386 (42%) were rephotographed at least once after their initial identification and 150 of those were recorded from at least two sites. In total, 1515 individual identifications or reidentifications were made in the study period and 1077 of those were recorded during the PID surveys.

|
Distribution (sharks identified during four PID surveys)
Mature, non-gravid females (without visible mating scars or pregnancies) were observed at 11 of the 19 aggregation sites surveyed. Sharks in this category occurred mainly between South Solitary Island and Seal Rocks (76%), with the greatest proportion (36%) seen at Fish Rock. The most southerly site, Montague Island (8%), and the three most northerly sites (18%) accounted for the remainder of the sharks (Table 1). In comparison, pregnant sharks were reported from only 6 of the 19 aggregation sites and 77% of these sharks were recorded at Wolf Rock (Table 1).
Mature males were recorded at 15 of the 19 surveyed aggregation sites. Over 50% were recorded from just two sites, namely Flat Rock (25%) and Fish Rock (27%), with the remainder distributed among 13 other sites. No mature males were identified at Broughton Island or Magic Point and only one mature male was recorded from the Tollgate Islands (Table 1).
The distributions of subadult and juvenile male sharks and immature female sharks were similar and therefore these categories were combined and referred to as ‘immature sharks’. The majority of immature sharks occurred between South Solitary Island and Broughton Island, with the highest proportion recorded from Fish Rock (43%) and Seal Rocks (26%) (Table 1). Only one immature shark was recorded north of South Solitary Island and only three immature sharks were recorded south of Magic Point.
Intra-category comparisons for seasonal variance in distribution detected no significant differences in the median numbers of sharks at specific sites between the February–March and the July–August surveys (non-pregnant mature sharks, W = –5, P = 0.831; pregnant sharks, W = –5, P = 0.438; mature males, W = 32, P = 0.389; immature sharks, W = –43, P = 0.092). However, 100% of pregnant females (n = 56) were observed at Wolf Rock in the February–March surveys, whereas in the July–August surveys pregnant sharks were distributed from Wolf Rock (32%; n = 9) to Cod Grounds (4%; n = 1), ~500 km to the south. Mature, non-gravid female sharks were most commonly seen between the Solitary Island and Seal Rocks in both February–March (67%) and July–August (85%) survey periods. Although there was no significant seasonal variation in the distribution of mature males during the PID surveys, particularly large numbers were observed at Flat Rock (Qld) during the July–August surveys, whereas no mature males were identified in waters north of the ‘Other Solitary Islands’ during the February–March surveys (Fig. 2).

|
Jaccard’s index illustrated that the distribution of pregnant sharks showed the least amount of similarity, when compared with that of the other categories, during both February–March and July–August surveys (Fig. 3). Immature sharks were less similar to pregnant sharks in their distribution than were mature non-gravid females and mature males, although the difference was not significant for the July–August survey. Mature males and non-gravid mature females were more similar to each other in their distribution than they were to sharks in the other categories in both surveys, although the difference was not significant for the July–August surveys (Fig. 3).
|
Movements
Overall, mature male and female C. taurus sharks tended to move greater distances and on average at a faster rate than did immature sharks. However, the maximum rate of travel per day (Rmax) was recorded for an immature shark (Table 2). The greatest distance travelled (Dmax) among all photographic recapture events was 2520 km for a mature female that was seen on eight occasions over the course of 39 months, 1335 km for a mature male that was seen on five occasions over 25 months, and 653 km for an immature shark that was identified on four occasions over 14 months. The largest uni-directional movement among all photographic recapture events was 1260 km for a mature female that travelled from Wolf Rock in the northern region to Montague Island in the southern region and then returned to Wolf Rock (i.e. 1260 km in each direction), 748 km for a mature male that travelled north from Seal Rocks in the central region to Wolf Rock in the northern region, and 653 km for an immature shark that also travelled north from Montague Island in the southern region to Fish Rock in the central region.

|
The maximum distance travelled by sharks in the different categories within a 365-day period was highly significantly different (ANOVA on ranks; H2 = 13.283, P = 0.001), with the median value (252 km) for mature male sharks significantly higher than that for immature sharks (81.5 km) (Dunn’s method; Q = 3.168, P < 0.05). Although the median distance travelled for mature female sharks (170 km) was more than twice that for immature sharks, the difference was not significant. Similarly, the rate of travel between two sites by sharks in the different categories within a 365-day period was highly significantly different (ANOVA on ranks; H2 = 21.792, P < 0.001). Mature male sharks moved at a significantly faster median rate (Dunn’s method; Q = 4.565, P < 0.05) than did immature sharks, namely at 1.75 km day–1 and 0.26 km day–1, respectively. Similarly, mature female sharks moved significantly faster, at 1.22 km day–1, than did immature sharks (Q = 2.776, P < 0.05). There was no significant difference in the median rate of travel between mature male and mature female sharks (P > 0.05) (Table 2).
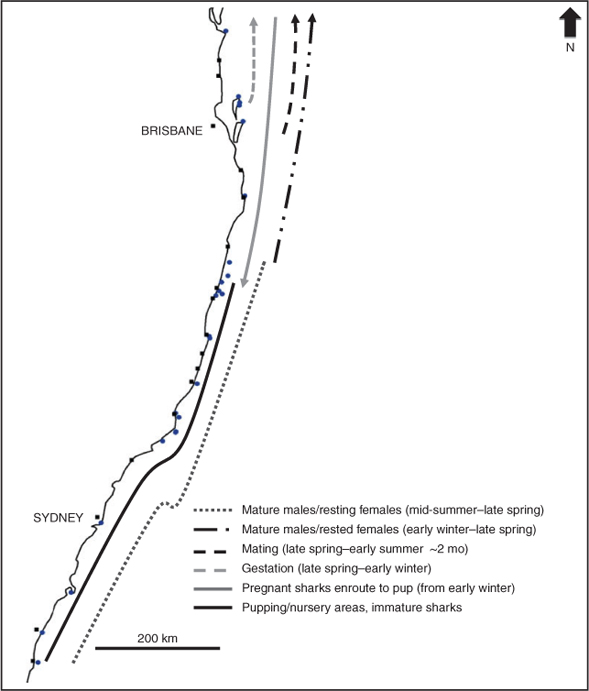
In all, 150 individual sharks were recorded moving between at least two sites between 2004 and 2008, comprising 37 mature female sharks, 64 mature males, 28 immature females, 13 subadult males and eight juvenile males (Figs 4, 5). Rested mature females (i.e. those females that we not pregnant in the previous year and had remained in the southern and central regions since pupping) and mature males migrate north from the southern and central regions in winter to mate in late spring–early summer, predominately in the north-central and northern regions. After the mating season, newly pregnant females remain in northern waters, whereas mature males migrate south from late spring–early summer, to sites within the central and southern regions where they remain until the following winter. Females that became pregnant in the previous mating season (i.e. 9–12 months prior) begin to move south from the northern region from early winter to pup (probably from mid-spring to mid-summer) at sites within the central and southern regions (Fig. 4a, b). The distribution and movements of young-of-year and juvenile sharks (<1.5 m) were more restricted (Fig. 4f) and many juvenile sharks were recorded at the same site over multiple consecutive seasons and years. In comparison, slightly older, but still immature, sharks (<2 m) moved more than did juveniles, although their north–south movements were predominately limited to between the ‘Other Solitary Islands’ and Montague Island (Figs 4, 5).

|
|
Discussion
Previous results from acoustic and archival telemetry combined with catch records from shark-control programs, visual surveys and conventional tag–recapture studies along the eastern coast of Australia have suggested a northerly migration of grey nurse sharks over autumn–winter, followed by a southerly migration in spring–summer (Pollard et al. 1996; Otway et al. 2003; Bruce et al. 2005; Otway and Ellis 2011). In contrast, the present study recorded patterns of distribution and movement that were comparable with those reported in South African coastal waters, especially with regard to the temporal movement patterns and distribution of mature female sharks (in relation to whether they are pregnant or not), mature males during the mating season and immature sharks (Bass et al. 1975; Dicken et al. 2006, 2007).
The key to understanding the movement patterns of C. taurus is to recognise that individuals within the population display different behaviours, depending on their sex and maturity status. Immature sharks have movement patterns that differ from those of mature sharks, and the movements of mature male sharks differ from those of mature female sharks. What may partly drive this difference in movement patterns between mature sharks is the reproductive biology of this species. It appears that the female sharks have a biennial, or even a triennial, reproductive cycle (Lucifora et al. 2002; Bansemer and Bennett 2009) and that the behaviour of mature female sharks in their resting years differs from that in the years in which they become pregnant (Bansemer and Bennett 2009). To fully resolve such sex- and maturity-related differences, it is necessary to survey many individuals, at many sites and over many years.
The reason for the divergent interpretations of C. taurus movement patterns along the eastern Australian coast relates to methods used to examine the population. Data from intensive tag–recapture programs combined with distribution data from catch records can provide good resolution of movement patterns of sharks at the level of the individual and the population, such as used in southern Africa for their C. taurus population (Dicken et al. 2007). However, conventional tagging studies of this species along the eastern coast of Australia (Otway and Burke 2004) have proven insufficient to address fundamental questions about shark movements because the number of sharks tagged was limited and, importantly, did not comprise a representative sample of the population. Acoustic- and archival-telemetry studies have provided valuable information on the movements and site occupancy (Bruce et al. 2005; Otway and Ellis 2011); however, the results have been difficult to interpret. It is apparent from the current study that interpretation of movement patterns and distributions on the basis of electronic-tag data requires knowledge of the sex, maturity status and, if a mature female, whether she is in a reproductively active or in a resting year.
The present study has shown that underwater PID can be a powerful tool for the assessment of the movements of individual C. taurus sharks among sites and over time, primarily owing to the large sample size and the multiple study sites used. Interestingly, although PID has been used in the study of other elasmobranch species, such as white shark, Carcharodon carcharias (Bonfil et al. 2005; Domeier and Nasby-Lucas 2007), whale shark, Rhincodon typus (Meekan et al. 2006), leopard shark, Stegostoma fasciatum (Dudgeon et al. 2008), and the manta rays Manta birostris (Luiz et al. 2009) and M. alfredi (Marshall et al. 2011), most have been single-site studies that lack the ability to resolve possible within-population differences in movement patterns.
A major drawback with PID, as used in the present study, was that it did not provide a continuous record of an individual’s location, and the longer the ‘inter-capture’ period, the poorer the resolution of animal movement. However, the species’ apparent tendency to remain at one aggregation site for some time before moving to another site, coupled with a high survey effort across sites, can result in relatively short inter-capture periods and, hence, a reasonably robust assessment of an individual’s movement patterns. Photographic recaptures in which individuals move a substantial distance in a short period of time probably provide the best estimates of Rmax. The Rmax of 20.7 km day–1 for a mature male equates to a mean speed of 0.24 m s–1 (~0.11 body lengths per second, based on mature male C. taurus Lt), which is probably easily sustained given that continuous cruise speeds of fishes often exceed one body length per second (Webb and Keyes 1982). In comparison, a critical swimming speed of 1.17 ± 0.21 body lengths per second has been reported for juvenile scalloped hammerhead sharks (Lowe 1996). Consequently, the rate of travel calculated for C. taurus suggests that they (1) move in a discontinuous manner, e.g. travel at higher speeds between aggregations sites, but stop at sites for periods of time, (2) swim at speeds much lower than their maximum aerobic capability, or (3) may not swim in a uni-directional manner between sightings. The former interpretation is consistent with the successful application of the PID methodology that relies on sharks being present at aggregation sites.
An important assumption of the present study was that the size estimates used to assign each shark’s ‘maturity status’ were relatively accurate (Bass et al. 1975; Lucifora et al. 2002; Dicken et al. 2007). The majority of images captured throughout the study were taken by C. S. Bansemer who is experienced in obtaining visual-length estimates of C. taurus and has verified visual estimates against length measurements obtained from a laser measurement system (with an error of ~5%). However, some size-estimation errors and the fact that within any population there is variability at the size-at-maturity among individuals may explain some of the outliers in the movement data. For example, the single immature shark that moved from the central region to the northern region may have recently matured, even though its Lt was estimated to be <2.2 m, and it was therefore still recorded as being immature.
The key features of mature-female distributions were that the majority of non-gravid (resting) females remained at middle to southern sites after pupping. Those that were seen at sites further north, but south of Wolf Rock, occurred in the period leading up to mating, and the remaining mature ‘non-gravid’ sharks were observed at Wolf Rock at times when they were expected to be pregnant (November–June). This latter group of sharks may have been pregnant, because one female initially classified ‘non-pregnant’ in April was obviously pregnant when seen in July. Any mating scars that she may have had were completely healed by April and highlight the possibility of incorrect classification of pregnancy status. Natural variation in the healing rates of mating scars and the appearance of pregnant sharks (some may show external signs of pregnancy earlier than others) could explain the presence of perceived ‘non-pregnant’ females at Wolf Rock. This interpretation is further supported by the fact that no pregnant sharks were seen at any site to the south of Wolf Rock between February and May. Small numbers of pregnant sharks were also identified at aggregation sites south of Wolf Rock at times of the year when they were on a relatively slow southward migration to their parturition sites (i.e. July–November). Temporal and spatial distributions of mature pregnant and non-pregnant sharks observed in the present study were similar to the broad patterns reported for the south-western Atlantic and southern African C. taurus populations (Bass et al. 1975; Lucifora et al. 2002; Dicken et al. 2007), with females moving in an equatorial direction to mate and remain during early gestation, before moving to higher latitudes to pup.
In the south-western Atlantic and southern African waters, it has been hypothesised that mature males migrate offshore between mating events, because of a relative deficit of these individuals in catch data or tag–recapture programs (Lucifora et al. 2002; Smale 2002; Dicken et al. 2007). Mature males were resighted repeatedly on their northern migration in the present study. After mating, they may move further north and/or off-shore because they were not generally resighted until they arrived at mid-southern inshore aggregation sites from about February onward (before moving northward again from early winter with the ‘resting’ females, before mating with them). The movements and depth profiles of two mature male sharks tracked by pop-off archival telemetry (PAT) tags support this hypothesis because tagged sharks tended to swim in deeper waters (80–100 m) and their movements may have been assisted by the southerly-flowing East Australian Current (Otway and Ellis 2011).
In contrast to mature animals, immature sharks of both sexes were concentrated in the middle to southern parts of the C. taurus’ range. Segregation from mature sharks was evident, particularly for young-of-year sharks (sharks <1.5 m Lt) that were often seen in caves or under rocky overhangs in shallow water, and in ‘white water’ caused by surge or swell (Dicken et al. 2007; C. Bansemer, pers. obs.). Any mature sharks at the same aggregation sites generally favoured deeper, calmer water. At sites where sharks of all maturity levels were seen, young-of-year sharks would segregate spatially from larger subadult and adult C. taurus sharks (C. Bansemer, pers. obs.). Historically, a shark nursery area was loosely defined by Springer (1967) and has been refined by Heupel et al. (2007) who proposed a classification system under which the following three requirements should be met: (1) juvenile sharks are more commonly encountered in the ‘nursery’ area than other areas, (2) juvenile sharks have a tendency to remain or return for extended periods, and (3) the area or habitat is repeatedly used by juveniles across years. On the basis of the results of the present study, areas such as Fish Rock, Magic Point, Broughton Island and Tollgate Island each appear to fulfil the requirements of a ‘shark nursery area’. Given the causal link between migratory patterns and reproduction in C. taurus (Bass et al. 1975; Gilmore 1993; Lucifora et al. 2002; Dicken et al. 2007), a restricted distribution and movement pattern in relation to immature animals was not unexpected, as has been reported for C. taurus in South Africa (Dicken et al. 2007) and for several other shark species (Heupel et al. 2007; Wetherbee et al. 2007; Yeiser et al. 2008).
The clarification of movement and site-occupancy patterns for the various life-history stages of male and female C. taurus sharks is of significant importance in the potential management of this Critically Endangered species in eastern Australian waters. The results also demonstrated a commonality of behaviour among populations off the coasts of South America, southern Africa and eastern Australia. The situation off the Western Australian coast is not well characterised (Chidlow et al. 2006), and that off the coast of North America may be more complex because of the possibility of the Florida peninsula acting as a partial barrier to the movements of C. taurus between the Atlantic Ocean and the Gulf of Mexico, and the presence of the powerful Gulf Stream. In both domains, photo-identification or an intensive tagging program is needed to further clarify movements of the different life-history stages.
Conclusions
The current study has identified that this Critically Endangered C. taurus population along the Australian eastern coast displays a pronounced heterogeneity in terms of the temporal and spatial distributions of individual sharks, which is dependent on their sex, maturity and whether or not they are pregnant. The present study has provided the necessary science to assist future research directions, management decisions and additional protection measures for C. taurus at aggregation sites along the eastern coast of Australia.
Acknowledgements
We thank the editor, Professor A. Boulton, guest editor and the referees Dr G. Cliff and Dr M. Smale for their time and constructive advice. Thanks also go to A. Kilpatrick, D. Bowden, D. Harasti, P. and N. Hitchens, D. Biddulp, P. Heuttner, K. Holzheimer, A. Nel, K. and C. Phillips, A. Walsh, W. Roberts, R. Peterlin, P. Simpson, M. and D. Davey, V. Temple, T. Starr, M. Jordan, D. Arthur, D. Siviero and the numerous other volunteer divers, dive shops and clubs for their support, field assistance and images of C. taurus. Financial support was provided by the Hermon Slade Foundation and the Queensland Government PhD Smart State Initiative. In-kind support was provided by W. Lancaster of ZSPORTS, R. Peterlin and the Jervis Bay Dive Club, Ron Henry and the ANU Scuba Club, Underwater World (Mooloolaba), and Australia Zoo. This research was conducted in accordance with University of Queensland Ethics Approval SBMS/196/04/DEH, SBMS/228/05/DEH, SBMS/560/06/DEH and SBMS/640/07/HSF.
References
Bansemer, C. S., and Bennett, M. B. (2008). Multi-year validation of photographic identification of grey nurse sharks, Carcharias taurus, and applications for non-invasive conservation research. Marine and Freshwater Research 59, 322–331.| Multi-year validation of photographic identification of grey nurse sharks, Carcharias taurus, and applications for non-invasive conservation research.Crossref | GoogleScholarGoogle Scholar |
Bansemer, C. S., and Bennett, M. B. (2009). Reproductive periodicity, localised movements and behavioural segregation of pregnant Carcharias taurus at Wolf Rock, southeast Queensland, Australia. Marine Ecology Progress Series 374, 215–227.
| Reproductive periodicity, localised movements and behavioural segregation of pregnant Carcharias taurus at Wolf Rock, southeast Queensland, Australia.Crossref | GoogleScholarGoogle Scholar |
Bansemer, C. S., and Bennett, M. B. (2010). Retained fishing gear and associated injuries in the east Australian grey nurse sharks (Carcharias taurus): implications for population recovery. Marine and Freshwater Research 61, 97–103.
| Retained fishing gear and associated injuries in the east Australian grey nurse sharks (Carcharias taurus): implications for population recovery.Crossref | GoogleScholarGoogle Scholar |
Bass, A. J., D’Aubrey, J. D., and Kistnasamy, N. (1975). Sharks of the east coast of Southern Africa IV. The families, Ordontaspididae, Scaponorhynichidae, Isuridae, Cetrohinidae, Alopiidae, Orectolobidae and Rhiniodontidae. Oceanographic Research Institute Investigational Report 61, 6–16.
Bonfil, R., Meÿer, M., Scholl, M. C., Johnson, R., O’Brien, S., et al. (2005). Transoceanic migration, spatial dynamics, and population linkages of white sharks. Science 310, 100–103.
| Transoceanic migration, spatial dynamics, and population linkages of white sharks.Crossref | GoogleScholarGoogle Scholar | 1:CAS:528:DC%2BD2MXhtVOjsr7N&md5=dbb22b5fbf790fa57faac3fa3dea5958CAS | 16210537PubMed |
Bruce, B. D., Stevens, J. D., and Bradford, R. W. (2005). Designing protected areas for grey nurse sharks off eastern Australia. Final Report to Australian Government Department of the Environment and Heritage. CSIRO Marine Research, Hobart. Available at http://www.environment.gov.au/coasts/publications/grey-nurse-protected-areas/index.html [accessed 13 April 2011].
Bruce, B. D., Stevens, J. D., and Malcolm, J. (2006). Movements and swimming behaviour of white sharks (Carcharodon carcharias) in Australian waters. Marine Biology 150, 161–172.
| Movements and swimming behaviour of white sharks (Carcharodon carcharias) in Australian waters.Crossref | GoogleScholarGoogle Scholar |
Chidlow, J., Gaughan, D., and McAuley, R. (2006). Identification of Western Australian grey nurse shark aggregation sites. Final report to the Australian Government, Department of the Environment and Heritage. Western Australian Fisheries and Marine Research Laboratories, Fisheries Research Report No. 155, North Beach. Available at http://www.environment.gov.au/coasts/publications/grey-nurse-research/pubs/gns-research-report.pdf [accessed 12 April 2011].
Clarke, K. R., and Gorley, R. N. (2005). ‘PRIMER: Getting Started with v6.’ (PRIMER-E Ltd: Plymouth, UK.)
Dicken, M. L., Smale, M. J., and Booth, A. J. (2006). Spatial and seasonal distribution patterns of the ragged-tooth shark Carcharias taurus along the coast of South Africa. African Journal of Marine Science 28, 603–616.
| Spatial and seasonal distribution patterns of the ragged-tooth shark Carcharias taurus along the coast of South Africa.Crossref | GoogleScholarGoogle Scholar |
Dicken, M. L., Booth, A. J., and Smale, M. J. (2007). Spatial and seasonal distribution patterns of juvenile and adult raggedtooth sharks (Carcharias taurus) tagged off the east coast of South Africa. Marine and Freshwater Research 58, 127–134.
| Spatial and seasonal distribution patterns of juvenile and adult raggedtooth sharks (Carcharias taurus) tagged off the east coast of South Africa.Crossref | GoogleScholarGoogle Scholar |
Domeier, M. L., and Nasby-Lucas, N. (2007). Annual re-sightings of photographically identified white sharks (Carcharodon carcharias) at an eastern Pacific aggregation site (Guadalupe Island, Mexico). Marine Biology 150, 977–984.
| Annual re-sightings of photographically identified white sharks (Carcharodon carcharias) at an eastern Pacific aggregation site (Guadalupe Island, Mexico).Crossref | GoogleScholarGoogle Scholar |
Dudgeon, C. L., Noad, M. J., and Lanyon, J. M. (2008). Abundance and demography of a seasonal aggregation of zebra sharks Stegostoma fasciatum. Marine Ecology Progress Series 368, 269–281.
| Abundance and demography of a seasonal aggregation of zebra sharks Stegostoma fasciatum.Crossref | GoogleScholarGoogle Scholar |
FAO (1999). The international plan of action for the conservation and management of sharks, Rome. Available at http://www.fao.org/fishery/ipoa-sharks/en [accessed 12 April 2011].
Gilmore, R. G. (1993). Reproductive biology of lamnoid sharks. Environmental Biology of Fishes 38, 95–114.
| Reproductive biology of lamnoid sharks.Crossref | GoogleScholarGoogle Scholar |
Heupel, M. R., Carlson, J. K., and Simpfendorfer, C. A. (2007). Shark nursery areas: concepts, definition, characterization and assumptions. Marine Ecology Progress Series 337, 287–297.
| Shark nursery areas: concepts, definition, characterization and assumptions.Crossref | GoogleScholarGoogle Scholar |
Jonahson, M., and Harding, S. (2007). Occurrence of whale sharks (Rhincodon typus) in Madagascar. Fisheries Research 84, 132–135.
| Occurrence of whale sharks (Rhincodon typus) in Madagascar.Crossref | GoogleScholarGoogle Scholar |
Lowe, C. (1996). Kinematics and critical swimming speed of juvenile scalloped hammerhead sharks. Journal of Experimental Biology 199, 2605–2610.
| 9320537PubMed |
Lucifora, L. O., Menni, C., and Escalante, A. H. (2002). Reproductive ecology and abundance of the sand tiger shark, Carcharias taurus, from the southwestern Atlantic. ICES Journal of Marine Science 59, 553–561.
| Reproductive ecology and abundance of the sand tiger shark, Carcharias taurus, from the southwestern Atlantic.Crossref | GoogleScholarGoogle Scholar |
Luiz, O. J., Balboni, A. P., Kodja, , Andrade, M., and Marum, H. (2009). Seasonal occurrences of Manta birostris (Chondrichthyes: Mobulidae) in southeastern Brazil. Ichthyological Research 56, 96–99.
| Seasonal occurrences of Manta birostris (Chondrichthyes: Mobulidae) in southeastern Brazil.Crossref | GoogleScholarGoogle Scholar |
Marshall, A. D., Dudgeon, C. L., and Bennett, M. B. (2011). Size and structure of a photographically identified population of manta rays Manta alfredi in southern Mozambique. Marine Biology 158, 1111–1124.
| Size and structure of a photographically identified population of manta rays Manta alfredi in southern Mozambique.Crossref | GoogleScholarGoogle Scholar |
Meekan, M. G., Bradshaw, C. J. A., Press, M., McLean, C., et al. (2006). Population size and structure of whale sharks Rhincodon typus at Ningaloo Reef, Western Australia. Marine Ecology Progress Series 319, 275–285.
| Population size and structure of whale sharks Rhincodon typus at Ningaloo Reef, Western Australia.Crossref | GoogleScholarGoogle Scholar |
Otway, N. M., and Burke, A. L. (2004). Mark–recapture population estimate and movements of grey nurse sharks. Final Report to Environment Australia. Project No. 30786/87. NSW Fisheries Final Report Series No. 63, Nelson Bay, NSW, Australia. Available at http://www.dpi.nsw.gov.au/__data/assets/pdf_file/0003/137703/output-433.pdf [accessed 12 April 2011].
Otway, N. M., and Ellis, M. T. (2011). Pop-up archival satellite tagging of Carcharias taurus: movements and depth/temperature-related use of SE Australian waters. Marine and Freshwater Research 62, 607–620.
| Pop-up archival satellite tagging of Carcharias taurus: movements and depth/temperature-related use of SE Australian waters.Crossref | GoogleScholarGoogle Scholar |
Otway, N. M., Burke, A. L., Morrison, N. S., and Parker, P. C. (2003). Monitoring and identification of NSW critical habitat sites for conservation of grey nurse shark. NSW Fisheries Office of Conservation, Port Stephens, New South Wales, Australia. Available at http://www.dpi.nsw.gov.au/research/areas/aquatic-ecosystems/outputs/2003/47 [accessed 12 April 2011].
Pollard, D. A., and Smith, A. K. (2000). Carcharias taurus. In ‘IUCN 2009. IUCN Red List of Threatened Species. Version 2009.1’. Available at www.iucnredlist.org [accessed 12 April 2011].
Pollard, D. A., Lincoln Smith, M. P., and Smith, A. K. (1996). The biology and conservation status of the grey nurse shark (Carcharias taurus Rafinesque 1810) in New South Wales, Australia. Aquatic Conservation: Marine and Freshwater Ecosystems 6, 1–20.
| The biology and conservation status of the grey nurse shark (Carcharias taurus Rafinesque 1810) in New South Wales, Australia.Crossref | GoogleScholarGoogle Scholar |
Reid, D. D., and Krogh, M. (1992). Assessment of catches from protective shark meshing off New South Wales beaches between 1950 and 1990. Australian Journal of Marine and Freshwater Research 43, 283–296.
| Assessment of catches from protective shark meshing off New South Wales beaches between 1950 and 1990.Crossref | GoogleScholarGoogle Scholar |
Rohner, C. A., Richardson, A. J., Marshall, A. D., Weeks, S. J., and Pierce, S. J. (2011). How large is the world’s largest fish? Measuring whale sharks Rhincodon typus with laser photogrammetry. Journal of Fish Biology 78, 378–385.
| How large is the world’s largest fish? Measuring whale sharks Rhincodon typus with laser photogrammetry.Crossref | GoogleScholarGoogle Scholar | 1:STN:280:DC%2BC3M7hslyqsw%3D%3D&md5=29fe6b4c922627d71135cd53adfd9e11CAS | 21235570PubMed |
Smale, M. J. (2002). Occurrence of Carcharias taurus in nursery areas of the Eastern and Western Cape, South Africa. Marine and Freshwater Research 53, 551–556.
| Occurrence of Carcharias taurus in nursery areas of the Eastern and Western Cape, South Africa.Crossref | GoogleScholarGoogle Scholar |
Springer, S. (1967). Social organisation of shark populations. In ‘Sharks, Skates and Rays’. (Eds P. W. Mathewson and D. P. Rall.) pp. 149–174. (John Hopkins Press: Baltimore, MD, USA.)
Webb, P. W., and Keyes, R. S. (1982). Swimming kinematics of sharks. US Fish Bulletin 80, 803–812.
Wetherbee, B. M., Gruber, S. H., and Rosa, R. S. (2007). Movement patterns of juvenile lemon sharks Negaprion brevirostris within Atol das Rocas, Brazil: a nursery characterized by tidal extremes. Marine Ecology Progress Series 343, 283–293.
| Movement patterns of juvenile lemon sharks Negaprion brevirostris within Atol das Rocas, Brazil: a nursery characterized by tidal extremes.Crossref | GoogleScholarGoogle Scholar |
Yeiser, B. G., Heupel, M. R., and Simpfendorfer, C. A. (2008). Occurrence, home range and movement patterns of juvenile bull (Carcharhinus leucas) and lemon (Negaprion brevirostris) sharks within a Florida estuary. Marine and Freshwater Research 59, 489–495.
| Occurrence, home range and movement patterns of juvenile bull (Carcharhinus leucas) and lemon (Negaprion brevirostris) sharks within a Florida estuary.Crossref | GoogleScholarGoogle Scholar |