

Testing otolith morphology for measuring marine fish biodiversity
V. M. Tuset A E , M. Farré A , J. L. Otero-Ferrer B , A. Vilar C , B. Morales-Nin D and A. Lombarte AA Instituto de Ciencias del Mar (CSIC), Passeig Marítim de la Barceloneta 37–49, E-08003, Barcelona, Catalonia, Spain.
B Departamento de Ecoloxía e Bioloxía Animal, Campus Universitario de Vigo, Fonte das Abelleiras, s/n, E-36310, Vigo, Galicia, Spain.
C Facultade de Informática, Campus de Elviña s/n, E-15071, A Coruña, Galicia, Spain.
D Institut Mediterrani d’Estudis Avançats (CSIC-UIB), C/ Miquel Marqués, E-07190, Esporles, Balearic Islands, Spain.
E Corresponding author. Email: vtuset@icm.csic.es
Marine and Freshwater Research 67(7) 1037-1048 https://doi.org/10.1071/MF15052
Submitted: 7 February 2015 Accepted: 7 November 2015 Published: 1 March 2016
Journal Compilation © CSIRO Publishing 2016 Open Access CC BY-NC-ND
Abstract
To check the suitability of otoliths for measuring biodiversity, the contour and shape of the sulcus acusticus of sagittal otoliths were described using geometric morphological analysis. Thirteen and fourteen points were used to define these structures respectively. Three current coastal fish assemblages of the north-western Mediterranean were selected for the present study. The results demonstrate that the relative warps generated in the geometric analysis explained both characteristics related to contour and the otolith sulcus. A comparative study with body fish shape using morphospaces and clusters revealed that otolith shape is a better variable for explaining the ecological structure of a fish assemblage. Moreover, three morphological indices (morphological richness (MR), morphological disparity and the morphogeometric index) were estimated from relative warps of otoliths and were compared with ecological, taxonomic, functional and morphological (from body shape) indices. MR increased with functional diversity and average taxonomic distinctness, reflecting the ecological and taxonomic character of otolith morphology. These findings suggest that otoliths could be a useful tool for studying the diversity of present and past fish assemblages.
Additional keywords: geometric morphology, otolith shape.
Introduction
Natural changes or human impacts on ecosystems have often been quantified using indices of ecological diversity (e.g. Ungaro et al. 1998; Colloca et al. 2003; D’Onghia et al. 2003). Techniques for measuring diversity have varied over time, and include taxonomic, phylogenetic, morphological and functional indices (Clarke and Warwick 2001; McClain et al. 2004; Petchey and Gaston 2006; Vellend et al. 2011; Farré et al. 2013). Morpho-functional diversity is recognised as a key element representing the roles that organisms play within ecosystems because interspecific competition among ecologically equivalent species facilitates different life strategies (Karr and James 1975; Motta et al. 1995; Weissburg 2005; Villéger et al. 2010). In recent and fossil fish, most studies have focussed primarily on morpho-functional traits related to feeding and locomotor apparatus, because these features are considered to be indicators of resource partitioning and thus linked to species coexistence (e.g. Gatz 1979; Winemiller 1991; Wainwright et al. 2002). Nevertheless, body shape is also used because it is a multifunctional and single factor related to aspects of behavioural ecology, such as the mode of feeding, predator evasion or courtship displays (Lavin and McPhail 1985; Loy et al. 2000; Walker 2010). In addition, body shape may also be influenced by anthropogenic activities, such as aquaculture or fishing pressure (Alós et al. 2014; Abaad et al. 2016).
The fossil record of modern bony fish is based on isolated teeth and otoliths, as well as on articulated skeletons, although otoliths are the best-preserved structures in marine fish. Otolith analysis has made important contributions to the understanding of fish evolution and phylogeny (e.g. Gaemers 1983; Nolf 1985, 2013; Reichenbacher et al. 2007). In addition, otoliths and fish evolution and phylogeny may also be valuable for interpretation of historical fisheries (Van Neer et al. 2002; Limburg et al. 2008). Because of their scientific relevance, collections and atlases of otoliths have been created worldwide (e.g. Nolf 1985; Smale et al. 1995; Volpedo and Echeverría 2000; Campana 2004; Tuset et al. 2008; Lin and Chang 2012). At the same time, the development of digital techniques has offered new possibilities for classification based on image handling and analysis (e.g. Gauldie and Crampton 2002; Stransky et al. 2008; Parisi-Baradad et al. 2010; Tuset et al. 2012). The use of otoliths for geometric morphometric analysis was initially questioned because otoliths have limited points with biologically homologous characteristics or landmarks (Rohlf and Marcus 1993). However, more recent studies have demonstrated the suitability of this approach (Monteiro et al. 2005; Ponton 2006; Lombarte et al. 2010; Vignon and Morat 2010).
From a functional point of view, otoliths are associated with hearing and the sense of balance (Popper and Coombs 1982; Ramcharitar et al. 2006; Schulz-Mirbach et al. 2014). Numerous studies have demonstrated that otolith morphology, including the sulcus acusticus, is also linked to swimming (Volpedo and Echeverría 2003, Volpedo et al. 2008), feeding (Lombarte et al. 2010), spatial distribution (Gauldie and Crampton 2002; Lombarte and Cruz 2007; Sadighzadeh et al. 2014) and acoustic communication (Popper and Lu 2000; Cruz and Lombarte 2004). Moreover, otoliths have been used in taxonomic (e.g. L’Abée-Lund and Jensen 1993; Ponton 2006; Tuset et al. 2006) and phylogenetic studies in many groups of Teleostean fish (e.g. Gaemers 1983; Nolf 1985; Monteiro et al. 2005). Therefore, it is reasonable to suppose that the high morphological variability of otoliths and their specificity may be also used to measure biodiversity.
The main objectives of the present study were to: (1) develop a geometric morphometric method for combined analysis of otolith outline and sulcus acusticus features; (2) evaluate whether the spatial distribution of otolith species in a graphical illustration, a biplot called ‘morphospace’, has morpho-functional meaning; (3) analyse the spatial distribution of species in the biplot and morphological indices generated from otolith and body fish shapes, because body shape can be used to estimate the diversity of fish assemblages (Farré et al. 2013); and (4) test the potential of the otolith method for estimating the diversity of known fish assemblages.
Materials and methods
Data compilation
Three fish assemblages comprised of a total of 61 species with a variety of life histories and similar depth ranges were selected from the western Mediterranean Sea (see Farré et al. 2013). Two assemblages (A, sandy–rocky 20 m with 25 species; B, sandy 20 m with 27 species) were characterised by similar species richness and dissimilarities in ecological and taxonomical indices. The third assemblage selected (C, artificial reef–sandy 15–19 m with 48 species) was higher in species richness and functional diversity than the other two assemblages (see Farré et al. 2013).
Otolith and body shape
In all, 466 sagittal otolith images from the 61 species (see Table S1, available as Supplementary material to this paper) were obtained from the ICM Barcelona (Consejo Superior de Investigaciones Científicas, CSIC) collection, which is integrated in the AFORO (Análisi de Formes d’Otòtils, or ‘Shape Analysis of Fish Otoliths’) database (Lombarte et al. 2006; see http://www.cmima.csic.es/aforo/, accessed 1 January 2015). The anatomical terminology used in the present study is based on that of Tuset et al. (2008).
In the present study only subadult and adult specimens were analysed, avoiding the effect of ontogenetic changes in otolith shape, only samples from Mediterranean and Atlantic waters were included in the analysis because not all species used in the present study have otoliths in the AFORO database collected from other areas and we assumed that the intraspecific variability in otolith shapes using our methodology (see below) is not significant in relation to interspecific variability. This assumption is based on two reasons: (1) the contour is defined from few points, providing an otolith pattern in lesser detail in relation to other mathematical procedures; and (2) the shape of the sulcus acusticus is consistent within species (Torres et al. 2000; Tuset et al. 2008). Therefore, the otolith shape obtained for each species is a consensus representation obtained using a morphological geometric method, which can be applied for any general research (such as the present study), but not for specific studies, such as stock identification. Finally, images of body shape in the present study were only of Mediterranean fish because most of the otoliths came from this area.
The shape of the otolith outline was described using eight reference landmarks (homologous points) established in terms of straight lines according to Reichenbacher et al. (2007). Five semi-landmarks (non-homologous points) equidistant from particular consecutive landmarks were also added to improve the representation of otolith shape (see Fig. 1a). To characterise the sulcus acusticus contour, 14 landmarks and three semi-landmarks were selected according to the literature (Monteiro et al. 2005; Lombarte et al. 2010; see Fig. 1a). The number of points for defining the otolith and sulcus acusticus was similar to avoid unbalanced influence in the estimation and meaning of relative warps (see below). Several examples with all points considered are illustrated in Fig. 1b. Twenty-seven landmarks and semi-landmarks (Fig. 2) with anatomical, ecological and taxonomic meaning were used for the morphological analysis of the body shape of fish (for more detail, see Farré et al. 2013).
|

|
Geometric morphometric analysis
The morphological diversity of the otoliths and fish shapes was quantified separately using geometric morphometrics (Bookstein 1991). The digitised coordinates of the landmarks and semi-landmarks were obtained using tpsDig software (ver.2.16; Rohlf 2003a). Then, Cartesian grid coordinates for the landmarks and semi-landmarks were analysed using relative warp analysis with tpsRelw ver.1.49 (Rohlf 2003b). Essentially, relative warp (RW) analysis is a principal components analysis of the covariance matrix of the aligned specimens (e.g. rotated, translated and scaled landmark coordinates). Thus, the RW represents a set of specific morphological characteristics allowing the analysis of particular morphological attributes (Rohlf and Marcus 1993; Kassam et al. 2002; Zelditch et al. 2003). The geometric morphological analysis was performed independently for each species, obtaining a consensus (average) configuration from all otolith samples in the database. Then, the protocol was repeated for each fish assemblage considering all species and using the consensus figure for each species. The body shape analysis followed the protocols explained in Farré et al. (2013).
Morphological variations were illustrated with a ‘morphospace’, where the species distribution and occupied space indicate the structural complexity of the assemblage (Wainwright et al. 2002; Clabaut et al. 2007). The species were represented by applying a non-metric multidimensional scaling (nMDS; Tuset et al. 2014) from the first three RWs (representing >75% of total variability) to capture the most useful information regarding shape variation (Recasens et al. 2006). Locations of species clusters within morphospaces were compared graphically using contour lines from a bivariate Gaussian kernel density estimator (Werdelin and Lewis 2013). Finally, a Mantel test was used to analyse the correlation between the Euclidean morphological distances for the body characteristics and otolith characteristics. Specifically, the P-value obtained from the analysis served to estimate the probability of obtaining a correlation equal to or greater than the calculated value, based on 5000 random matrix permutations (Clabaut et al. 2007). These analyses were performed in PAST (Palaeontological Statistics, ver. 1.81; Hammer et al. 2001).
Diversity indices
For the otolith analysis, the first eight RW scores were selected to describe the morphological variability of shape for each species because they explained more than 90% of the total morphological variability (see Results). Three morphological indices were estimated for measuring the diversity from otoliths and body shapes (Farré et al. 2013): morphological disparity (MD), morphological richness (MR) and the morphogeometric or ecomorphological index (EMI). Values of these indices were calculated as follows:
where RWj is the RW of species j and N is the total number of species;

where CC is the cluster coefficient, computed from the Euclidean distance matrix using the unweighted pair group method with arithmetic mean (UPGMA) method, and j is the species; and
For the comparative study, ecological (Shannon’s diversity index; H), taxonomic (average taxonomic distinctness; Δ+), morphological (discussed above) and functional (FD) diversity indices of these fish assemblages were taken from data published by Farré et al. (2013; see Table 1).

|
Results
Otolith morphological variability
The localisation of landmarks and semi-landmarks in the consensus figure for each species is given in Figs S1 and S2 (available as Supplementary material to this paper). The first eight warps explained 91.6% of interspecific variation and each warp contributed to the description of otolith outline (shape, dorsal–ventral curvature, type of posterior zone and the presence and type of rostrum) and features of the sulcus acusticus (mode opening, relative size of the ostium and type and curvature of the cauda; Fig. 3a). The first warp explained 45.9% of the variability, clearly identifying otoliths with a mesial opening on the left side of the plot. The second warp only explained 13.5% of the variability, discriminating between rounded otoliths with a concave cauda and wider ostium (positive axis) and enlarged otoliths with a convex cauda and narrower ostium (negative axis). The third warp explained a similar degree of morphological variation (11.4%), but the otoliths with a rounded shape showed a convex cauda and narrower ostium. In general, the variation explained by the remaining warps decreased gradually, verifying that each warp explained different otolith topologies (Fig. 3b). Therefore, the morphological meaning of the warps demonstrated that the points used to define the otolith morphology were appropriate.

|
Morphospace comparison
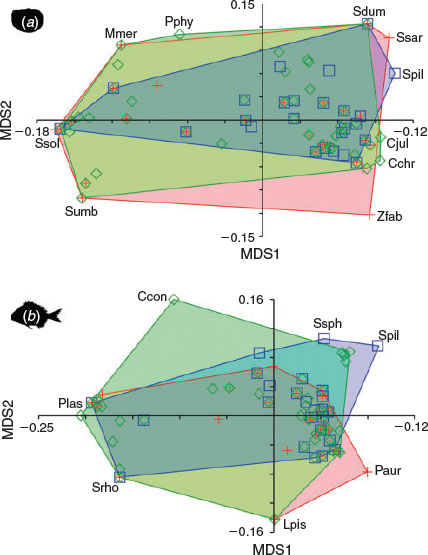
The body and otolith morphospaces were built using all 61 species studied (Fig. 4a). In the fish morphospace, the peripheral species presented characteristics associated with locomotion and prey capture strategies: bilateral asymmetry characterising the flatfish (Pegusa lascaris, Scophthalmus rhombus and Solea solea, Pleuronectiformes); flattened shapes with the first spine of the dorsal fin transformed into a luminescent sensory organ (Lophius piscatorius, Lophiiformes); elliptic–oval bodies, very common in most benthic fishes (Pagrus auriga, Perciformes); fusiform bodies specialised for rapid swimming (Sardina pilchardus, Clupeiformes) or for slower movements (Sphyraena sphyraena, Perciformes); or eel-like bodies of fish species that use holes and caves to avoid predators and to forage (Conger conger, Anguilliformes). In contrast, in the otolith morphospace, only two of the previous species (S. solea and S. pilchardus) were located on the periphery. In addition, species producing sounds (Sciaena umbra, Perciformes), pelagic and oceanic swimmers (Sarda sarda and Seriola dumerilii, Perciformes), fish with rare otolith shapes and with particular swimming habits (Zeus faber, Zeiformes) or those reaching deeper waters (Merluccius merluccius and Phycis phycis, Gadiformes) together defined the limits of the convex hull. The MDS1-axis primarily separated species relative to the opening of the sulcus, whereas the MDS2-axis primarily separated species according to the otolith height : length ratio.

|
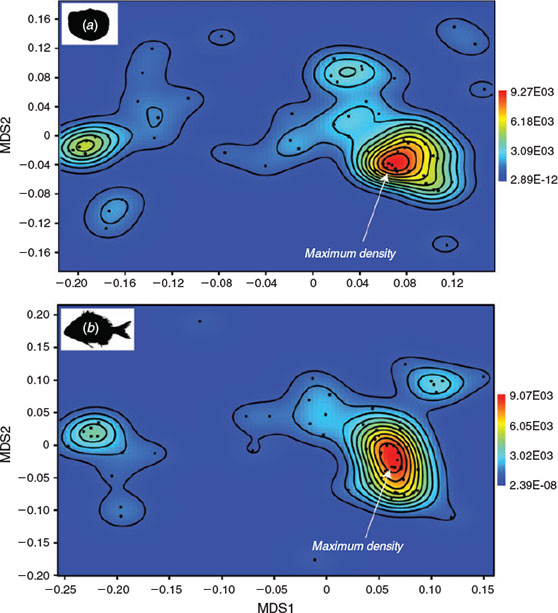
UPGMA cluster analysis, using Euclidean distance, for body shape clearly distinguished the flatfish according to bilateral asymmetry (Fig. 4b). This morphological homogeneity was partially disrupted in the morphological analysis of the otoliths because of variability in the opening and type of the sulcus acusticus. Many Perciformes were grouped on an equal basis as a consequence of the analogy between body and otolith morphology, and only a small number of species (e.g. sciaenids) were grouped according to other criteria. Although the otolith morphospace was clearly more heterogeneous, the density graphs showed similar patterns: a large group of Perciformes and two small sets primarily composed of flatfish and mullets, with highly differentiated body and otolith morphologies in both cases (Fig. 5). Thus, the Mantel test (r = 0.529; P < 0.0001) revealed a significant correlation between the morphological distances for body shapes and those for otolith shapes, indicating similarity in the spatial variability of most of the species studied. This was due to a close correspondence between the body and otolith shapes of sparids (Sparidae, Perciformes), flatfish and mullets (Mugilidae, Perciformes), which were dominant in the fish assemblages studied.
|
Morphological diversity
The morphological indices were affected by the presence of extreme shapes and spatial heterogeneity of data. In the otolith morphospaces, the lobate shape of the sagittae of Z. faber (Fig. 6a) noticeably increased the morphological disparity (MD = 0.0758) in Assemblage B, whereas Assemblage A exhibited the lowest values (MD = 0.0458) because of a lack of unusual shapes (Table 1). Moreover, morphological richness was related to species richness; hence, the greatest value was obtained for Assemblage C (MR = 7.31; Table 1). Structurally, the spatial distribution of species based on otolith shape was similar for Assemblages A and C, with the same EMI values (0.156; Table 1), whereas the EMI value increased Assemblage B as a consequence of a decrease in the similarity of otolith shapes.
|
For the body morphoshape, the extreme shape of C. conger determined that Assemblage C reached the highest MD value (MD = 0.168; Table 1). MR was also linked to species richness, providing the greatest value for Assemblage C (MR = 7.11; Table 1). Spatial distribution was higher in Assemblage B (EMI = 0.182; Table 1).
Compared with other diversity indices (see Table 1), MR increased with functional diversity. In addition, the MR values obtained from otolith shape showed stronger relationships with functional diversity than MR values obtained from fish body shape. The EMI indices showed a similar tendency in the morphological analyses of otolith and body shapes. Moreover, larger EMI values corresponded to greater values of the Shannon index. Finally, the MD of the otoliths was related to the Shannon index, whereas the MD of the body shapes was linked to taxonomic diversity.
Discussion
Relevance of the sulcus acusticus as a descriptor
The results of the present study showed that features of both the otolith and sulcus acusticus were well-defined and together improved the ability to distinguish interspecific variability within fish assemblages. Several studies have found ecomorphological patterns through the analysis of otolith shape (Volpedo and Echeverría 2003, Volpedo et al. 2008; Lombarte and Cruz 2007; Teimori et al. 2012). For example, a circular or polygonal shape with a poorly defined rostrum is typical of fish living on soft-bottom habitats (called ‘Group 1’; see Volpedo and Echeverría 2003, Volpedo et al. 2008) an elongated shape with a variable rostrum is common for fish inhabiting hard-bottom habitats and a lanceolated or rectangular shape with a prominent rostrum and a deep V-shaped excisura is characteristic of pelagic species. Although the correspondence between otolith shape and type of habitat is not consistent in all cases, these groups were differentiated based on the aspect ratio (height : length) of the otolith, rostrum length v. otolith length and the sulcus : otolith area ratio. These features were also implicit in the warps obtained, but the major problem is that these patterns can be partially biased from a morpho-functional perspective: croakers or drums (Sciaenidae, Perciformes) and flatfish (Pleuronectiformes) belong to Group 1, but the shape of the sulcus in flatfish is completely different from that in the croakers. From a functional perspective, croakers are considered specialists in sound production (Luczkovich et al. 1999; Ramcharitar et al. 2001), whereas flatfish are not hearing specialists (Popper and Fay 1993). For this reason, the inclusion of sulcus shape provided relevant functional information. In addition, the warps showed variability in relation to the relative size of the sulcus ostium and cauda. The ostium size is correlated with an increase in the proportion of horizontally oriented sensory hair cells (Popper and Coombs 1982), which is related to the detection of directional acoustic stimuli and the location of prey (Popper and Fay 1993). Although it is unknown how the type of sulcus actually affects sound transduction, the properties of the sulcus are species specific (Nolf 1985; Gauldie 1988; Torres et al. 2000; Reichenbacher and Reichard 2014). Thus, the cluster analysis indicated that, for example, mullets (Mugiliformes), croakers, hakes, cod (Gadiformes) or dories (Zeiformes) were isolated because they have a special type of sulcus (Tuset et al. 2008). Therefore, joint analysis of otolith outline and sulcus shape is a powerful tool for the study of fish assemblages.
Interpreting the otolith morphospace
According to the concept of limiting similarity, species have a minimum distance in a one-dimensional niche space (MacArthur and Levins 1967), which should lead to regular spacing of species within morphospace (Ricklefs 2012). However, many studies have shown different levels of species packing or grouping, including the presence of empty morphospace zones (Gatz 1979; Goatley et al. 2010; Ricklefs 2012). The degree of species packing seems to coincide with the morphologies that are best adapted for the most efficient exploitation of resources in the ecosystem (Schoener 1974; Gatz 1979; Wainwright and Richard 1995; Ricklefs 2012).
Previous studies have found a clear correspondence between otolith morphospace and the trophic niche of fish (Lombarte et al. 2010; Tuset et al. 2015). In the present study, sparids and flatfish will be the best species adapted within these fish assemblages, forming similar packing species in the otolith and body morphospaces. However, the otolith morphospace showed a different spatial variability for some species. Scophthalmids and soleids (flatfish) appeared separated in the otolith morphospace because their otoliths are mainly differ in the type of opening of the sulcus, which is ostial in scophthalmids and pseudo-ostial or mesial in soleids (Tuset et al. 2008). Scophthalmids feed on highly mobile prey and these foraging techniques require strong visual and hearing abilities, whereas soleids, with a smaller mouth, feed on slow-moving prey (Guedes and Araújo 2008). A similar pattern is seen in species such as Trachinus radiatus (Trachinidae, Perciformes), Uranoscopus scaber (Uranoscopidae, Perciformes) and L. piscatorius, which are ambush predators (Bagge 2004; Rizkalla and Philips 2008), burying into the sand and having similar morphological features in otolith shape to the scophthalmids.
In addition, other ecological adaptions were represented in the otolith morphospace. The sensorial macula and sulcus acusticus have been related to auditory frequency, mobility and depth distribution of fish (Gauldie 1988; Lombarte and Popper 1994; Torres et al. 2000; Sadighzadeh et al. 2014). We found that sagittae with a higher sulcus : otolith ratio were located in the periphery of the morphospace. In the case of gadiforms, they inhabit deeper waters and live close to the bottom during daytime, but move off-bottom at night to feed, emitting high-frequency sounds (Gauldie 1988). Faster-swimming pelagic species have small otoliths, but they also have a high sulcus : otolith ratio (Paxton 2000, Volpedo and Echeverría 2003). This likely allows them to get the maximum information about the environment around them, especially about predators and prey, as well as to maintain body orientation and coordination of movements during swimming (Kasumyan 2004). The largest otoliths with a high sulcus : otolith ratio were obtained in scianids, which produce low-frequency sounds during competition for feeding or during the breeding season (Horodysky et al. 2008).
The findings suggest that species clustered together based on otolith morphology did not share the same body shape. In fact, otolith shape grouped species with similar ecological strategies related to feeding or resting on the bottom (Hobson 2006). For example, jacks and mackerels (Carangidae and Scombridae, Perciformes), fast-swimming pelagic species, were clearly isolated based on the cluster analysis of otolith shape, whereas jacks were grouped with sciaenids and mullets based on cluster analysis of body shape. This is because, morphologically, these species share the presence of two dorsal fins. Therefore, the spatial distribution of otolith shapes seems to provide a better ecological interpretation of species than that obtained from analysis of fish shapes.
Measuring biodiversity
Taxonomically closer species share similar morphological features (for otolith, body or both) and this explains why they are strongly grouped in the morphospace. This is reflected by MD, which is linked to taxonomic diversity (McClain et al. 2004; Gerber et al. 2008; Farré et al. 2013). Body shape in fish is determined by different ecological behaviours, for example swimming, searching for food, striking and capturing prey or evading predators (Walker 2010). It is therefore a consequence of evolutionary process and the reason why the fish body morphospaces are also used to analyse the trajectory of anatomical radiation of fossil and recent fish (e.g. Peres-Neto 2004; Friedman 2010). The spatial distribution of Anguilliformes, Clupeiformes, Lophiiformes, Mugilliformes and Pleuronectiformes clearly showed body shapes isolated and differentiated in the periphery of the morphospace, which increases the MD value, indicating a clear relationship with taxonomic differentiation. In contrast, the sagittal otoliths have a higher degree of dissimilarity within taxonomic groups (e.g. Nolf 1985; Volpedo and Echeverría 2000; Campana 2004; Tuset et al. 2008), which is why the MD did not show a relationship with average taxonomic distinctness. The morphological convergence in some characteristics (e.g. ostium : cauda ratio and height : length ratio) led to clustering of Perciformes and Pleuronectiformes, Angulliformes and Gadiformes or Pleuronectiformes and Lophiiformes and a decrease in MD.
Sagittal otolith shape is markedly species specific (e.g. Gaemers 1983; Lombarte et al. 1991; L’Abée-Lund and Jensen 1993; Tuset et al. 2003; Sadighzadeh et al. 2012). Its variability is a phenotypic indicator that produces higher morphological distances between closely related species compared with body shape. It influences the spatial heterogeneity and diversity of shapes within morphospace and estimation of EMI and otolith MR. This morphological differentiation is also reflected in FD, reinforcing the functional character of the otolith. Furthermore, as opposed to body shape, otolith morphological indices are not strongly influenced by extreme (or peripheral) morphologies, and only some species or groups present unusual shape, such as Gadiformes, Gasterosteiformes, Stephanoberyciformes, Tetraodontiformes or Zeiformes (e.g. Nolf 1985; Tuset et al. 2008; Deng et al. 2013).
Understanding the origin and maintenance of biodiversity is a core challenge in ecology, evolution and conservation science (Gaston 2000). In recent years, FD has been considered key in biodiversity studies because it explains the roles that organisms play within ecosystems. The functional traits used to define this diversity are related to food strategies, trophic position, size, locomotion, mobility, lifestyle, activity or distribution in habitat (e.g. Petchey and Gaston 2006; Somerfield et al. 2008; Villéger et al. 2010). Many of these ecological factors are also related to otolith and sulcus shape and size (e.g. Gauldie and Crampton 2002; Volpedo and Echeverría 2003; Lombarte and Cruz 2007; Volpedo et al. 2008; Lombarte et al. 2010; Sadighzadeh et al. 2014). In this context, the present study clearly demonstrated that otolith shape has an important functional character, hence its strong relationship with FD. Otolith shape makes it possible to easily compare recent and fossil fish assemblages or to measure the diversity of fish assemblages as an alternative in cases where ecological information may be absent or scarce.
Acknowledgements
The authors are very grateful to all the people who helped in the development of the AFORO database, especially colleagues of Instituto de Ciencias del Mar (ICM-CSIC) in Barcelona. The present study was financed by the projects ‘ESCAL 1’ (Ref. PCC30004/99) and ‘ESCAL 2’ (Ref. 02P30015) of the Direcció General of Fisheries of the Government of Catalonia and ‘CONFLICT’ (Ref. CGL2008–00047), ‘AFORO3D’ (Ref. CTM2010.1970) and ‘ANTROMARE’ (Ref. CTM2009.12214) of the Spanish National Research. M. Farré acknowledges a Ph.D. scholarship from the Government of Andorra (ATC-010-AND; 2012–14).
References
Abaad, M., Tuset, V. M., Montero, D., Lombarte, A., Otero-Ferrer, J. L., and Harun, R. (2016). Phenotypic plasticity in wild marine fishes associated with fish-cage aquaculture. Hydrobiologia 765, 343–358.| Phenotypic plasticity in wild marine fishes associated with fish-cage aquaculture.Crossref | GoogleScholarGoogle Scholar | 1:CAS:528:DC%2BC2MXht12ku7%2FM&md5=a347b98cffae89688427b424db3066aaCAS |
Alós, J., Palmer, M., Linde-Medina, M., and Arlinghaus, R. (2014). Consistent size-independent harvest selection on fish body shape in two recreationally exploited marine species. Ecology and Evolution 4, 2154–2164.
| 25360257PubMed |
Bagge, O. (2004). The biology of the greater weever fish (Trachinus draco) in the commercial fishery of the Kattegat. ICES Journal of Marine Science 61, 933–943.
| The biology of the greater weever fish (Trachinus draco) in the commercial fishery of the Kattegat.Crossref | GoogleScholarGoogle Scholar |
Bookstein, F. L. (1991). ‘Morphometric Tools for Landmark Data: Geometry and Biology.’ (Cambridge University Press: Cambridge, UK.)
Campana, S. E. (2004). ‘Photographic Atlas of Fish Otoliths of the Northwest Atlantic Ocean.’ (NRC Research Press: Ottawa.)
Clabaut, C., Bunje, P. M. E., Salzburger, W., and Meyer, A. (2007). Geometric morphometric analyses provide evidence for the adaptative caracter of the Tanganyikan cichlid fish radiations. Evolution 61, 560–578.
| Geometric morphometric analyses provide evidence for the adaptative caracter of the Tanganyikan cichlid fish radiations.Crossref | GoogleScholarGoogle Scholar | 17348920PubMed |
Clarke, K. R., and Warwick, R. M. (2001). A further biodiversity index applicable to species lists, variation in taxonomic distinctness. Marine Ecology Progress Series 216, 265–278.
| A further biodiversity index applicable to species lists, variation in taxonomic distinctness.Crossref | GoogleScholarGoogle Scholar |
Colloca, F., Cardinale, M., Belluscio, A., and Ardizzone, G. D. (2003). Pattern of distribution and diversity of demersal assemblages in the central Mediterranean Sea. Estuarine, Coastal and Shelf Science 56, 469–480.
| Pattern of distribution and diversity of demersal assemblages in the central Mediterranean Sea.Crossref | GoogleScholarGoogle Scholar |
Cruz, A., and Lombarte, A. (2004). Otolith size and its relationship with colour patterns and sound production. Journal of Fish Biology 65, 1512–1525.
| Otolith size and its relationship with colour patterns and sound production.Crossref | GoogleScholarGoogle Scholar |
D’Onghia, G., Carlucci, R., Maiorano, P., and Panza, M. (2003). Discards from deep-water bottom trawling in the Eastern–Central Mediterranean Sea and effects of mesh size changes. Journal of Northwest Atlantic Fishery Science 31, 245–261.
Deng, X., Wagner, H. J., and Popper, A. N. (2013). Interspecific variations of inner ear structure in the deep-sea fish family Melamphaidae. The Anatomical Record 296, 1064–1082.
| Interspecific variations of inner ear structure in the deep-sea fish family Melamphaidae.Crossref | GoogleScholarGoogle Scholar | 23625740PubMed |
Farré, M., Tuset, V. M., Maynou, F., Recasens, L., and Lombarte, A. (2013). Geometric morphology as an alternative for measuring the diversity of fish assemblages. Ecological Indicators 29, 159–166.
| Geometric morphology as an alternative for measuring the diversity of fish assemblages.Crossref | GoogleScholarGoogle Scholar |
Friedman, M. (2010). Explosive morphological diversification of spiny-finned teleost fishes in the aftermath of the end-Cretaceous extinction. Proceedings. Biological Sciences 277, 1675–1683.
| Explosive morphological diversification of spiny-finned teleost fishes in the aftermath of the end-Cretaceous extinction.Crossref | GoogleScholarGoogle Scholar |
Gaemers, P. A. M. (1983). Taxonomic position of Cichlidae (Pisces, Perciformes) as demonstrated by the morphology of their otoliths. Netherlands Journal of Zoology 34, 566–595.
| Taxonomic position of Cichlidae (Pisces, Perciformes) as demonstrated by the morphology of their otoliths.Crossref | GoogleScholarGoogle Scholar |
Gaston, K. J. (2000). Global patterns in biodiversity. Nature 405, 220–227.
| Global patterns in biodiversity.Crossref | GoogleScholarGoogle Scholar | 1:CAS:528:DC%2BD3cXjsFyjs7o%3D&md5=e78583eb098697363850f7dfd52f98eeCAS | 10821282PubMed |
Gatz, A. J. (1979). Community organization in fishes as indicated by morphological features. Ecology 60, 711–718.
| Community organization in fishes as indicated by morphological features.Crossref | GoogleScholarGoogle Scholar |
Gauldie, R. W. (1988). Function, form and time-keeping properties of fish otoliths. Comparative Biochemistry and Physiology. A. Comparative Physiology 91, 395–402.
| Function, form and time-keeping properties of fish otoliths.Crossref | GoogleScholarGoogle Scholar |
Gauldie, R. W., and Crampton, J. S. (2002). An eco-morphological explication of individual variability in the shape of the fish otolith: comparison of the otolith of Hoplostethus atlanticus with other species by depth. Journal of Fish Biology 60, 1204–1221.
| An eco-morphological explication of individual variability in the shape of the fish otolith: comparison of the otolith of Hoplostethus atlanticus with other species by depth.Crossref | GoogleScholarGoogle Scholar |
Gerber, S., Eble, G. J., and Neige, P. (2008). Allometric space and allometric disparity: a developmental perspective in the macroevolutionary analysis of morphological disparity. Evolution 62, 1450–1457.
| Allometric space and allometric disparity: a developmental perspective in the macroevolutionary analysis of morphological disparity.Crossref | GoogleScholarGoogle Scholar | 18346223PubMed |
Goatley, C. H. R., Bellwood, D. R., and Bellwood, O. (2010). Fishes on coral reefs: changing roles over the past 240 million years. Paleobiology 36, 415–427.
| Fishes on coral reefs: changing roles over the past 240 million years.Crossref | GoogleScholarGoogle Scholar |
Gosline, W. A. (1994). Function and structure in the paired fins of scorpaeniform fishes. Environmental Biology of Fishes 40, 219–226.
| Function and structure in the paired fins of scorpaeniform fishes.Crossref | GoogleScholarGoogle Scholar |
Guedes, A. P. P., and Araújo, F. G. (2008). Trophic resource partitioning among five flatfish species (Actinopterygii, Pleuronectiformes) in a tropical bay in southeastern Brazil Journal of Fish Biology 72, 1035–1054.
| Trophic resource partitioning among five flatfish species (Actinopterygii, Pleuronectiformes) in a tropical bay in southeastern BrazilCrossref | GoogleScholarGoogle Scholar |
Hammer, Ø., Harper, D. A. T., and Ryan, P. D. (2001). PAST: paleontological statistics software package for education and data analysis. Palaeontologia Electronica 4, art. 4.
Hobson, E. S. (2006). Evolution. In ‘The Ecology of Marine Fishes: California and Adjacent Waters’. (Eds L. J. Allen, D. J. Pondella and D. J. Horn.) pp. 55–80. (California University Press: Berkeley.).
Horodysky, A. Z., Brill, R. W., Warrant, E. J., Musick, J. A., and Latour, R. J. (2008). Comparative visual function in five sciaenid fishes inhabiting Chesapeake Bay. The Journal of Experimental Biology 211, 3601–3612.
| Comparative visual function in five sciaenid fishes inhabiting Chesapeake Bay.Crossref | GoogleScholarGoogle Scholar | 18978225PubMed |
Karr, J. R., and James, F. C. (1975). Eco-morphological configurations and convergent evolution of species and communities. In ‘Ecology and Evolution of Communities’. (Eds M. L. Cody and J. M. Diamond.) pp. 258–291. (Harvard University Press: Cambridge, MA.)
Kassam, D. D., Sato, T., and Yamaoka, K. (2002). Landmark-based morphometric analysis of the body shape of two sympatric species, Ctenopharynx pictus and Otopharynx sp. ‘heterodon nankhumba’ (Teleostei: Cichlidae), from Lake Malawi. Ichthyological Research 49, 340–345.
| Landmark-based morphometric analysis of the body shape of two sympatric species, Ctenopharynx pictus and Otopharynx sp. ‘heterodon nankhumba’ (Teleostei: Cichlidae), from Lake Malawi.Crossref | GoogleScholarGoogle Scholar |
Kasumyan, A. O. (2004). The vestibular system and sense of equilibrium in fish. Journal of Ichthyology 44, 224–268.
L’Abée-Lund, J. H., and Jensen, A. J. (1993). Otoliths as natural tags in the systematics of salmonids. Environmental Biology of Fishes 36, 389–393.
| Otoliths as natural tags in the systematics of salmonids.Crossref | GoogleScholarGoogle Scholar |
Langerhans, R. B., Layman, C. A., Shokrollahi, A. M., and DeWitt, T. J. (2004). Predator-driven phenotypic diversification in Gambusia affinis. Evolution 58, 2305–2318.
| Predator-driven phenotypic diversification in Gambusia affinis.Crossref | GoogleScholarGoogle Scholar | 15562692PubMed |
Lavin, P. A., and McPhail, J. D. (1985). The evolution of freshwater diversity in threespine stickleback (Gasterosteus aculeatus): site-specific differentiation of trophic morphology. Canadian Journal of Zoology 63, 2632–2638.
| The evolution of freshwater diversity in threespine stickleback (Gasterosteus aculeatus): site-specific differentiation of trophic morphology.Crossref | GoogleScholarGoogle Scholar |
Layman, C. A., Langerhans, R. B., and Winemiller, K. O. (2005). Body size, not other morphological traits, characterizes cascading effects in fish assemblage composition following commercial netting. Canadian Journal of Fisheries and Aquatic Sciences 62, 2802–2810.
| Body size, not other morphological traits, characterizes cascading effects in fish assemblage composition following commercial netting.Crossref | GoogleScholarGoogle Scholar |
Limburg, K. E., Walther, Y., Hong, B., Olson, C., and Storå, J. (2008). Prehistoric versus modern Baltic Sea cod fisheries: selectivity across the millennia. Proceedings. Biological Sciences 275, 2659–2665.
| Prehistoric versus modern Baltic Sea cod fisheries: selectivity across the millennia.Crossref | GoogleScholarGoogle Scholar |
Lin, C. H., and Chang, C. W. (2012). ‘Otolith Atlas of Taiwan Fishes’. (National Museum of Marine Biology and Aquarium: Taiwan.)
Lombarte, A., and Cruz, A. (2007). Otolith size trends in marine fish communities from different depth strata. Journal of Fish Biology 71, 53–76.
| Otolith size trends in marine fish communities from different depth strata.Crossref | GoogleScholarGoogle Scholar |
Lombarte, A., and Popper, A. N. (1994). Quantitative analysis of postembryonic hair cell addition in th otolithic endorgans of the inner ear of the European hake, Merluccius merluccius (Gadiformes, Teleostei). The Journal of Comparative Neurology 345, 419–428.
| Quantitative analysis of postembryonic hair cell addition in th otolithic endorgans of the inner ear of the European hake, Merluccius merluccius (Gadiformes, Teleostei).Crossref | GoogleScholarGoogle Scholar | 1:STN:280:DyaK2M%2FhsFWisA%3D%3D&md5=5c460e1a53e24fe0188ef2a654ce6d48CAS | 7929910PubMed |
Lombarte, A., Rucabado, J., Matallanas, J., and Lloris, D. (1991). Taxonomía numérica de Nototheniidae en base a la forma de los otolitos. Scientia Marina 55, 413–418.
Lombarte, A., Chic, Ò., Parisi-Baradad, V., Olivella, R., Piera, J., and García-Ladona, E. (2006). A web-based environment from shape analysis of fish otoliths. The AFORO database. Scientia Marina 70, 147–152.
Lombarte, A., Palmer, M., Matallanas, J., Gómez-Zurita, J., and Morales-Nin, B. (2010). Ecomorphological trends and phylogenetic inertia of otolith sagittae in Nototheniidae. Environmental Biology of Fishes 89, 607–618.
| Ecomorphological trends and phylogenetic inertia of otolith sagittae in Nototheniidae.Crossref | GoogleScholarGoogle Scholar |
Loy, A., Busilacchi, S., Costa, C., Ferlin, L., and Cataudella, S. (2000). Comparing geometric morphometrics and outline fitting methods to monitor fish shape variability of Diplodus puntazzo (Teleostea: Sparidae). Aquacultural Engineering 21, 271–283.
| Comparing geometric morphometrics and outline fitting methods to monitor fish shape variability of Diplodus puntazzo (Teleostea: Sparidae).Crossref | GoogleScholarGoogle Scholar |
Luczkovich, J. J., Sprague, M. W., Johnson, S. E., and Pullinger, R. C. (1999). Delimiting spawning areas of weakfish Cynoscion regalis (Family Sciaenidae) in Pamlico Sound, North Carolina using passive hydroacoustic surveys. Bioacoustics 10, 143–160.
| Delimiting spawning areas of weakfish Cynoscion regalis (Family Sciaenidae) in Pamlico Sound, North Carolina using passive hydroacoustic surveys.Crossref | GoogleScholarGoogle Scholar |
MacArthur, R., and Levins, R. (1967). The limiting similarity, convergence, and divergence of coexisting species. American Naturalist 101, 377–385.
| The limiting similarity, convergence, and divergence of coexisting species.Crossref | GoogleScholarGoogle Scholar |
McClain, C. R., Johnson, N. A., and Rex, M. A. (2004). Morphological disparity as a biodiversity metric in lower bathyal and abyssal gastropod assemblages. Evolution 58, 338–348.
| 15068350PubMed |
Monteiro, L., Di Beneditto, A. P. M., Guilhermo, L. H., and Rivera, L. A. (2005). Allometric changes and shape differentiation of sagitta otoliths in sciaenid fishes. Fisheries Research 74, 288–299.
| Allometric changes and shape differentiation of sagitta otoliths in sciaenid fishes.Crossref | GoogleScholarGoogle Scholar |
Motta, P. J., Clifton, K., Hernandez, P., and Eggold, B. T. (1995). Ecomorphological correlates in ten species of subtropical seagrass fishes: diet and microhabitat utilization. Environmental Biology of Fishes 44, 37–60.
| Ecomorphological correlates in ten species of subtropical seagrass fishes: diet and microhabitat utilization.Crossref | GoogleScholarGoogle Scholar |
Nolf, D. (1985). Otolithi piscium. In ‘Handbook of Paleoichthyology’. (Ed. H. P. Schultze.). pp. 1–10. (Gustav Fischer Verlag: Stuttgrat.)
Nolf, D. (2013). ‘The Diversity of Fish Otoliths, Past and Present.’ (Royal Belgian Institute of Natural Sciences: Bruxelles.)
Parisi-Baradad, V., Manjabacas, A., Lombarte, A., Olivella, R., Chic, Ò., Piera, J., and García-Ladona, E. (2010). Automatic taxon identification of teleost fishes in an otolith online database. Fisheries Research 105, 13–20.
| Automatic taxon identification of teleost fishes in an otolith online database.Crossref | GoogleScholarGoogle Scholar |
Paxton, J. R. (2000). Fish otoliths: do sizes correlate with taxonomic group, habitat or luminescence? Philosophical Transactions of the Royal Society of London. Series B, Biological Sciences 355, 1299–1303.
| Fish otoliths: do sizes correlate with taxonomic group, habitat or luminescence?Crossref | GoogleScholarGoogle Scholar | 1:STN:280:DC%2BD3M7psF2ruw%3D%3D&md5=6565d031163f38f00933fc3502ab17fcCAS | 11079419PubMed |
Peres-Neto, P. R. (2004). Patterns in the co-occurrence of fish species in streams: the role of site suitability, morphology and phylogeny versus species interactions. Oecologia 140, 352–360.
| Patterns in the co-occurrence of fish species in streams: the role of site suitability, morphology and phylogeny versus species interactions.Crossref | GoogleScholarGoogle Scholar | 15138880PubMed |
Petchey, O. L., and Gaston, K. J. (2006). Functional diversity: back to basics and looking forward. Ecology Letters 9, 741–758.
| Functional diversity: back to basics and looking forward.Crossref | GoogleScholarGoogle Scholar | 16706917PubMed |
Ponton, D. (2006). Is geometric morphometrics efficient for comparing otolith shape of different fish species? Journal of Morphology 267, 750–757.
| Is geometric morphometrics efficient for comparing otolith shape of different fish species?Crossref | GoogleScholarGoogle Scholar | 16526058PubMed |
Popper, A. N., and Coombs, S. (1982). The morphology and evolution of the ear in actinopterygian fishes. American Zoologist 22, 311–328.
| The morphology and evolution of the ear in actinopterygian fishes.Crossref | GoogleScholarGoogle Scholar |
Popper, A. N., and Fay, R. R. (1993). Sound detection and processing by fish: critical review and major research questions. Brain, Behavior and Evolution 41, 14–38.
| Sound detection and processing by fish: critical review and major research questions.Crossref | GoogleScholarGoogle Scholar | 1:STN:280:DyaK3s7mtFSrsA%3D%3D&md5=9af630a303e5543dadebdfcc857c1ebfCAS | 8431753PubMed |
Popper, A. N., and Lu, Z. (2000). Structure–function relationships in fish otolith organs. Fisheries Research 46, 15–25.
| Structure–function relationships in fish otolith organs.Crossref | GoogleScholarGoogle Scholar |
Ramcharitar, J., Higgs, D. M., and Popper, A. N. (2001). Sciaenid inner ears: a study in diversity. Brain, Behavior and Evolution 58, 152–162.
| Sciaenid inner ears: a study in diversity.Crossref | GoogleScholarGoogle Scholar | 1:STN:280:DC%2BD387ns1yqtg%3D%3D&md5=611363fa72875d49709320ddca1abca0CAS | 11910172PubMed |
Ramcharitar, J., Gannon, D. P., and Popper, A. N. (2006). Bioacoustics of the family Sciaenidae (croakers and drumfishes). Transactions of the American Fisheries Society 135, 1409–1431.
| Bioacoustics of the family Sciaenidae (croakers and drumfishes).Crossref | GoogleScholarGoogle Scholar |
Recasens, L., Lombarte, A., and Sánchez, P. (2006). Teleostean fish composition and structure of an artificial reef and a natural rocky area in Catalonia (North Western Mediterranean). Bulletin of Marine Science 78, 71–82.
Reichenbacher, B., and Reichard, M. (2014). Otoliths of five extant species of the Annual Killifish Nothobranchius from the East African Savannah. PLoS One 9, e112459.
| Otoliths of five extant species of the Annual Killifish Nothobranchius from the East African Savannah.Crossref | GoogleScholarGoogle Scholar | 25383789PubMed |
Reichenbacher, B., Sienknecht, U., Küchenhoff, H., and Fenske, N. (2007). Combined otolith morphology and morphometry for assessing taxonomy and diversity in fossil and extant killifish (Aphanius, †Prolebias). Journal of Morphology 268, 898–915.
| Combined otolith morphology and morphometry for assessing taxonomy and diversity in fossil and extant killifish (Aphanius, †Prolebias).Crossref | GoogleScholarGoogle Scholar | 17674357PubMed |
Ricklefs, R. E. (2012). Species richness and morphological diversity of passerine birds. Proceedings of the National Academy of Sciences of the United States of America 109, 14482–14487.
| Species richness and morphological diversity of passerine birds.Crossref | GoogleScholarGoogle Scholar | 1:CAS:528:DC%2BC38XhsVaqu77I&md5=bb7ab28bcbbcc95dd824c9bf6d8cf3f9CAS | 22908271PubMed |
Rizkalla, S. I., and Philips, A. I. (2008). Feeding habits of the Atlantic stargazer fish Uranoscopus scaber Linnaeus, 1758 (Family: Uranoscopidae) in Egyptian Mediterranean waters. Egyptian Journal of Aquatic Biology and Fisheries 12, 1–11.
Rohlf, F. J. (2003a). ‘TpsDig Version 2.16. Department of Ecology and Evolution.’ (State University of New York at Stony Brook: New York.)
Rohlf, F. J. (2003b). ‘TpsRelw Version 1.49. Department of Ecology and Evolution.’ (State University of New York at Stony Brook: New York.)
Rohlf, F. J., and Marcus, L. F. (1993). A revolution in morphometrics. Trends in Ecology & Evolution 8, 129–132.
| A revolution in morphometrics.Crossref | GoogleScholarGoogle Scholar |
Sadighzadeh, Z., Tuset, V. M., Valinassab, T., Dadpour, M. R., and Lombarte, A. (2012). Comparison of different otolith shape descriptors and morphometrics for the identification of closely related species of Lutjanus spp. from the Persian Gulf. Marine Biology Research 8, 802–814.
| Comparison of different otolith shape descriptors and morphometrics for the identification of closely related species of Lutjanus spp. from the Persian Gulf.Crossref | GoogleScholarGoogle Scholar |
Sadighzadeh, Z., Otero-Ferrer, J. L., Lombarte, A., Fatemi, M. R., and Tuset, V. M. (2014). An approach to unraveling the coexistence of snappers (Lutjanidae) using otolith morphology. Scientia Marina 78, 353–362.
| An approach to unraveling the coexistence of snappers (Lutjanidae) using otolith morphology.Crossref | GoogleScholarGoogle Scholar |
Schoener, T. W. (1974). Resource partitioning in ecological communities. Science 185, 27–39.
| Resource partitioning in ecological communities.Crossref | GoogleScholarGoogle Scholar | 1:STN:280:DC%2BC3cvgslehtQ%3D%3D&md5=b39953783d925c07e87c67971f4407e9CAS | 17779277PubMed |
Schulz-Mirbach, T., Heß, M., and Metscher, B. D. (2014). Sensory epithelia of the fish inner ear in 3D: studied with high-resolution contrast enhanced micro CT. Frontiers in Zoology 11, 25.
| Sensory epithelia of the fish inner ear in 3D: studied with high-resolution contrast enhanced micro CT.Crossref | GoogleScholarGoogle Scholar | 24645675PubMed |
Schwarzhans, W. (1996). Otoliths from the Maastrichtian of Bavaria and their evolutionary significance. In ‘Mesozoic Fishes: – Systematics and Paleoecology’. (Eds G. Arratia and G Viohl.) pp. 417–431. (Verlag Dr. Friedrich Pfeil: München.).
Smale, M. J., Watson, G., and Hecht, T. (1995). Otolith atlas of southern African marine fishes. Ichthyological Bulletin of the J. L. B. Smith Institute of Ichthyology 1, 1–253.
| Otolith atlas of southern African marine fishes.Crossref | GoogleScholarGoogle Scholar |
Somerfield, P. J., Clarke, R., Warwick, R. M., and Dulvy, N. K. (2008). Average functional distinctness as a measure of the composition of assemblages. ICES Journal of Marine Science 65, 1462–1468.
| Average functional distinctness as a measure of the composition of assemblages.Crossref | GoogleScholarGoogle Scholar |
Stransky, C., Baumann, H., Fevolden, S. E., Harbitz, A., Høie, H., Nedreaas, K. H., Salberg, A. B., and Skarstein, T. (2008). Separation of Norwegian coastal cod and Northeast Arctic cod by outer otolith shape analysis. Fisheries Research 90, 26–35.
| Separation of Norwegian coastal cod and Northeast Arctic cod by outer otolith shape analysis.Crossref | GoogleScholarGoogle Scholar |
Teimori, A., Jawad, L. A. J., Al-Kharusi, L. H., Al-Mamry, J. M., and Reichenbacher, B. (2012). Late Pleistocene to Holocene diversification and historical zoogeography of the Arabian killifish (Aphanius dispar) inferred from otolith morphology. Scientia Marina 76, 637–645.
Torres, G. J., Lombarte, A., and Morales-Nin, B. (2000). Variability of the sulcus acusticus in the sagitta otolith of the genus Merluccius. Fisheries Research 46, 5–13.
| Variability of the sulcus acusticus in the sagitta otolith of the genus Merluccius.Crossref | GoogleScholarGoogle Scholar |
Tuset, V. M., Lombarte, A., González, J. A., Pertusa, J. F., and Lorente, M. J. (2003). Comparative morphology of the sagittae otolith in Serranus spp. Journal of Fish Biology 63, 1491–1504.
| Comparative morphology of the sagittae otolith in Serranus spp.Crossref | GoogleScholarGoogle Scholar |
Tuset, V. M., Rosin, P. L., and Lombarte, A. (2006). Sagittae otolith shape used in the identification of fishes of the genus Serranus. Fisheries Research 81, 316–325.
| Sagittae otolith shape used in the identification of fishes of the genus Serranus.Crossref | GoogleScholarGoogle Scholar |
Tuset, V. M., Lombarte, A., and Assis, C. A. (2008). Otolith atlas for the western Mediterranean, north and central eastern Atlantic. Scientia Marina 72, 1–198.
| Otolith atlas for the western Mediterranean, north and central eastern Atlantic.Crossref | GoogleScholarGoogle Scholar |
Tuset, V. M., Azzurro, E., and Lombarte, A. (2012). Identification of Lessepsian fish species using the sagittae otolith. Scientia Marina 76, 289–299.
| Identification of Lessepsian fish species using the sagittae otolith.Crossref | GoogleScholarGoogle Scholar |
Tuset, V. M., Farré, M., Lombarte, A., Bordes, F., Wienerroither, R., and Olivar, P. (2014). A comparative study of morphospace occupation of mesopelagic fish assemblages from the Canary Islands (north-eastern Atlantic). Ichthyological Research 61, 152–158.
| A comparative study of morphospace occupation of mesopelagic fish assemblages from the Canary Islands (north-eastern Atlantic).Crossref | GoogleScholarGoogle Scholar |
Tuset, V. M., Imondi, R., Aguado, G., Otero-Ferrer, J. L., Santschi, L., Lombarte, A., and Love, M. (2015). Otolith patterns of rockfishes from the Northeastern Pacific. Journal of Morphology 276, 458–469.
| Otolith patterns of rockfishes from the Northeastern Pacific.Crossref | GoogleScholarGoogle Scholar | 25503537PubMed |
Ungaro, N., Marano, G., and Osmani, K. (1998). Demersal fish assemblage diversity as an index of fishery resources exploitation. The Italian Journal of Zoology 65, 511–516.
| Demersal fish assemblage diversity as an index of fishery resources exploitation.Crossref | GoogleScholarGoogle Scholar |
Van Neer, W., Ervynck, A., Bolle, L., Millner, R., and Rijnsdorp, A. D. (2002). Fish otoliths and their relevance to archaelogy: an analysis of medieval, post-medieval, and recent material of plaice, cod, and haddock from the North Sea. Environmental Archaeology 7, 61–76.
| Fish otoliths and their relevance to archaelogy: an analysis of medieval, post-medieval, and recent material of plaice, cod, and haddock from the North Sea.Crossref | GoogleScholarGoogle Scholar |
Vellend, M., Cornwell, W. K., Magnuson-Ford, K., and Mooers, A. (2011). Measuring phylogenetic biodiversity. In ‘Biological Diversity: Frontiers in Measurement and Assessment’. (Eds A. E. Magurran and B. J. McGill.) pp. 194–207. (Oxford University Press: Oxford, UK.)
Vignon, M., and Morat, F. (2010). Environmental and genetic determinant of otolith shape revealed by a non-indigenous tropical fish. Marine Ecology Progress Series 411, 231–241.
| Environmental and genetic determinant of otolith shape revealed by a non-indigenous tropical fish.Crossref | GoogleScholarGoogle Scholar |
Villéger, S., Miranda, J. R., Hernandez, D. F., and Mouillot, D. (2010). Contrasting changes in taxonomic and functional diversity of tropical fish communities after habitat degradation. Ecological Applications 20, 1512–1522.
| Contrasting changes in taxonomic and functional diversity of tropical fish communities after habitat degradation.Crossref | GoogleScholarGoogle Scholar | 20945756PubMed |
Volpedo, A. V., and Echeverría, D. D. (2000). ‘Catálogo y claves de otolitos para la identificación de peces del Mar Argentino. 1. Peces de Importáncia Económica.’ (Dunken: Buenos Aires.)
Volpedo, A. V., and Echeverría, D. D. (2003). Ecomorphological patterns of the sagitta in fish on the continental shelf off Argentine. Fisheries Research 60, 551–560.
| Ecomorphological patterns of the sagitta in fish on the continental shelf off Argentine.Crossref | GoogleScholarGoogle Scholar |
Volpedo, A. V., Tombari, A. D., and Echeverría, D. D. (2008). Ecomorphological patterns of the sagitta of Antarctic fish. Polar Biology 31, 635–640.
| Ecomorphological patterns of the sagitta of Antarctic fish.Crossref | GoogleScholarGoogle Scholar |
Wainwright, P. C., and Richard, B. A. (1995). Predicting patterns of prey use from morphology of fishes. Environmental Biology of Fishes 44, 97–113.
| Predicting patterns of prey use from morphology of fishes.Crossref | GoogleScholarGoogle Scholar |
Wainwright, P. C., Belwood, D. R., and Westneat, M. W. (2002). Ecomorphology of locomotion in labrid fishes. Environmental Biology of Fishes 65, 47–62.
| Ecomorphology of locomotion in labrid fishes.Crossref | GoogleScholarGoogle Scholar |
Walker, J. A. (2010). An integrative model of evolutionary covariance: a symposium on body shape in fishes. Integrative and Comparative Biology 50, 1051–1056.
| An integrative model of evolutionary covariance: a symposium on body shape in fishes.Crossref | GoogleScholarGoogle Scholar | 21558259PubMed |
Weissburg, M. J. (2005). Sensory biology: linking the internal and external ecologies of marine organisms. Marine Ecology Progress Series 287, 263–307.
| Sensory biology: linking the internal and external ecologies of marine organisms.Crossref | GoogleScholarGoogle Scholar |
Werdelin, L., and Lewis, M. E. (2013). Temporal change in functional richness and evenness in the Eastern African Plio–Pleistocene carnivoran guild. PLoS One 8, e57944.
| Temporal change in functional richness and evenness in the Eastern African Plio–Pleistocene carnivoran guild.Crossref | GoogleScholarGoogle Scholar | 1:CAS:528:DC%2BC3sXktlSqtbc%3D&md5=80b0d60214c53585e2177f6524a304e3CAS | 23483948PubMed |
Winemiller, K. O. (1991). Ecomorphological diversification in lowland fresh-water fish assemblages from five biotic regions. Ecological Monographs 61, 343–365.
| Ecomorphological diversification in lowland fresh-water fish assemblages from five biotic regions.Crossref | GoogleScholarGoogle Scholar |
Yamanoue, Y., Setiamarga, D. H. E., and Matsuura, K. (2010). Pelvic fins in teleosts: structure, function and evolution. Journal of Fish Biology 77, 1173–1208.
| Pelvic fins in teleosts: structure, function and evolution.Crossref | GoogleScholarGoogle Scholar | 1:STN:280:DC%2BC3cbjvV2jtw%3D%3D&md5=c7409dc7a644af1abaed2090c929ccc0CAS | 21039499PubMed |
Zelditch, M. L., Sheets, H. D., and Fink, W. L. (2003). The ontogenic dynamics of shape disparity. Paleobiology 29, 139–156.
| The ontogenic dynamics of shape disparity.Crossref | GoogleScholarGoogle Scholar |