

New parameterisation method for three-dimensional otolith surface images
P. Marti-Puig A C , J. Danés A , A. Manjabacas B and A. Lombarte BA Grup de Tractament de Dades i Senyals, University of Vic (UVIC-UCC), Sagrada Família, 7, E-08500 Vic, Catalonia, Spain.
B Institut de Ciències del Mar, ICM (CSIC), Passeig Marítim de la Barceloneta, 37-49, E-08003 Barcelona, Catalonia, Spain.
C Corresponding author. Email: pmartip67@gmail.com
Marine and Freshwater Research 67(7) 1059-1071 https://doi.org/10.1071/MF15069
Submitted: 20 February 2015 Accepted: 31 July 2015 Published: 26 October 2015
Journal Compilation © CSIRO Publishing 2016 Open Access CC BY-NC-ND
Abstract
The three-dimensional (3-D) otolith shapes recently included in the Anàlisi de FORmes d’Otòlits (AFORO) database are defined by means of clouds of points across their surfaces. Automatic retrieval and classification of natural objects from 3-D databases becomes a difficult and time-consuming task when the number of elements in the database becomes large. In order to simplify that task we propose a new method for compacting data from 3-D shapes. The new method has two main steps. The first is a subsampling process, the result of which can always be interpreted as a closed curve in the 3-D space by considering the retained points in an appropriate order. The subsampling preserves morphological information, but greatly reduces the number of points required to represent the shape. The second step treats the coordinates of the 3-D closed curves as periodic functions. Therefore, Fourier expansions can be applied to each coordinate, producing more information compression into a reduced set of points. The method can reach very high information compression factors. It also allows reconstruction of the 3-D points resulting from the subsampling process in the first step. This parameterisation method is able to capture 3-D information relevant to classification of fish species from their otoliths, providing a greater percentage of correctly classified specimens compared with the previous two-dimensional analysis.
Additional keywords: fast Fourier transforms, feature extraction, shape analysis, three-dimensional contour descriptors, three-dimensional shape parameterisation.
Introduction
Fish otolith morphology has been widely used in the identification of stocks (Bird et al. 1986) and species (Schmidt 1969), phylogenetic reconstructions (Gaemers 1983), paleontological studies (Nolf 1985), food web analyses (Fitch and Brownell 1968), ecomorphological work (Lombarte and Fortuño 1992) and even sex identification and age estimation (Cardinale et al. 2004; Doering-Arjes et al. 2008). In all cases, adequate and complete information about otolith morphology is required. The Anàlisi de FORmes d’Otòlits (AFORO) website (http://aforo.cmima.csic.es, accessed 22 August 2015) is an open online catalogue of otolith images. It offers image analysis for automatic identification of fish species and populations using two-dimensional (2-D) closed contours representing otolith shape (Lombarte et al. 2006).
At present, the AFORO database contains more than 4600 images from 1440 Teleostean species, and its software tools have been used to generate an otolith atlas (Tuset et al. 2008; Sadighzadeh et al. 2012), morphological indices (Tuset et al. 2006), stock identifications (Capoccioni et al. 2011; Tuset et al. 2013; Sadighzadeh et al. 2014a), automatic species identifications (Parisi-Baradad et al. 2005, 2010; Tuset et al. 2012), ecomorphological comparisons (Cruz and Lombarte 2004; Lombarte and Cruz 2007; Sadighzadeh et al. 2014b), archaeological studies (Harrison 2009) and, most especially, prey identifications (Veiga et al. 2011; Neves et al. 2012; Otálora-Ardila et al. 2013; Rosas-Luis et al. 2014).
Attempts to develop three-dimensional (3-D) morphological studies of otoliths started with the use of X-ray microtomographies (Hamrin et al. 1999) for ageing fish and were followed by anatomical studies of the inner ear (Ramcharitar et al. 2004; Schulz-Mirbach et al. 2011, 2013; Kéver et al. 2014). We are engaged in a Spanish National Research Program project titled AFORO3-D, the main objective of which is to create 3-D morphological descriptors for whole otoliths and to provide more effective analysis and classification tools. The possibility of obtaining 3-D pictures will offer more reliability for the identification of otoliths by including external side and internal side (sulcus acusticus) curvature descriptions with high taxonomic value (Smale et al. 1995; Torres et al. 2000; Campana 2004; Tuset et al. 2008; Sadighzadeh et al. 2012). Most importantly, the software we develop will allow production and study of virtual 3-D models without having the otoliths actually in hand (Gauldie 1988; Popper and Fay 1993; Schulz-Mirbach et al. 2013). To that end, the University of Girona (Girona, Spain; Computer Vision and Robotics Research Group, ViCOROB) and AQSENSE Co. (see http://www.aqsense.com/, accessed 27 August 2015) have developed a purpose-built, single-camera, 3-D scanner prototype based on projected light-emitting diode (LED) light capable of digitising the shapes of otoliths ranging in size from 1 mm to a few centimetres. The objective of the present study was to create 3-D morphological descriptors of whole otoliths for analysis, automatic classification and automatic retrieval from an image database. Introducing a shape into a computer system in order to find the most similar shape already in the database or to fit a new 3-D natural object into a classification by comparing it with all the shapes in the database is very time consuming because of the huge amount of information involved for each object; it becomes progressively more difficult as the size of the database increases.
Our study of 3-D methods has focussed on otoliths of the family Scienidae (Percifomes). The sciaenids (drums or croakers) are characterised by their specialised acoustic communication. Their ability to produce sounds has long been known, as their English common names suggest, and it is part of their reproductive behaviour (Luczkovich et al. 1999; Ramcharitar et al. 2001). Their sagittae are characterised by their relatively large size (Cruz and Lombarte 2004), compared to the average size of fish otoliths, with strong development of the external side (Nolf 2013; Ramcharitar et al. 2004) and a specialised sulcus acusticus (Volpedo and Echevarría 2000; Monteiro et al. 2005; Ramcharitar et al. 2006; Tuset et al. 2008; Lin and Chang 2012).
Material and methods
Scanning protocol
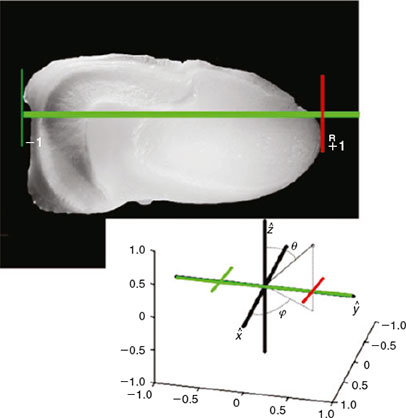
In order to obtain 3-D otolith surface images, samples from three species of Scienidae (Argyrosomus regius, Sciaena umbra and Umbrina cirrosa) were digitised, following a protocol similar to that used to capture the images in AFORO (Lombarte et al. 2006; Tuset et al. 2008) and also used by palaeontologists (Gaemers 1983; Nolf 1985; Schwarzhans 1996; Reichenbacher et al. 2007). Thus, all specimens share the same positions and orientations in the Cartesian coordinates after being digitised. In biological terms, the x-axis corresponds to the rostrum–postrostrum axis of the otolith. The y-axis corresponds to the otolith’s dorso–ventral axis. The z-axis is placed midway between the internal and external side extremes of the otolith and represents the width of the sagitta. Application of that protocol makes it unnecessary to determine descriptors invariant to rotations. The only invariance we need to consider with regard to scale, and that normalisation requires a scale factor. The otolith shape is scaled so that its length along the y-axis is 2 units (Fig. 1); therefore, for all the 3-D otolith shapes, this axis in our coordinate system extends from the point (0,–1,0) to (0,1,0).
|
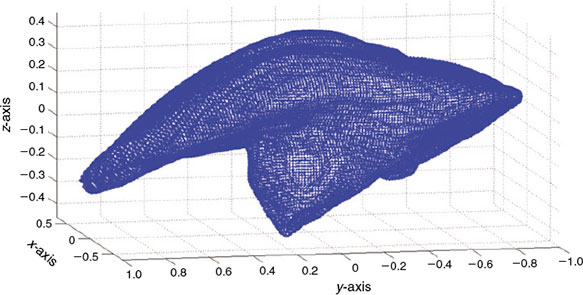
The otolith digitisation process involves scanning all otolith sides and the partial scans are joined to represent the entire 3-D object. The final result is a file containing a cloud of points representing the otolith’s shape. Specialised software and a technical expert are necessary for these tasks, so they are expensive and time consuming. Furthermore, the scanner system is limited by otolith size and only big sagittae, like those of the sciaenids, provide optimal results. The cloud of points representing an otolith surface can be seen in Fig. 2.
|
Surface parameterisation method
The proposed method can be broken down into two parts. The first consists of a subsampling process that generates a set of points that can always be interpreted as on a closed curve in the 3-D space. This process preserves important morphological information, but the number of points is markedly reduced. The second part consists of computing the discrete Fourier transform (DFT) on each of the 3-D coordinates. Periodic functions, such as those obtained from closed curves, can be expanded into a Fourier decomposition. This step achieves greater information compression by selecting a reduced set of the Fourier coefficients to represent the shape.
Subsampling process
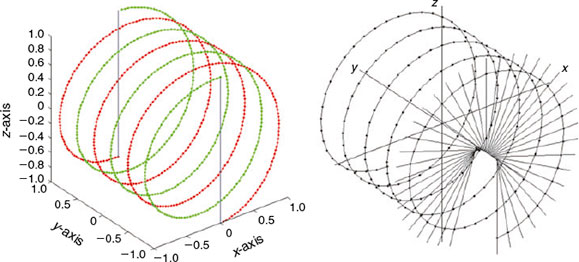
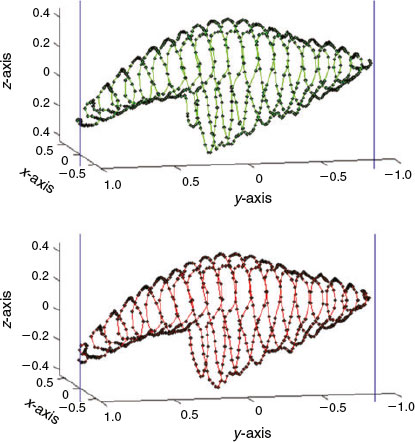
The subsampling process is driven by an auxiliary curve composed of two paths (forward and backward) that depend on two main parameters, P and L, selected for a particular application: P is the even number of points retained in the subsample and L is the number of loops that each of the two paths takes. The forward and backward paths of the auxiliary curve that guide the subsampling process are shown on the left side of Fig. 3. Each point on the auxiliary curve corresponds to a point on the otolith surface. The forward path is described by half the points (cxn,cyn,czn) and is shown in green on the left in Fig. 3. Those points are obtained using the following equations:
The points of the backward path are represented in red on the right in Fig. 3 and are obtained using the following equations:
The constant A can be taken as 1 (in practice, a larger number is used). Note that by construction the coordinate y goes from –1 to 1 and comes back from 1 to –1 in regular steps. So, the proposed subsampling process occurs by increments and decrements (forward and backward paths) along the y-axis, following the cyn points. On the right side of Fig. 3, there is a partial representation of the lines that go from the centre of the otolith mass to the points on the auxiliary curves.
|
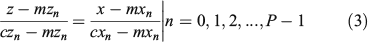
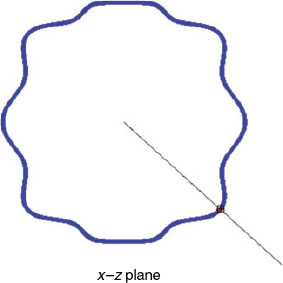
For each of the auxiliary curve points, a set of points is selected on the surface that belongs to the interval cyn – 2/P < cyn ≤ cyn + 2/P. Those points correspond to a slice orthogonal to the y-axis of width 4/P. If coordinates x and z of those selected points are represented on the x–z plane, a figure similar to a section of the shape is drawn. This idea is illustrated for a synthetic shape in Fig. 4. Next, the coordinates mxn and mzn of the centre of mass of each slice of points are computed to obtain the centre of the section at the point cyn (mxn,cyn,mzn). For every cyn point, the straight line from the centre of mass to the point on the auxiliary curve and orthogonal to the y-axis is computed using the coordinates of those points. That line guides the selection-of-point process. This idea is also represented in the illustration in Fig. 4 in which, for a given cyn, a representation of a set of points of a section appears together with the auxiliary line. In the x–z planes, the straight line equations are expressed in continuous form by the following:
The last step consists of selecting the point on the otolith surface that intersects with that line. In practice, because we have a discretised surface, there is no point on that surface that matches perfectly with the line, so different approaches could be considered. One is to select the discrete point on the surface closest to the line; another is to obtain an interpolation given a set of candidates. Both approaches begin with selecting a reduced set of points by narrowing the area around the line and analysing the points of the otolith included inside. In the first case, the region is tapered until it contains only a single point. In the second case, the process of narrowing the space around the line is stopped with several points inside and the point of interest is computed from them. With the original 3-D high-resolution otolith shapes used in our work, all these approaches perform very similarly. Fig. 5 is a representation of the normalised otolith cloud of points together with the auxiliary curve that guides the subsampling.
|
|
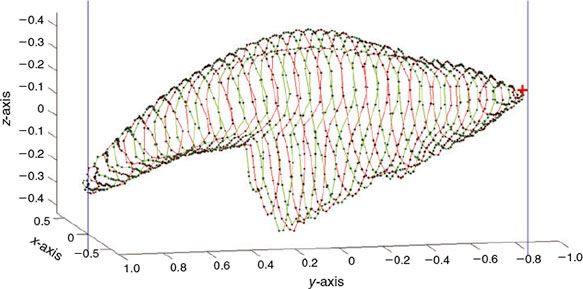
The subsampling process finishes once all the P points of the auxiliary curve have been processed, obtaining P points on the otolith surface representative of otolith shape. Fig. 6 shows the partial result of processing the forward (upper) and backward (bottom) paths when P = 1600 and L = 20; and the complete result for the same otolith is shown in Fig. 7.
|
|
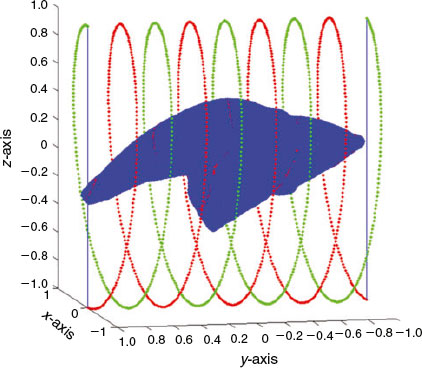
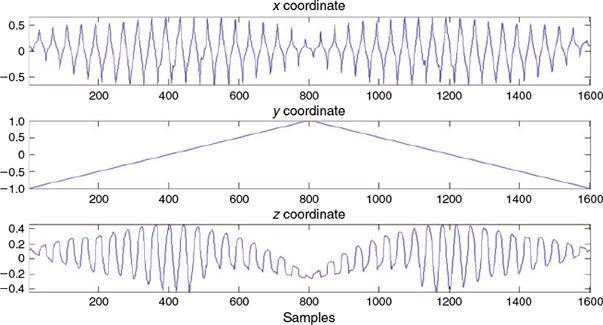
Fig. 8 shows plots of the coordinates x, y and z for the set of P = 1600 points that are represented in 3-D in Fig. 7. The x, y and z plots can be interpreted as the fundamental period of a periodic function. Note that the graph in the middle, once the number of P points is chosen, is, by construction, always the same. Because we know a priori that it contains no information, the y coordinate can be discarded in the next parameterisation step. Furthermore, notice that the y coordinate is always the same for all shapes. To provide an idea of the information reduction achieved by the down-sampling process, the shape represented with 150 000 real numbers in the present example could be represented with only 3200 real numbers: those required to represent x and z coordinates of the closed curve. Comparing the information provided by the original shape in Fig. 2 with the selection of points shown in Fig. 7, the reduction of points can be appreciated. However, Fig. 7 retains the most important morphological information from the otolith shape.
|
Discrete Fourier expansion of the coordinates: a fast algorithm by fast Fourier transformation to compute coefficients and to reconstruct closed curves
The subsampling method just presented has some particular characteristics. Samples of the otolith surface are taken at regular increments along the y-axis, thus the velocity of the closed curve sampling is constant. This approach differs from that described by Kuhl and Giardina (1982), which imposes constant sampling velocities around the closed curve for all of its x, y and z components, not just for one (y) as described herein. The advantage of our approach compared with that of Kuhl and Giardina (1982) is that our approach always uses the same number of points to obtain a closed curve from a scale-normalised shape. In our approach, the samples are taken at regular angular increments around the auxiliary curve; however, the otolith sections are not regular and can differ considerably in size, meaning that parts of the otolith are represented with different densities of points, with more points in the small sections, usually located at the otolith extremes. The considerable advantage of our approach is that all the closed curves obtained are described with the same number of points (P) regardless of the shape they describe. The user can choose the parameter P depending on the quality of the digital data or according to a given application.
With our subsampling process, a set of P representative points is selected from the original surface. Their spatial relationships are described with those points. They can also be described by the coefficients of a Fourier expansion derived by a DFT. The fast Fourier transform (FFT) algorithm applied to the P representative points provides a reduced set of parameters with which to reconstruct the closed contour of the objects. This will be illustrated for a single coordinate x and can be extended in a similar way to the coordinate z.
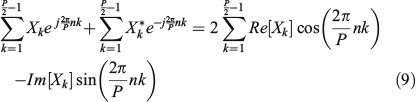
Consider the P points (xn,yn,zn) of the 3-D closed curve and take without loss of generality only the coordinate xn, where n = 0, 1,…, P – 1. By applying the DFT on xn, the DFT coefficient Xk is computed by:
and, therefore, the original xn can be written as Xk using the inverse DFT (IDFT) as follows:
Of course, with all the DFT coefficients Xk, the reconstruction xn where n = 0, 1,…, P – 1 is perfect. Now, let us take advantage of some DFT properties. Because we always deal with xn samples that are real, from Eqn 4 it is easy to see the well-known property of DFT coefficients (Proakis and Manolakis 1996):

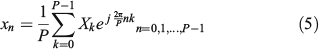
where the superindex asterisk (*) in Eqn 6 stands for the complex conjugate operation. This result means that only the first half of complex coefficients bring information and the other half are redundant, because they can be obtained from the first half. Now, let us split Eqn 5 into four parts:
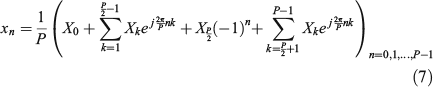
Then, analysing the last term of Eqn 7, rearranging the index of its summation from the last element to the first and using Eqn 6, from simple algebra of complex numbers, we have:
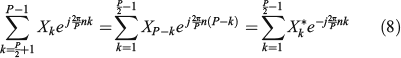
Then, considering this term together with the second term in Eqn 7 and taking into account that one is the complex conjugate of the other, we can rewrite Eqn 8 as follows:
Eqn 9 uses the result that the addition of a complex number with its complex conjugate gives twice its real part. Therefore, Eqn 5 becomes:
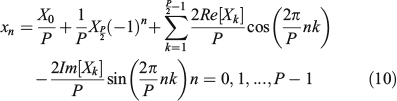
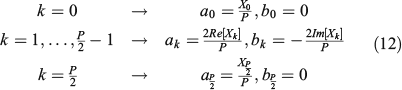
Note than (–1)n comes from cos  when k = P/2. Then, if we consider the discrete Fourier expansion of the coordinate xn, (n = 0, 1, ..., P – 1) provided by the coefficients ak and bk in the form:
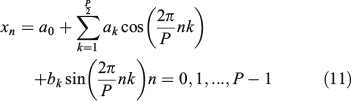
we can establish from Eqn 10 the relationship between real coefficients ak and bk with the complex DFT coefficients Xk as follows:
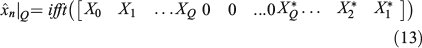
The coefficients Xk can be computed very quickly from the P samples of xn using the FFT algorithm, and similarly the xn samples can be recovered very quickly from Xk using the inverse fast Fourier transform (IFFT) algorithm. From only a reduced set of coefficients of Xk we can reconstruct the P samples of xn,  , where Q + 1 is the number of DFT coefficients employed in the reconstruction, and easily evaluate the appropriate number of those coefficients required to properly approximate the closed curve. So, to obtain the P samples of the reconstruction
  from the first Q+1 DFT coefficients of Xk, (X0,…, XQ) and keeping Q < P/2, we must construct the following vector of length P and take its IFFT in the following way:
The same applies for the z coordinate:
Here, Zk is the DFT coefficient of zn. Then, the points of the 3-D closed curve reconstruction will take the form ( ) when n = 0, 1,…, P – 1. Note that two real numbers are required for a pair of coefficients ak and bk, the same as required for Xk coefficients that are complex, so the use of both forms is equivalent, as was shown in Eqn 12. If reconstruction of shapes from a subset of coefficients is needed, then the use of DFT coefficients in Eqns 13 or 14 is preferable because the P selected points of 3-D closed curves can be recovered by performing only two one-dimensional (1-D) IFFT algorithms, which is achieved at computational cost of order of P × log2(P), P being the number of points (Van Loan 1992; Proakis and Manolakis 1996).
In order to show some reconstruction results, let us consider the shape shown in Fig. 2, now subsampled using P = 800 and L = 5. The set of the closed curve points requires 3 × 800 = 2400 real numbers to be represented in a 3-D space (the original cloud of points is defined by 150 000 real numbers). Reconstructions (the most smoothed curves) are shown in Fig. 9, together with the true points (which are repeated in all graphics) using 10 × 2, 15 × 2, 30 × 2, 45 × 2, 60 × 2 and 75 × 2 complex DFT coefficients, which represent 40, 60, 120, 180, 240 and 300 real numbers respectively.

|
It can be appreciated (Fig. 9) that reconstructions using more than 100 coefficients start to become very close to the original information. Those numbers could also be taken as a reference of the power compression achieved by this parameterisation. For instance, in the case shown, when 120 real numbers (30 × 2) are used, the information compression factor is greater than 1000.
To validate the present 3-D parameterisation method by solving an automatic classification problem in a practical context, we have performed a set of experiments. The first task was the training of different classification models based on those parameters. The first point to deal with was the limitations of working with a small dataset of only fourteen 3-D otolith images. To manage the data for training and testing the models, we used a cross-validation strategy because, for small datasets, it gives a good estimate of the predictive accuracy of the final trained model. Cross-validation requires multiple fits but makes efficient use of all the data. So, in all experiments, we partitioned the data into five divisions or ‘folds.’ Each fold is taken in turn for testing. A model is trained for each fold using all the data outside the fold and then the performance of each model is tested using the data inside the fold. Finally, we calculated the average test error over all the folds. As in AFORO project (Parisi-Baradad et al. 2010), we obtained good results with k-Nearest Neighbour (k-NN) classifications, so we decided to use those as basis of comparison. All the comparitor classifications were done using the algorithms provided by the Statistics and Machine Learning App of Matlab (MathWorks, see http://es.mathworks.com/products/statistics/?s_tid=hp_fp_list, accessed 27 August 2015).
Comparisons of the newly paramaterised 3-D contour analyses calculated in the present study with those from the 2-D AFORO system (Parisi-Baradad et al. 2010) were performed in terms of correct classification rate. Both parameterisations were obtained from a set of 14 otoliths belonging to the AFORO collection.
Results
In order to provide some descriptive information first, in this section we show a comparison between pairs of otoliths of the same species together with their closed curves obtained with L = 5 and P = 800. This information is represented graphically for A. regius (Fig. 10), S. umbra (Fig. 11) and U. cirrosa (Fig. 12). For all three species, the closed curve captures important morphological information about the original shape, and the information is more similar between otoliths from the same species than between those from different species (Figs 13, 14). In addition, the selection of a reduced set of coefficients produces a smoothing of the high-frequency information, which mostly derives from individual variability, so that consequently there is an increase of the similarity statistics between conspecific individuals.

|

|

|
|
|
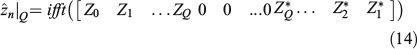
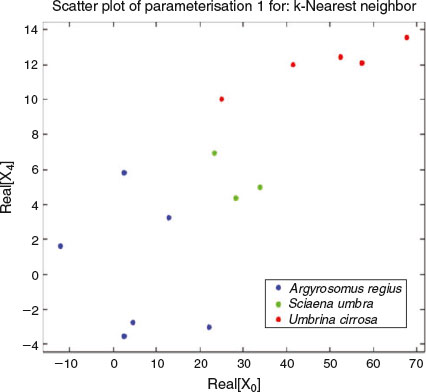
To explore the effect that the parameter L, half the number of loops in the closed curve, has on the automatic classification success rate, we developed the following experiment. For each value of L going from 1 to 6 and for all 3-D shapes in the database, we computed a particular parameterisation by taking the first 10 Fourier coefficients of both x and z closed contour coordinates to have 40 real coefficients per shape (formed by their real and imaginary parts). For every value of L, a parameterisation was obtained and a classification model was computed and tested. Very robust classification results of more than 92% correct were obtained in all cases. The next experiment was to do a feature selection process for each L in order to get the smallest selection of coefficients (among those 40) required to achieve, or even improve, the classification results. The feature selection process yielded very promising results. For some values of L, only two real coefficients (of our 3-D parameterisation) were required to achieve an estimated classification rate of 100%. Those results were obtained using the same cross-validation protocol and applying k-NN classifiers. Fig. 13 shows a scatterplot of the parameterisation composed only by two features, the real parts of the first and the fifth Fourier coefficients (computed, in that case, by applying the FFT on the x closed curve coordinate originated with L = 3). The parameterisation identified as Parameterisation 1, shows that the first and fifth FFT coefficients for each species cluster together when plotted as variables. A more general and powerful result shows that, for each value of L in the explored range 1–6, there are many different combinations of only three real coefficients that allow us to train and test a perfect classification model able to achieve a correct classification rate of 100%. Fig. 14 shows one of these three-parameter combinations, in this case also obtained from the FFT of the x coordinate given by L = 1.
Comparing both analytical methods (the 2-D AFORO v. the proposed 3-D methods; Fig. 15), the results of 3-D analysis give a greater percentage, reaching 100% correctly classified specimens compared with 78% with the previous 2-D analysis. The better results of 3-D analyses are related to including 3-D structures such as the sulcus acusticus and the external dome. In the case of S. umbra, the species that showed very poor results in 2-D analyses (0% of correct classifications), the 3-D analysis detects a squared and shorter cauda of the sulcus acusticus and less-developed external dome than of the other two sciaenid species compared in the analyses. For a wide range of parameter L, a very small set of FFT parameters is able to capture 3-D information relevant to classification of fish species from their otoliths.

|
Discussion
We have presented herein a new parameterisation method to represent 3-D otolith shapes that exhibits very good information compaction properties. The method deals with 3-D objects using 1-D transformations, so that operations required for the parameterisation and reconstruction are performed very fast, especially compared with methods that use higher-dimensional transformations (Van Loan 1992) or more complex and time-consuming decompositions, including spherical harmonics (Tanaka et al. 1993; Ertürk and Dennis 1997), two-variable Fourier descriptors (Wu and Sheu 1998), harmonic maps (Brett and Taylor 2000), spherical wavelets (Greenshields 2001), local geometric properties (Caunce and Taylor 2001), modelling from curves (Tubić et al. 2004) or geodesic analysis (Dam et al. 2008).
The proposed parameterisation method, in addition to its ability to compact information, deals with objects of different sizes with different numbers and heterogeneous densities of shape-defining points in different regions. The interesting property of this parameterisation is that, from a small selection of the coefficients, it is always possible to reconstruct the x,y,z coordinates. Thus, the users can maintain intuition about the object’s shape, providing a qualitative way to evaluate the information preserved and discarded when a selection of coefficients is considered. The best aspect of our approach is that the parameterisation and reconstruction of 3-D objects only requires two 1-D, fast transformations: the FFT in the parameterisation step and the IFFT in the reconstruction. Comparing this with previous 3-D otolith descriptions (Hamrin et al. 1999; Ramcharitar et al. 2004; Schulz-Mirbach et al. 2011, 2013), the process of otolith digitalisation developed under the AFORO3-D framework obtained very good 3-D representations.
There is an important drawback to this method. The imaging scanner and post-production image require a lot of human supervision, making the process slow and expensive. However, fast developments in 3-D technology are likely to produce faster and lower cost imaging in the very near future (Zitek et al. 2014). The new outputs can be analysed using our 3-D methods. Despite the present limitation of having very few images in the 3-D database, our parameterisation approach seems promising for automatic retrieval and classification. For the small sets of images available, it works perfectly when the available 2-D methods fail.
The parameterisation method must be proven with a bigger database in order to identify the best values of P (number of points per curve) and L (number of loops). The results obtained to date show that values of L from 1 to 6 are appropriate to parameterise the shapes. Those values of L seem to provide a balance between otolith shape preservation and robustness against small rotations that can appear in the digitisation protocol. It is known that the sulcus acusticus provides important information to identify species. The combined matching of 2-D outlines, curvatures and sulcus features (Torres et al. 2000; Monteiro et al. 2005; Sadighzadeh et al. 2012; Nolf 2013) seems to be a way to improve automatic classification results in large datasets (Parisi-Baradad et al. 2010). The proposed method provides an elegant and efficient way to do this in a simple 3-D parameterisation.
Acknowledgements
The authors are very grateful to all those people who have helped in the development of AFORO. This study was financed by project ‘AFORO3-D’ (Ref. CTM2010.1970) and ‘ANTROMARE’ (Ref. CTM2009.12214) of the Spanish National Research Program. The authors especially thank Josep Forest (University of Girona; VICOROB) and AQSENSE Co. for designing and developing the scanner prototype and David Otero for his skill in scanner testing and 3-D image digitisation and post-production. This work is the product of the Associated Unity program between Universitat de Vic – Universitat central de Catalunya and Consejo Superior de Investigaciones Científicas (CSIC).
References
Bird, J. L., Eppler, D. T., and Checkley, D. M. (1986). Comparison of herring otoliths using Fourier series shape analyses. Canadian Journal of Fisheries and Aquatic Sciences 43, 1228–1234.| Comparison of herring otoliths using Fourier series shape analyses.Crossref | GoogleScholarGoogle Scholar |
Brett, A. D., and Taylor, C. J. (2000). Automated construction of 3-D shape models using harmonic maps. In ‘Proceedings of Medical Image Understanding and Analysis’, July 2000, London. (Eds S. Arridge and A. Todd-Pokropek.) pp. 173–178. (BMVA: London.)
Campana, S. E. (2004). ‘Photographic Atlas of Fish Otoliths of the Northwest Atlantic Ocean.’ (NRC Research Press: Ottawa, ON, Canada.)
Capoccioni, F., Costa, C., Aguzzi, J., Menesatti, P., Lombarte, A., and Ciccotti, E. (2011). Ontogenetic and environmental effects on otolith shape variability in three European eel (Anguilla anguilla, L.) Mediterranean populations. Journal of Experimental Marine Biology and Ecology 397, 1–7.
| Ontogenetic and environmental effects on otolith shape variability in three European eel (Anguilla anguilla, L.) Mediterranean populations.Crossref | GoogleScholarGoogle Scholar |
Cardinale, M., Doering-Arjes, P., Kastowsky, M., and Mosegaard, H. (2004). Effects of sex, stock, and environment on the shape of known-age Atlantic cod (Gadus morhua) otoliths. Canadian Journal of Fisheries and Aquatic Sciences 61, 158–167.
| Effects of sex, stock, and environment on the shape of known-age Atlantic cod (Gadus morhua) otoliths.Crossref | GoogleScholarGoogle Scholar |
Caunce, A., and Taylor, C. J. (2001). Building 3-D sulcal models using local geometry. Medical Image Analysis 5, 69–80.
| Building 3-D sulcal models using local geometry.Crossref | GoogleScholarGoogle Scholar | 1:STN:280:DC%2BD3MzjvFKhsQ%3D%3D&md5=b107f2e551402c8048234e2441abf644CAS | 11231178PubMed |
Cruz, A., and Lombarte, A. (2004). Otolith size and its relationship with colour patterns and sound production. Journal of Fish Biology 65, 1512–1525.
| Otolith size and its relationship with colour patterns and sound production.Crossref | GoogleScholarGoogle Scholar |
Dam, E. B., Fletcher, P. T., and Pizer, S. M. (2008). Automatic shape model building based on principal geodesic analysis bootstrapping. Medical Image Analysis 12, 136–151.
| Automatic shape model building based on principal geodesic analysis bootstrapping.Crossref | GoogleScholarGoogle Scholar | 18178124PubMed |
Doering-Arjes, P., Cardinale, M., and Mosegaard, H. (2008). Estimating population age structure using otolith morphometrics: a test with known-age Atlantic cod (Gadus morhua) individuals. Canadian Journal of Fisheries and Aquatic Sciences 65, 2342–2350.
| Estimating population age structure using otolith morphometrics: a test with known-age Atlantic cod (Gadus morhua) individuals.Crossref | GoogleScholarGoogle Scholar |
Ertürk, S., and Dennis, T. J. (1997). 3-D model representation using spherical harmonics. Electronics Letters 33, 951–952.
| 3-D model representation using spherical harmonics.Crossref | GoogleScholarGoogle Scholar |
Fitch, J. E., and Brownell, R. L. (1968). Fish otoliths in cetacean stomachs and their importance in interpreting feeding habits. Journal of the Fisheries Research Board of Canada 25, 2561–2574.
| Fish otoliths in cetacean stomachs and their importance in interpreting feeding habits.Crossref | GoogleScholarGoogle Scholar |
Gaemers, P. A. M. (1983). Taxonomic position of Cichlidae (Pisces, Perciformes) as demonstrated by the morphology of their otoliths. Netherlands Journal of Zoology 34, 566–595.
| Taxonomic position of Cichlidae (Pisces, Perciformes) as demonstrated by the morphology of their otoliths.Crossref | GoogleScholarGoogle Scholar |
Gauldie, R. W. (1988). Function, form and time-keeping properties of fish otoliths. Comparative Biochemistry and Physiology Part A: Physiology 91, 395–402.
| Function, form and time-keeping properties of fish otoliths.Crossref | GoogleScholarGoogle Scholar |
Greenshields, I. (2001). 3D shape approximants via spherical wavelet decompositions. In ‘14th IEEE Symposium on Computer-Based Medical Systems’, 26–27 July 2001, Bethesda, MD. p. 31–35. (Institute of Electrical and Electronics Engineers: Bethesda, MD.)
Hamrin, S.F., Arneri, E., Doering-Arjes, P., Mosegaard, H., Patwardhan, A., Sasovq, A., Schatz, M., Van Dyck, D., Wickström, H., and Van Heel, M. (1999). A new method for three-dimensional otolith analysis. Journal of Fish Biology 54, 223–225.
| A new method for three-dimensional otolith analysis.Crossref | GoogleScholarGoogle Scholar |
Harrison, R. (2009). The archaeology of the Port Hedland coastal plain and implications for understanding the prehistory of shell mounds and middens in northwestern Australia. Archaeology in Oceania 44, 81–98.
| The archaeology of the Port Hedland coastal plain and implications for understanding the prehistory of shell mounds and middens in northwestern Australia.Crossref | GoogleScholarGoogle Scholar |
Kéver, L., Colleye, O., Lugli, M., Lecchini, D., Lerouvreur, F., Herrel, A., and Parmentier, E. (2014). Sound production in Onuxodon fowleri (Carapidae) and its amplification by the host shell. Journal of Experimental Biology 217, 4283–4294.
| Sound production in Onuxodon fowleri (Carapidae) and its amplification by the host shell.Crossref | GoogleScholarGoogle Scholar | 25520383PubMed |
Kuhl, F. P., and Giardina, C. R. (1982). Elliptic Fourier features of a closed contour. Computer Graphics and Image Processing 18, 236–258.
| Elliptic Fourier features of a closed contour.Crossref | GoogleScholarGoogle Scholar |
Lin, C.-H., and Chang, C.-W. (2012). ‘Otolith Atlas of Taiwan fishes.’ (National Museum of Marine Biology and Aquarium: Taiwan.)
Lombarte, A., and Cruz, A. (2007). Otolith size trends in marine fish communities from different depth strata. Journal of Fish Biology 71, 53–76.
| Otolith size trends in marine fish communities from different depth strata.Crossref | GoogleScholarGoogle Scholar |
Lombarte, A., and Fortuño, J. M. (1992). Differences in morphological features of the saculus of the inner ear of two hakes (Merluccius capensis and M. paradoxus, Gadiformes) inhabits from different depth of sea. Journal of Morphology 214, 97–107.
| Differences in morphological features of the saculus of the inner ear of two hakes (Merluccius capensis and M. paradoxus, Gadiformes) inhabits from different depth of sea.Crossref | GoogleScholarGoogle Scholar |
Lombarte, A., Chic, Ò., Parisi-Baradad, V., Olivella, R., Piera, J., and García-Ladona, E. (2006). A web-based environment from shape analysis of fish otoliths. The AFORO database. Scientia Marina 70, 147–152.
Luczkovich, J. J., Sprague, M. W., Johnson, S. E., and Pullinger, R. C. (1999). Delimiting spawning areas of weakfish Cynoscion regalis (Family Sciaenidae) in Pamlico Sound, North Carolina using passive hydroacoustic surveys. Bioacoustics 10, 143–160.
| Delimiting spawning areas of weakfish Cynoscion regalis (Family Sciaenidae) in Pamlico Sound, North Carolina using passive hydroacoustic surveys.Crossref | GoogleScholarGoogle Scholar |
Monteiro, L., Di Beneditto, A. P. M., Guilhermo, L. H., and Rivera, L. A. (2005). Allometric changes and shape differentiation of sagitta otoliths in sciaenid fishes. Fisheries Research 74, 288–299.
| Allometric changes and shape differentiation of sagitta otoliths in sciaenid fishes.Crossref | GoogleScholarGoogle Scholar |
Neves, V. C., Bried, J., Gonzalez-Solis, J., Roscales, J. L., and Clarke, M. R. (2012). Feeding ecology and movements of the Barolo shearwater Puffinus baroli baroli in the Azores, NE Atlantic. Marine Ecology Progress Series 452, 269–285.
| Feeding ecology and movements of the Barolo shearwater Puffinus baroli baroli in the Azores, NE Atlantic.Crossref | GoogleScholarGoogle Scholar |
Nolf, D. (1985). Otolithi piscium. In ‘Handbook of Paleoichthyology’. (Ed. H. P. Schultze.) pp. 1–10. (Gustav Fischer Verlag: Stuttgart.)
Nolf, D. (2013). ‘The Diversity of Fish Otoliths, Past and Present’. (Eds E. Steurbaut, R. Brzobohaty and K. Hoedemakers.) (Royal Belgian Institute of Natural Sciences: Bruxelles.)
Otálora-Ardila, A., Herrera, L. G., Flores-Martinez, J. J., and Voigt, C. C. (2013). Marine and terrestrial food sources in the diet of the fish-eating myotis (Myotis vivesi). Journal of Mammalogy 94, 1102–1110.
| Marine and terrestrial food sources in the diet of the fish-eating myotis (Myotis vivesi).Crossref | GoogleScholarGoogle Scholar |
Parisi-Baradad, V., Lombarte, A., García-Ladona, E., Cabestany, J., Piera, J., and Chic, Ò. (2005). Otolith shape contour analysis using affine transformation invariant wavelet transforms and curvature scale space representation. Marine and Freshwater Research 56, 795–804.
| Otolith shape contour analysis using affine transformation invariant wavelet transforms and curvature scale space representation.Crossref | GoogleScholarGoogle Scholar |
Parisi-Baradad, V., Manjabacas, A., Lombarte, A., Olivella, R., Chic, Ò., Piera, J., and García- Ladona, E. (2010). Automatic taxon identification of teleost fishes in an otolith online database. Fisheries Research 105, 13–20.
| Automatic taxon identification of teleost fishes in an otolith online database.Crossref | GoogleScholarGoogle Scholar |
Popper, A. N., and Fay, R. R. (1993). Sound detection and processing by fish: critical review and major research questions. Brain, Behavior and Evolution 41, 14–38.
| Sound detection and processing by fish: critical review and major research questions.Crossref | GoogleScholarGoogle Scholar | 1:STN:280:DyaK3s7mtFSrsA%3D%3D&md5=c1442f1c489f1257578c6580d2d21bb7CAS | 8431753PubMed |
Proakis, J. G., and Manolakis, D. G. (1996). ‘Digital Signal Processing. Principles, Algorithms and Applications’, 3rd edn. (Prentice-Hall: Upper Saddle River, NJ, USA.)
Ramcharitar, J., Higgs, D. M., and Popper, A. N. (2001). Sciaenid inner ears: a study in diversity. Brain, Behavior and Evolution 58, 152–162.
| Sciaenid inner ears: a study in diversity.Crossref | GoogleScholarGoogle Scholar | 1:STN:280:DC%2BD387ns1yqtg%3D%3D&md5=e37b65e0c51500395256257d652f94c6CAS | 11910172PubMed |
Ramcharitar, J., Deng, X., Ketten, D., and Popper, A. N. (2004). Form and function in the unique inner ear of a Teleost: the silver perch (Bairdiella chrysoura). The Journal of Comparative Neurology 475, 531–539.
| Form and function in the unique inner ear of a Teleost: the silver perch (Bairdiella chrysoura).Crossref | GoogleScholarGoogle Scholar | 15236234PubMed |
Ramcharitar, J., Gannon, D. P., and Popper, A. N. (2006). Bioacoustics of the family Sciaenidae (croakers and drumfishes). Transactions of the American Fisheries Society 135, 1409–1431.
| Bioacoustics of the family Sciaenidae (croakers and drumfishes).Crossref | GoogleScholarGoogle Scholar |
Reichenbacher, B., Sienknecht, U., Küchenhoff, H., and Fenske, N. (2007). Combined otolith morphology and morphometry for assessing taxonomy and diversity in fossil and extant killifish (Aphanius, †Prolebias). Journal of Morphology 268, 898–915.
| Combined otolith morphology and morphometry for assessing taxonomy and diversity in fossil and extant killifish (Aphanius, †Prolebias).Crossref | GoogleScholarGoogle Scholar | 17674357PubMed |
Rosas-Luis, R., Villanueva, R., and Sánchez, P. (2014). Trophic habits of the Ommastrephid squid Illex coindetii and Todarodes sagittatus in the northwestern Mediterranean Sea. Fisheries Research 152, 21–28.
| Trophic habits of the Ommastrephid squid Illex coindetii and Todarodes sagittatus in the northwestern Mediterranean Sea.Crossref | GoogleScholarGoogle Scholar |
Sadighzadeh, Z., Tuset, V. M., Dadpour, M. R., Otero-Ferrrer, J. L., and Lombarte, A. (2012). ‘Otolith Atlas from the Persian Gulf and the Oman Sea Fishes.’ (Lambert Academic Publications: Saarbrücken, Germany.)
Sadighzadeh, Z., Valinassab, T., Vosugi, G., Motallebi, A. A., Fatemi, M. R., Lombarte, A., and Tuset, V. M. (2014a). Stock differentiation of Lutjanus johnii (Lutjanidae) of the Persian Gulf and the Oman Sea using otoliths. Fisheries Research 155, 59–63.
| Stock differentiation of Lutjanus johnii (Lutjanidae) of the Persian Gulf and the Oman Sea using otoliths.Crossref | GoogleScholarGoogle Scholar |
Sadighzadeh, Z., Otero-Ferrer, J. L., Lombarte, A., Fatemi, M. R., and Tuset, V. M. (2014b). An approach to unraveling the coexistence of snappers (Lutjanidae) using otolith morphology. Scientia Marina 78, 353–362.
| An approach to unraveling the coexistence of snappers (Lutjanidae) using otolith morphology.Crossref | GoogleScholarGoogle Scholar |
Schmidt, W. (1969). The otoliths as a means for differentiation between species of fish of very similar appearance. In ‘Proceedings of Symposium of Oceanography of Fisheries Research in Tropical Atlantic, Abidjan, Ivory Coast, 1966’. pp. 393–396. (UNESCO: Paris, France.)
Schulz-Mirbach, T., Heß, M., and Plath, M. (2011). Inner ear morphology in the Atlantic molly Poecilia mexicana: first detailed microanatomical study of the inner ear of a Cyprinodontiform species. PLoS One 6, e27734.
| Inner ear morphology in the Atlantic molly Poecilia mexicana: first detailed microanatomical study of the inner ear of a Cyprinodontiform species.Crossref | GoogleScholarGoogle Scholar | 1:CAS:528:DC%2BC3MXhsF2is7fK&md5=d7b79460cdd341887012baf578058959CAS | 22110746PubMed |
Schulz-Mirbach, T., Heß, M., and Metscher, B. D. (2013). Sensory epithelia of the fish inner ear in 3-D: studied with high-resolution contrast enhanced microCT. Frontiers in Zoology 10, 63.
| Sensory epithelia of the fish inner ear in 3-D: studied with high-resolution contrast enhanced microCT.Crossref | GoogleScholarGoogle Scholar | 24160754PubMed |
Schwarzhans, W. (1996). Otoliths from the Maastrichtian of Bavaria and their evolutionary significance. In ‘Mesozoic Fishes – Systematics and Paleoecology’. (Eds G. Arratia and G. Viohl.) pp. 417–431. (Verlag Dr. Friedrich Pfeil: München.)
Smale, M. J., Watson, G., and Hecht, T. (1995). Otolith atlas of southern African marine fishes. Ichthyological Bulletin of the J. L. B. Smith Institute of Ichthyology 1, 1–253.
Tanaka, K., Sano, M., Mukawa, N., and Kaneko, H. (1993). 3-D object representation using spherical harmonic functions. In ‘Proceedings of the 1993 IEEE/RSJ International Conference on Intelligent Robots and Systems ’93, IROS ’93’, 26–30 July 1993, Yokohama. pp. 1873–1880. (Institute of Electrical and Electronics Engineers: Yokohama, Japan.)
Torres, G. J., Lombarte, A., and Morales-Nin, B. (2000). Variability of the sulcus acusticus in the sagitta otolith of the genus Merluccius. Fisheries Research 46, 5–13.
| Variability of the sulcus acusticus in the sagitta otolith of the genus Merluccius.Crossref | GoogleScholarGoogle Scholar |
Tubić, D., Hébert, P., and Laurendeau, D. (2004). 3-D surface modeling from curves. Image and Vision Computing 22, 719–734.
| 3-D surface modeling from curves.Crossref | GoogleScholarGoogle Scholar |
Tuset, V. M., Rosin, P. L., and Lombarte, A. (2006). Sagittae otolith shape used in the identification of fishes of the genus Serranus. Fisheries Research 81, 316–325.
| Sagittae otolith shape used in the identification of fishes of the genus Serranus.Crossref | GoogleScholarGoogle Scholar |
Tuset, V. M., Lombarte, A., and Assis, C. A. (2008). Otolith atlas for the western Mediterranean, north and central eastern Atlantic. Scientia Marina 72, 1–198.
| Otolith atlas for the western Mediterranean, north and central eastern Atlantic.Crossref | GoogleScholarGoogle Scholar |
Tuset, V. M., Azzurro, E., and Lombarte, A. (2012). Identification of Lessepsian fish species using the sagittae otolith. Scientia Marina 76, 289–299.
| Identification of Lessepsian fish species using the sagittae otolith.Crossref | GoogleScholarGoogle Scholar |
Tuset, V. M., Parisi-Baradad, V., and Lombarte, A. (2013). Application of Fourier weight and shape for discriminating scabbarfishes (Aphanopus spp.) in the Norteastern Atlantic waters. Journal of Fish Biology 82, 1746–1752.
| Application of Fourier weight and shape for discriminating scabbarfishes (Aphanopus spp.) in the Norteastern Atlantic waters.Crossref | GoogleScholarGoogle Scholar | 1:STN:280:DC%2BC3sngsFejtw%3D%3D&md5=02aaf14252b50d2ee40a011a64401fffCAS | 23639170PubMed |
Van Loan, C. (1992). ‘Computational Frameworks for the Fast Fourier Transform.’ (Siam: Philadelphia.)
Veiga, P., Xavier, J. C., Assis, C. A., and Erzini, K. (2011). Diet of the blue marlin, Makaira nigricans, off the south coast of Portugal. Marine Biology Research 7, 820–825.
| Diet of the blue marlin, Makaira nigricans, off the south coast of Portugal.Crossref | GoogleScholarGoogle Scholar |
Volpedo, A. V., and Echevarría, D. D. (2000). ‘Catálogo y claves de otolitos para la identificación de peces del Mar Argentino. 1. Peces de Importáncia Económica.’ (Dunken: Buenos Aires.)
Wu, M.-F., and Sheu, H.-T. (1998). Representation of 3-D surfaces by two-variable Fourier descriptors. IEEE Transactions on Pattern Analysis and Machine Intelligence 20, 858–863.
| Representation of 3-D surfaces by two-variable Fourier descriptors.Crossref | GoogleScholarGoogle Scholar |
Zitek, A., Mayrhofer, B., Oehm, J., Irrgeher, J., and Prohaska, T. (2014): Affordable 3-D scanning of small otoliths for improved shape analysis by photogrammetry techniques. In ‘ICES/CIEM, Book of Abstracts of the 5th International Otolith Symposium 2014 (IOS2014)’, 20–24 October 2014, Mallorca. (Eds B. Morales-Nin and A. J. Geffren.) pp. 287–290. (ICES/CIEM Symposium: Peguera, Spain.)