

Big data opportunities and challenges for assessing multiple stressors across scales in aquatic ecosystems
K. A. Dafforn A B I , E. L. Johnston A B , A. Ferguson C , C.L. Humphrey D , W. Monk E , S. J. Nichols F , S. L. Simpson G , M. G. Tulbure A and D. J. Baird HA Evolution and Ecology Research Centre, School of Biological, Earth and Environmental Sciences, University of New South Wales, Sydney, NSW 2052, Australia.
B Sydney Institute of Marine Sciences, Mosman, NSW 2088 Australia.
C Office of Environment and Heritage, PO Box A290, Sydney South, NSW 1232, Australia.
D Environmental Research Institute of the Supervising Scientist, PO Box 461, Darwin, NT 0801, Australia.
E Canadian Rivers Institute, Faculty of Forestry and Environmental Management, University of New Brunswick, PO Box 4400, Fredericton, NB, E3B 5A3, Canada.
F Institute for Applied Ecology and MDBfutures Collaborative Research Network, University of Canberra, Canberra, ACT 2601, Australia.
G CSIRO Land and Water, Centre for Environmental Contaminants Research, Locked Bag 2007, Kirrawee, NSW 2232, Australia.
H Environment Canada @ Canadian Rivers Institute, Department of Biology, University of New Brunswick, PO Box 4400, Fredericton, NB, E3B 5A3, Canada.
I Corresponding author. Email k.dafforn@unsw.edu.au
Marine and Freshwater Research 67(4) 393-413 https://doi.org/10.1071/MF15108
Submitted: 12 March 2015 Accepted: 20 July 2015 Published: 22 October 2015
Journal Compilation © CSIRO Publishing 2016 Open Access CC BY-NC-ND
Abstract
Aquatic ecosystems are under threat from multiple stressors, which vary in distribution and intensity across temporal and spatial scales. Monitoring and assessment of these ecosystems have historically focussed on collection of physical and chemical information and increasingly include associated observations on biological condition. However, ecosystem assessment is often lacking because the scale and quality of biological observations frequently fail to match those available from physical and chemical measurements. The advent of high-performance computing, coupled with new earth observation platforms, has accelerated the adoption of molecular and remote sensing tools in ecosystem assessment. To assess how emerging science and tools can be applied to study multiple stressors on a large (ecosystem) scale and to facilitate greater integration of approaches among different scientific disciplines, a workshop was held on 10–12 September 2014 at the Sydney Institute of Marine Sciences, Australia. Here we introduce a conceptual framework for assessing multiple stressors across ecosystems using emerging sources of big data and critique a range of available big-data types that could support models for multiple stressors. We define big data as any set or series of data, which is either so large or complex, it becomes difficult to analyse using traditional data analysis methods.
Introduction
Globally, the states of many aquatic ecosystems, freshwater, estuarine and marine, are under threat from a complex array of pressures and stressors, which vary in their distribution and intensity across temporal and spatial scales (Burton and Johnston 2010; Harris and Heathwaite 2012). Drivers of change include both human actions (e.g. intensification of industries and land-use), and climate change and natural variability, and these drivers influence how various pressures and associated stressors (e.g. contaminants) modify the state of an ecosystem at different scales (Baird et al. 2016). Existing ecosystem monitoring and assessment programs focus on collection of data to support management goals, yet the data collected are variable in quality and quantity. These data may be insufficient to support more comprehensive risk assessments of ecosystem degradation, resulting from multiple stressors occurring over broad spatial and temporal scales (Dafforn et al. 2014).
Historically, monitoring and assessment of aquatic ecosystems have focussed on collection of information on water quality, in terms of descriptions of physical and chemical conditions, but increasingly habitat (including environmental flows and riparian conditions) and biota are included (Norris and Thoms 1999; Dafforn et al. 2012). Data gathering has traditionally focussed at the site scale, with data subsequently aggregated to inform larger-scale assessments, e.g. at the ecosystem scale (Borja et al. 2008). For example, the European Union Water Quality Framework Directive (WFD) aims to manage multiple ecosystem components at the river-basin scale, with integration across political and administrative boundaries (Borja et al. 2009). Within such assessments, consideration of multiple stressors is generally either a specific or implied goal in aquatic-ecosystem assessment, yet the approaches employed generally lack a truly systematic focus in identifying the potential for combined effects of multiple stressors and apportioning cause.
Identifying and ranking key stressors pose a challenge in natural ecosystems. In such multi-stressed systems, untangling the effects of individual drivers can require many observations. Inductive approaches based on ‘expert judgement' are often used but may lead to incorrect diagnoses, with the more obvious or visible agents being causally implicated without clear mechanistic evidence. In a recent review of the state of the science in cumulative impacts assessment, Halpern and Fujita (2013) promoted an approach developed for assessment of multiple stressor impacts on coastal areas (Halpern et al. 2008), which organises pressures and associated stressors to gauge system vulnerability. This approach has seen widespread use across aquatic ecosystem types, including river (Vörösmarty et al. 2010), Great Lake (Allan et al. 2013) and marine assessments (Ban et al. 2010).
The Halpern et al. (2008) approach focuses on assessing vulnerability of specific habitat types to specified human activities (pressures) and their associated stressors. However, vulnerability is a difficult concept to capture, particularly within larger systems, owing to the diffuse nature of key ecosystem elements, and a general lack of pervasive data by which to encompass their essential properties. By relying on a classification system based heavily on expert judgment as a method to rank and weight stressors, it suffers from a lack of objectivity, as it focuses on potential exposure to specific hazards rather than cumulatively quantifying their effects. Furthermore, it presumes substantial local knowledge among those experts for its application in specific situations, whereas stressors are defined in broad, overlapping categories, conflating potential risks and potentially leading to confounding errors. Other strategies developed in the United States and Australia seek to address the uncertainty inherent in large-scale assessments of the cumulative impacts of multiple disparate stressors, by incorporating Bayesian methods into ecological risk assessment (Wiegers et al. 1998; Pollino et al. 2007; Ayre and Landis 2012; Bayliss et al. 2012). These models are often flexible with the potential to integrate qualitative knowledge (e.g. expert opinion) with quantitative primary data (Bayliss et al. 2012). This goes some way to reduce uncertainty, which is inherent in complex ecological systems (Ayre and Landis 2012). The incorporation of large primary datasets into ecological risk assessment to inform environmental regulation is addressed in detail by Van den Brink et al. (2016).
The advent of high-performance computing systems, coupled with new earth observation platforms, has accelerated the adoption of geographical information systems (GIS) and remote sensing tools in ecosystem assessment (Pettorelli et al. 2014). Their use in interpretation of scale-dependent, ecological phenomena is an emerging area, and here we explore synergies with key areas of stress ecology. Moreover, the increasing availability of molecular techniques for environmental applications is now providing a vast pool of data relevant to interpreting changes in ecosystem health (e.g. organism biodiversity, abundance and impacts to function) (Chariton et al. 2016). These diverse and often large data sources provide us with increased information on potential drivers, stressors and biological responses of a scale never previously realised. The increased availability of such data can help improve the ranking of stressors by providing more observations of individual drivers and their associate stressors and affected responses, and reduce the need for decisions based on expert opinion alone.
As indicated above and in Baird et al. (2016), a key focus of the 2014 Sydney workshop was to find and report commonality among diverse approaches developed by aquatic scientists working on marine and freshwater systems. Here we propose a conceptual framework for assessing multiple stressors across ecosystems using emerging sources of large datasets often termed ‘big data’. These data include satellite, mapping, geophysical and monitoring data sources. We define big data as any set or series of data, which is either so large or complex that it becomes difficult to analyse using traditional data analysis methods (Hampton et al. 2013). This includes the new data being generated by advances in ecological monitoring, biomonitoring science, ecogenomics and earth observational technologies. These big datasets have the potential to address questions over larger spatial and temporal scales and be used to investigate complex environmental problems. We give examples and critique a range of available big-data types that could support models for multiple stressors and the assessment of their effects. The two complementary papers from the workshop addressed how multiple stressors can be better evaluated with ecogenomic tools and analyses (Chariton et al. 2016), and with the incorporation of big data into ecological risk assessment to inform environmental regulation (Van den Brink et al. 2016).
Ecosystem monitoring across scales
Environmental monitoring across ecosystems requires consideration of both the temporal and spatial scales at which stressors may be acting in different systems. In terms of spatial scale, this can vary substantially across systems, from the nano- to the bioregion scale. For example, the Australian and New Zealand water quality guidelines seek to distinguish the information sought and acquired, and associated tradeoffs, at broad-scale (regional) and finer scales respectively (ANZECC/ARMCANZ 2000).
Broad-scale monitoring is applied at catchment, regional or larger scales, using, typically, rapid-assessment methods. Rapid assessment is typically applied over wide geographical areas for first-pass determination of the extent of a problem or potential problem (broad-scale land-use issues, diffuse-source effluent discharges or information for State of Environment Reporting), screening of sites, or to assess results from large-scale remediation efforts (ANZECC/ARMCANZ 2000). These methods do not provide detailed quantitative information for a site, but are cost-effective and quick enough to generate sufficient data for initial management purposes, and assist managers to decide what further types of information may be required, and where to direct efforts. In Australia, the most developed rapid-biological-assessment method is the Australian River Assessment System (AUSRIVAS), a River Invertebrate Prediction and Classification System (RIVPACS)-type predictive modelling method for freshwater systems using macroinvertebrate communities in rivers and streams. RIVPACS and similar approaches have been developed or implemented in the EU, UK and Canada (Turak et al. 1999; Clarke et al. 2003; Davy-Bowker et al. 2006; Hargett et al. 2007). The risks in only applying rapid-assessment methods are that insufficient details are gathered at site-level to detect small changes, resulting from disturbance or management actions and this generally prevents determining the magnitude of response.
Finer-scale monitoring is typically required for sites of particular interest (e.g. sites of high conservation value, major developments or point-sources of particular potential concern). Attention to good experimental design and quantitative sampling is prescribed in the monitoring requirements, aiming to result in replicated and representative community-structure data, but adequate methods to achieve this do not always exist (ANZECC/ARMCANZ 2000).
Two key features distinguish finer-scale and broad-scale monitoring programs: the provision of detailed quantitative and accurate assessments of selected indicators – but at limited (fine) spatial scales, for reasons of high cost; and the provision of less accurate first-pass assessments of broad-scale indicators, but at greater (broad) spatial scales (ANZECC/ARMCANZ 2000). Inference at finer scale is typically directed at detecting stressors associated with the putative disturbance in question. If these studies are not long-term and are spatially constrained, they may not detect or diagnose trends in unforeseen stressors e.g. stressors acting at broader-scales = upon reference sites.
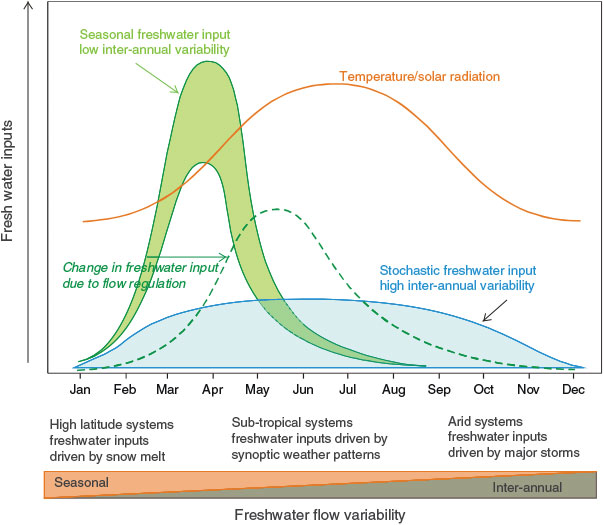
The temporal scale of monitoring programs is also important in detecting anthropogenic impacts against background variation associated with natural cycles in environmental stressors. Two examples of major environmental stressors (light and freshwater inputs) that interact to drive the biological responses of an aquatic system are described in Fig. 1. Seasonal variation in the availability of light and nutrients (as delivered by freshwater inputs) are the principal drivers of new primary production in aquatic ecosystems (Harding 1994). As such, the nature of biological responses (primary and secondary production) and resultant ecosystem structure are shaped by the relative timing in the annual cycles of these two environmental stressors. These dynamics of multiple stressors vary considerably among different systems, with some subject to greater environmental variability than others. Therefore, the choices for the temporal scale of monitoring among systems are important in order to capture this variability. Systems that experience more stochastic freshwater inputs exhibit much higher variability in biological responses because of variability in the timing of freshwater delivery relative to optimal light or temperature. For example, arid systems tend to exhibit dramatic boom-bust responses to flooding events, which may occur as infrequently as once every 2–3 decades (e.g. Lake Eyre in central Australia; (Kingsford et al. 1999) (Fig. 1). Human stressors (e.g. flow regulation) may cause a shift in the natural range of variation in key environmental stressors causing significant changes in biological function and ecosystem structure (Fig. 1) (Baldwin et al. 2013).
|
Environmental stressors and biological indicators measured at a particular point in time and space integrate processes over variable periods of time, preceding the time of collection. An understanding of this is fundamental to the interpretation of monitoring data. Measurements should be collected over carefully selected timescales so that the data will provide a time-integrated history of the system (Table 1). The requirement for data gathered at daily, monthly, or yearly intervals etc. should be considered in any study and these scales incorporated in ecosystem-based approaches, so that we can identify and describe the nature of any changes observed. For example, salinity measured within an estuary is dependent on the state of the tide (timescale of hours) and recent freshwater inflows (weeks); therefore, sampling may need to include hourly and weekly replication. Furthermore, nutrient concentrations are dependent on tide and freshwater inflows, but also on internal recycling processes (e.g. benthic fluxes); therefore, they integrate over seasonal timescales (Table 1). In general, sediment properties integrate over longer timescales than pelagic properties and therefore some properties such as grain sizes, metals and organic contaminants may require less frequent sampling. However, factors that modify the bioavailability of contaminants, for example redox conditions, may vary over short timescales (Simpson et al. 2005).

|
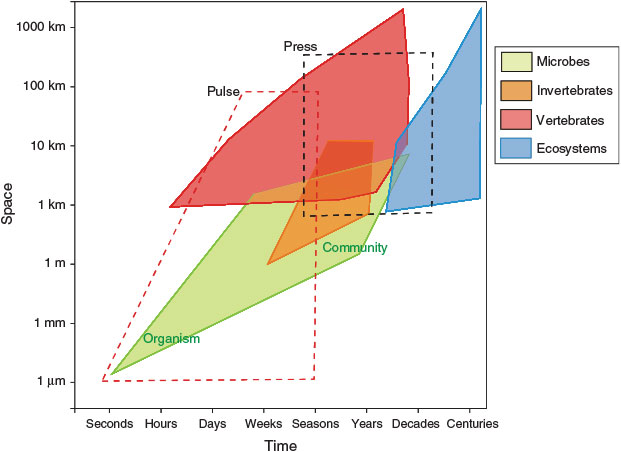
The spatial and temporal scale at which organisms respond to environmental stressors (i.e. whether they are pulse or press phenomena; Lake 2000) and the subsequent influence on ecological processes will depend on the system and the organism type (e.g. microbe, invertebrate, vertebrate) (Fig. 2). In general, we expect organism size and life span will determine their response at different scales, and thus their suitability as indicators for monitoring at various spatial and temporal scales. In part, this is because of a general increasing sensitivity to environmental conditions with decreasing size and greater ability to adapt rapidly (Hilty and Merenlender 2000; McKinley et al. 2011; Sun et al. 2012; Dafforn et al. 2014), and the increasing ability to disperse greater distances with increasing size thus increasing the spatial extent of environmental exposure (Bowler and Benton 2005). Hence, the temporal and spatial scale at which data are required in order to detect ecological change (from single or multiple stressors), should always be determined by the nature of the driver e.g. pulse or press, and the process or organism(s) of interest (Fig. 2).
|
Using the example of estuarine monitoring, biological responses (of phytoplankton, invertebrates, or vertebrates) to the major environmental stressors or drivers (e.g. light, temperature and freshwater flow) will vary significantly within an annual cycle (Fig. 3). Observed patterns in biotic composition in time and space will reflect (1) the timing of freshwater flow or nutrients relative to seasonal variations of temperature and light; and (2) the individual lifespans and life-histories of the biota. Phytoplankton respond to nutrient delivery as turbidity reduces, temperatures rise and photosynthetically active radiation increases (Fig. 3). The initial spring bloom collapses once nutrients are depleted; however, remineralisation of organic matter in the sediments during summer fuels subsequent blooms in late summer and autumn. Invertebrate communities (pelagic and benthic) exhibit classic predator–prey dynamics, with seasonal peaks in late summer–autumn (McQueen et al. 1986). Fish communities tend to exhibit more inter-annual variation compared with invertebrate communities. Given such spatial and temporal discontinuity between responses of different taxa to environmental stressors and the differential sensitivity of these taxa, a range of stressors require monitoring over different scales in order to identify the causes of change in a multi-stressed system, and to limit errors of interpretation.

|
Ecological models are widely used in ecosystem monitoring to understand and predict changes over spatial and temporal scales among systems. Such modelling approaches require cross-system building blocks that may incorporate physics (e.g. geomorphology, hydrodynamics and temperature), chemistry (e.g. water quality parameters) and biology (e.g. genes, cells, organisms, species, populations, assemblages and communities). Furthermore, ecological functions and processes are integral to building comprehensive models, and also need to be captured in their outputs. Such functions include photosynthesis, chemosynthesis and decomposition. Processes might be measured and influenced on a local scale, including recruitment, immigration, emigration, competition, facilitation and predation. Regional processes include climate, evolution and dispersal. The process of building a model, therefore, can require extensive information on inputs (e.g. the physical and chemical components), and the outputs (e.g. biological health components) have the potential to guide future monitoring efforts. For example, heuristic or conceptual models are frequently used to generate hypotheses and identify gaps or knowledge requirements, whereas statistical or empirical models often investigate relationships whose accuracy can only be improved through extensive data calibration. Information incorporated into models can allow us to communicate important relationships between pressures and stressors. Models also facilitate scaling-up of measurements, such that information collected on smaller scales can be extrapolated to make predictions on larger scales, both temporally and spatially. Models are, however, only as useful as the information available to build and calibrate them. Therefore, care is needed to ensure there are sufficient data (e.g. quantity, quality, form) to calibrate and test model predictions.
Detecting human-induced change
Approaches that seek to assess human-induced change require a comparison with some notion of baseline or pre-impact state to identify impacts and targets for improvements. Practically, and in recognition that the best-available natural state typically has some degree of minimal disturbance, while still maintaining ecological integrity, this is often described as a ‘reference state’. Human activities may drive environmental conditions beyond the reference state by changing the range, frequency or spatial scale of conditions (Fig. 1), or by introducing an entirely new condition (e.g. a new contaminant or invasive species). Such extensions or modifications to conditions would represent the presence of new or potential stressors and would be measurable as changes in the range of parameters (e.g. temperature, pH, salinity, light, nutrients sedimentation, hydrology, disease, turbidity, invasive species and toxicants). Informative data sources may also be available at the driver level (e.g. catchment land use, rainfall, shipping activity, fishing and mining). These may be useful proxies for predicting and identifying potential stressors during early conceptual modelling. Sampling of stressors and ecological responses should be targeted to the spatial and temporal scale of the expected response to that activity or pressure, and a reference set of environmental and biological conditions must be ascertained over a spatial and temporal scale relevant to that ecosystem type.
Prediction and early detection of possible effects of human and natural stressors are important components of effective monitoring programs so that substantial and ecologically important impacts can be avoided. Early information enhances the options for management; the information may be as specific as bioaccumulating contaminants downstream of a point source or, through broad-scale coverage, pinpointing of potential ‘hot-spots’ that would otherwise be missed (e.g. ANZECC/ARMCANZ 2000). Monitoring targets requires clear articulation, for example, about whether we want to know that systems are functioning in a sustainable way or how they are functioning relative to a reference condition. Ecosystem-based approaches to understanding cumulative impacts first require basic research, including baseline monitoring, to detect changes caused by humans that are outside the range of natural variability.
Distinguishing multiple stressors
The mode of impact should ideally be sampled over consistent spatial and temporal scales for stressors that are known to have similar mechanisms of action. Distinguishing the effects of multiple stressors will require multiple lines of evidence, regardless of the size of the available data streams. Observational data may be incorporated into several data-driven models that can assess the relative importance of different human and environmental stressors (e.g. Artificial Neural Networks and Boosted Regression Trees (Chariton et al. 2016). These modelling approaches are predicated on substantial observational-data holdings. For this reason, quality and quantity of such data will determine the strength of any predictions. Experimental studies of interacting stressors may provide evidence for causal interactions. Historical data and expert opinion are often used to complement empirical data to populate Bayesian approaches (Van den Brink et al. 2016). However, studies attempting to demonstrate a causal relationship in environmental systems face challenges associated with multiple stressors, natural variability, the difficulty of performing rigorous experiments, and the issue of time and money required to undertake such studies. Transparent and logical methods are needed to synthesise and evaluate the vast pool of evidence from the multiple studies in existing scientific research (see Norris et al. 2012). If the maintenance of broader ecosystem integrity (diversity, function and process) is the goal of management, then the smallest spatial and temporal scale of variation relevant to any one driver or ecological response should determine the finest scale of data needed. Not all data sources may need to be collected at this scale.
Shifting baselines
Apart from the complexities of multiple stressor effects, dealing with broad-scale changes in environmental conditions, such as the response to climate change, is a significant challenge for biological monitoring. Changes in baseline conditions mean that users of monitoring approaches that refer to reference conditions may need to be aware of any changes in the reference conditions themselves as a consequence of altered climatic conditions. Studies examining trends in reference-site condition show that sites can remain within a stable reference condition for some time (Metzeling et al. 2002; Nichols et al. 2010; T. B. Reynoldson, unpubl. data, 2006). However, these findings cannot be accepted as a general conclusion (Reynoldson and Wright 2000), but rather highlight the need for more extensive datasets to describe long-term trends in ecological condition, particularly in light of predicted climate changes. Combining these data with modern statistical approaches, GIS and remote sensing tools can allow a detailed understanding of the effects of climate alone and in combination with multiple impacts on ecological condition.
Ecosystem function measured at a particular point in time integrates a history of complex interactions between environmental and human stressors that may span decades. In the example provided in Fig. 4 (Glibert et al. 2011), changes in the trophic structure of San Francisco Bay have arisen from (1) changes in nutrient loadings to the system, which have altered the nitrogen : phosphorus ratios; (2) the introduction of an invasive bivalve Corbula amurensis; and (3) decadal cycles in freshwater flow. Complex interactions between biogeochemical processes, ambient nutrient ratios and predator–prey dynamics have resulted in a dramatic decline in pelagic-based foodchains, the establishment of invasive macrophytes (Egeria densa), and an increase in the abundance of toxic cyanobacteria. The trajectories of change for any ecosystem component (e.g. the pelagic fish Delta smelt, Hypomesus transpacificus; Fig. 4) occur over decadal timescales, and can only be fully understood with reference to interactions among environmental drivers and their flow-on effects on phytoplankton and zooplankton community composition (Glibert et al. 2011). As such, detection of the true impacts resulting from these or other human-induced stressors (e.g. chemical contaminants) may require multiple data streams collected over long periods.

|
New big-data sources for biomonitoring
Significant advances in ecological monitoring, biomonitoring science, ecogenomics and earth observational technologies provide us with new opportunities to address problems across large spatial and temporal scales, which were previously impossible. Broadly classified, datasets can provide input to models as drivers, stressors and state (defined in Baird et al. 2016), with some data sources informing more than one of these categories (Tables 2, 3). These big datasets now provide the opportunity to directly link drivers, stressors and state, with much readier detection and diagnosis of human-induced changes for a broad spectrum of scenarios. Short-term, point-source impacts (e.g. contaminant inputs from stormwater overflow) can be continuously monitored by water quality sondes and passive samplers, which are complemented by DNA or RNA-based biomonitoring data (Table 2). These sources provide the fine-scale long-term monitoring data at relevant temporal scales, required to detect and diagnose trends related to these human-induced changes. Similarly, many data sources are now able to identify potential impacts from land-use change (Table 2) and include land use and vegetation mapping over large spatial scales (Table 3). Furthermore, these human-induced changes need to be considered in relation to climate change, and shifting baselines may create challenges for assigning a reference state. The extensive datasets now available to describe long-term trends in ecological condition (e.g. satellite data on sea surface temperature and chlorophyll-a, mapping of vegetation type and habitat loss together with ongoing biodiversity surveys; Tables 2, 3), will be crucial for interpreting impacts, for example, as a consequence of habitat shifts induced by climate warming.

|

|
Earth observation technologies: data opportunities, challenges, and needs
Most earth observation techniques provide information on drivers and sometimes state, and range from global to sub-metre in spatial resolution, and time scales of over 3 decades at daily to annual resolution. These data streams are too numerous to exhaustively list, and here we provide examples of data types and streams that are available or becoming available in the near future (Table 3). The liberalisation of satellite data policy (e.g. Landsat archive) and the advent of new high-performance computing capabilities (e.g. the National Computational Infrastructure, home to the southern hemisphere’s fastest supercomputer and file systems, http://nci.org.au/, accessed 7 August 2015) enable us to systematically process high volumes of geospatial data across large scales (Tulbure and Broich 2013). The trends in environmental applications for big data have led to the development and usage of open-data repositories (e.g. DataONE: https://www.dataone.org/, accessed 7 August 2015), and usage of open-source software for data analysis (rOpenSci initiative: http://ropensci.org/, accessed 7 August 2015). Moreover, emerging technologies (e.g. drones) and new satellites, sensors for characterising broad classes of phytoplankton (e.g. flow cytometry in the marine environment: http://www.bbe-moldaenke.de/chlorophyll/algaeonlineanalyser/specifications-aoa/, accessed 7 August 2015), and processing platforms (European Space Agency’s Sentinels, NASA’s SWOT, Tandem-X and -L) will continue to expand our capabilities to monitor (observe, analyse and quantify) earth-systems dynamics in the bio-, litho-, hydro- and cryosphere. The increasingly higher spatial and temporal resolution provided by earth observation technologies will provide biological, physical and chemical information at scales required to improve biological monitoring and assessment and the discrimination of multiple stressors.
The requirements for spatial and temporal resolution of data will differ depending on assessment purpose (e.g. annual predictions for large bioregions or daily predictions for an estuary) and whether they are intended for input to models or as proxies of state. Drivers include, for example, human activities (industry activity, development, urbanisation) and climate events (drought, storms), and require information on spatial intensity (e.g. of industry activity) and temporal duration of change in state. For example, baseline geology does not change significantly on a temporal scale of seasons and years, but land use changes seasonally for agriculture, and rainfall and river levels change from daily to weekly. Geospatial maps, remote sensing, and monitoring networks can already provide much of these data for regional geology, land cover and river levels respectively. Websites like ‘toolkit.net.au’ increase the accessibility to water and catchment-management-utility tools (databases and models) for broad datasets (e.g. climate, land use, soil hydrology, stream flow, urban water, water balance, water quality).
We are well placed to make use of existing spatial and temporal geospatial data for biological monitoring, but there are still data challenges, which include: (1) availability of metadata; (2) data ‘openness’ in terms of data portals; and (3) public access and ownership of the data. Large amounts of high value, distributed information are collected by individual researchers but this information needs to be shared before its collective power needs can be harnessed (Hampton et al. 2013). Furthermore, in many parts of the world, big data are proprietary; availability of data in different formats and different repositories that are not necessarily compatible with one another; and existing data (e.g. Landsat) still need pre-processing before being readily usable. Many existing datasets are proxies rather than direct measurements of the process of interest e.g. land cover as a proxy for the spatial scale of human activity and related drivers. Monitoring of the state of the environment (i.e. ecosystem health) is also not yet feasible at the optimal resolution for desired temporal and spatial scales. In the context of ecosystem risk assessment, there are few geospatial datasets that provide both structural and functional biological measurements and also few that provide the high frequency needed for chemical measurements (e.g. pesticides). As a result, ecosystem risk assessment remains largely reliant on proxies rather than direct measurements.
Regarding chemical stressors, routine monitoring of the >10 000 man-made industrial and household chemicals is not feasible in many countries. However, improved use of proxies (e.g. basing loads of pesticides on agriculture intensity, or heavy metals on industry discharge data) and improvements in passive-sampling techniques to provide time-integrated concentrations of all major classes of chemical stressors (e.g. Vrana et al. 2005) may increasingly provide suitable model inputs for chemical stressors. Improvements in data networks already have the potential to provide real-time information on habitat stressors such as river-water levels as well as physical–chemical stressors such as suspended solids concentrations and water quality (electrical conductivity, pH, dissolved oxygen etc.). Continuous or remotely sensed environmental data are a key requirement for improved stressor-response modelling and (with or without telemetry) early detection capability. Continuous (in-situ) or remotely sensed stressor and response measures or surrogates, include at least electrical conductivity, water temperature, turbidity, chlorophyll a, DO, and continuous or remote-monitoring techniques for specific contaminants are also improving but limited in coverage and by often inadequate detection limits (e.g. Vrana et al. 2005; Dong et al. 2015).
To couple with earth observation technologies, inputs to models require greater use of proxies (e.g. changes in land use providing a proxy for changes in pesticide inputs, or metal-industry type and density a for metal-contaminant inputs). Stressor and state vary more temporally and spatially than the drivers; however, most data are snapshots in space and time, which reflect ‘here’ and ‘now’. Thus, currently the assumptions based on best professional judgement often dictate the outcomes when using these data to extrapolate models to larger temporal and spatial scales.
The availability of observation technologies for monitoring of stressors (e.g. contaminants) and more detailed aspects of state (e.g. biodiversity, abundance) are far fewer than those for monitoring the drivers. Remote sensing of key wetland-plant species, forms and community types is a notable exception for habitat and biodiversity assessment (e.g. Adam et al. 2010). Currently there is a strong reliance on local datasets with small coverage of species. However, improvements in image-analysis systems, often associated with videography and passive acoustic monitoring are expected to improve monitoring of larger organisms (e.g. birds (LaRue et al. 2014) and even marine mammals (Fujioka et al. 2014)). Next-Generation-Sequencing (NGS, ‘omics’, ecogenomics techniques) approaches are also increasing the availability of biological information for monitoring programs, and may potentially lead to semi-automated biodiversity monitoring in some environments e.g. DNA metabarcoding where multiple species in a bulk sample can be identified from modern or ancient DNA in an automated fashion (Taberlet et al. 2012). Here we present an overview of molecular tools for bioassessment, but for a detailed discussion of emerging ecogenomic technologies and analyses please see Chariton et al. (2016) in this volume.
Molecular tools: data opportunities, challenges, and needs
The rapid development of molecular techniques for taxonomic identification, and the advent of next-generation DNA or RNA sequencing (NGS) technologies, along with associated advancement in data generation and analysis methods, have made molecular analyses both fast and cost-effective (Shokralla et al. 2012). Thus, an opportunity now exists to develop a platform for biomonitoring at all scales, which is both time and cost-efficient. Recent studies have used NGS approaches to study biodiversity in various habitats and taxonomic groups, from all domains of life (Hajibabaei 2007). The potential to use these technologies to extract species-level information on key bioindicator insect species from aquatic-biomonitoring samples was demonstrated using a combination of cytochrome c oxidase (COI) DNA barcodes linked to a locally generated barcode reference library (Hajibabaei et al. 2011).
The advent of NGS tools, which can extract information rapidly and cost-effectively from environmental samples, offers the promise of a solution to the problems associated with the time-consuming sorting and identification of organisms, and the workflow bottleneck it presents for aquatic-monitoring programs. Moreover, the data generated from molecular methods have new properties (Baird and Hajibabaei 2012). They contain a mix of ‘named’ operational taxonomic units (OTUs) (i.e. those DNA sequences that can be linked to a Linnean taxonomic name from a relevant database such as GenBank or the Barcode of Life Database) and ‘unnamed’ OTUs (i.e. DNA sequences that can be placed in a phylogenetic context but have not previously been deposited in a database) (Baird and Hajibabaei 2012). DNA-based information that could be extracted from biomonitoring samples offers great change in the immediacy, accuracy and quantity of information, which can be obtained, potentially without sacrificing current biomonitoring infrastructure investment (Baird and Hajibabaei 2012).
How to deal with these new sources and types of information within the biomonitoring context presents a major challenge, which we discuss briefly here (but see Chariton et al. 2016). The large datasets that are generated by NGS create a disparity between the small sample sizes and large numbers of measurements, which may increase the false detection (Type 1 error) rate. A diverse range of tools exists to address these statistical difficulties including the commonly used false detection rate (FDR) corrections, which rely on Bonferroni-based calculations (Benjamini and Hochberg 1995; Waite and Campbell 2006). Post-sampling strategies for molecular data to assign taxonomic information to sequences are also diverse and the attempts to standardise processing and analyses are challenging because of the rapid development of this field. A range of processing software packages exists to remove duplicate sequences introduced during the PCR amplification process, to cluster sequences based on similarity and more accurately estimate phylogenetic composition. Denoising and chimera removal are additional steps to correct problems in sequence data and improve biological accuracy. These different approaches to preparing the raw sequences will affect diversity estimates to some extent, but the overall trends, which explain relationships with drivers or stressors, remain the same (Morgan et al. 2013). Furthermore, many of the problems that exist for processing molecular data are somewhat ephemeral as platforms rapidly evolve. This ephemerality points to other drawbacks with using rapidly developing technologies, the potential difficulty in comparing across studies and the potential of longer-term redundancy. When different studies use alternative marker genes or primer sets to generate amplicons, meta-analyses must be carried out based on either existing taxonomy (likely of a fairly low resolution), or by potentially time-consuming re-analysis of data against a curated database containing all required elements (e.g. Full length 18S rRNA gene sequences, which cover different variable regions used in different studies). However, such databases are rapidly being generated (e.g. SILVA, BOLD) and the computational requirements for re-analysis being continually improved.
Work has begun on molecular freshwater biomonitoring (Hajibabaei et al. 2011; Pilgrim et al. 2011; Carew et al. 2013), integrating these new approaches with existing frameworks; their application in large-scale monitoring is the future for bioassessment. Other studies in aquatic systems explored the use of NGS to estimate biodiversity in marine meiofaunal communities (Creer et al. 2010) and similar approaches were used on marine sediments, in order to study the response of Australian coastal biota to contaminants (Chariton et al. 2010; Sun et al. 2012; Sun et al. 2013; Chariton et al. 2014; Dafforn et al. 2014). Another Australian study involving chironomid midges (Chironomidae) demonstrated that most of these species could be identified by using COI and Cytb amplicon sequences that were matched against DNA reference databases of Sanger sequenced voucher species (Carew et al. 2013). In the context of international river biomonitoring, molecular analysis successfully obtained species-level information from samples to compare patterns of taxon occurrences in urbanised and conservation landscapes (Hajibabaei et al. 2011). These studies demonstrate the potential to extract rich biodiversity data from biomonitoring samples using NGS technologies.
The methods for biomonitoring of stream condition have struggled to meet the needs in regards to diagnosing the causes of poor condition. Environmental managers require objective methods to determine why stream condition is degraded, to enable appropriate remedial actions. New developments in diagnostic-biomonitoring indices, which are based on the invertebrate traits (not just their taxonomic identity), are promising (Schäfer et al. 2011). Such diagnostic indices may require taxonomic identification at the lowest taxonomic unit possible. This is because of variation in the tolerance to stressors exhibited by various taxa within the coarser groupings, such as taxonomic families. Molecular techniques could generate the species-level information required to deliver timely breakthroughs in terms of diagnostic assessment or the large-scale adoption of diagnostic tools (Jones 2008; Baird and Hajibabaei 2012). DNA techniques and the increase in data generated could increase our ability to diagnose factors degrading aquatic ecosystems.
Basing aquatic ecosystem management purely on biomonitoring data, i.e. the present practice, limits inference on stressor effects on ecosystem services (Tolonen et al. 2014). There has been an increasing emphasis on using ecological-trait analyses to determine which stressors are influencing the functioning of aquatic communities (Schäfer et al. 2011). Multi-taxa responses to human stressors (Johnston et al. 2008; Johnston et al. 2009) are required to assess the likely functional consequences of species loss. Future research may also reveal functional genes associated with suites of taxa, and thus directly assess ecosystem-functional consequences using molecular analysis of biomonitoring data.
The ecological values associated with aquatic health are based on maintenance of ecological integrity (including ecosystem functioning). However, the links between data (usually based on taxonomic richness) and ecosystem-function data (based on functional traits) are not always demonstrated. Molecular analysis provides information on a wide range of biota, both living and dead. There is, therefore, an increased amount of information available from molecular techniques, which can allow us to distinguish responses over longer time periods and greater spatial scales, as well as differentiating between multiple stressors. Although the potential for molecular approaches to sample living and dead organisms creates a useful time-integrated response to stressors, these data may provide challenges when interpreting a recent impact, as any lethal effects may be masked. However, it is also possible to retrieve only the signature of ‘active’ organisms using RNA approaches rather than DNA.
Case study: using big-data sources to improve biomonitoring
As discussed above, there are two distinct approaches to bioassessment programs; broad-scale monitoring, and targeted, finer-scale, intervention monitoring. However, in some circumstances the focus on one without the other will make it difficult for managers to understand and tackle major management issues such as the effects of climate change, significant changes in land use on waterways (including intervention programs) and the widespread effects of multiple stressors. If only broad-scale monitoring were undertaken, the data may be of insufficient detail to detect small changes resulting from management actions at specific locations. Finer-scale intervention monitoring alone may be effective for detecting and assessing specific (especially point-source) human disturbances. However, if such finer-scale monitoring was the only means of data collection for broader land management issues then lack of relevant long-term data across broader scales could obscure shifts in baseline conditions. This, in turn, could obscure responses to management actions, or fail to detect unforeseen impacts of major stressors at those broader scales. Without broad-scale, surveillance monitoring of aquatic conditions, any unexpected declines in river health may pass undetected and hinder swift remediation. We examine some typical or high-profile drivers and pressures upon riverine systems and monitoring programs at finer and broad-scales (Fig. 5) to identify potential improvements in approaches offered by ecogenomics and earth observation and other remote-data-acquisition technologies.

|
Improving the habitat template for RIVPACS approaches
The reference-condition approach to biological assessment is widely used in many countries to detect human induced change in freshwater systems. For example, in the United Kingdom (RIVPACS; Wright et al. 2000), Australia (AUSRIVAS; Simpson and Norris 2000), Canada (CABIN; Reynoldson et al. 2000; Armanini et al. 2013), and the United States (where a mix of multi-metric and RIVPACS-type assessments are used; Hawkins et al. 2010) RIVPACS-type approaches use models to predict site-specific benthic-invertebrate assemblages expected at sites (i.e. the assemblage that should be there in the absence of human-induced stress). New spatial tools are becoming increasingly available, particularly GIS and remote sensing tools, along with an array of catchment-scale map layers describing attributes, such as geology, land use, vegetation type, and climate (Frazier et al. 2012). These data offer alternative approaches to identifying reference sites (Yates and Bailey 2010) and are sources of potential new predictor variables (Armanini et al. 2013), which could potentially improve predictive ability of the models (Ostermiller and Hawkins 2004). Armanini et al. (2013) constructed a similar RIVPACS-type predictive model for Atlantic Canada but instead of relying on ground-based environmental data, generated a robust model using GIS-based rather than local, ground-measured, habitat variables. Armanini et al. (2013) highlighted the advantages in this approach for future large-scale implementation of river biomonitoring, i.e. a standardised approach with global application.
Broad-scale monitoring
Improving empirical models
Successful strategies for sustainable water use will depend on our ability to describe long-term trends and responses of stressors in natural ecological systems in a cost-effective yet rigorous way. A major challenge is assessing the level of environmental change in natural systems before these transformations irreversibly change fundamental ecological processes. Broad-scale assessments that use macroinvertebrate data, such as RIVPACS-type approaches, may trade-off attributes of sensitivity (to impact detection) for spatial coverage (ANZECC/ARMCANZ 2000). This may be exacerbated if spatial coverage of reference sites used to develop the predictive models was not adequate to capture the variability in the ‘reference condition’. For example, jurisdictional models may encompass enormous geographical areas with significant climate variation (e.g. in Australia, the entire states of Western Australia and Queensland, encompassing tropical and temperate climes). If the resolution of sampling sites does not capture these variations, the implications for models may be that test sites are not correctly matched to a reference condition, thus hindering the sensitivity to detect impact. Thus, accuracy in broad-scale assessments can potentially be improved with greater density of reference sites in datasets for model development. Currently, obtaining such data involves expense in accessing multiple sites for sampling as well as the time-consuming process of sorting and identifying the invertebrates from the sample matrix collected at each reference site. Together, these costs can constrain timely water quality assessment (Haase et al. 2010).
Increasingly, it is becoming difficult to obtain the taxonomic expertise required to accurately identify freshwater or marine macroinvertebrate taxa, particularly to species level (Buyck 1999). Traditional taxonomic approaches can also introduce errors in the sample sorting and identification phase that affect data quality. Potential sources of error can include: failure to remove all desired organisms in a sample or sub-sample and bias in the selection of specimens from the sample (Humphrey et al. 2000); inability to identify damaged specimens; and errors in species identifications (a particular problem with early instars). Most bioassessment programs have developed quality-control procedures to minimise these sources of errors, but they cannot eliminate them and these quality-control measures add to program cost. In freshwater bioassessment, the costs are balanced with the need for sufficient information to distinguish impaired sites (Jones 2008), but because of the need to minimise bioassessment costs and to expedite the process, only a sub-set of the collected sample is used and taxonomic identification is further restricted to coarse (e.g. family-level) resolution. The urgent need is to develop sensitive, cost-effective, robust bioassessment sampling and processing methods that can extract sufficient information for bioassessment and enable the advancement of diagnostic assessment tools. Traditional morphological taxonomy cannot generate the timely and robust data required for new breakthroughs in bioassessment techniques (Baird and Hajibabaei 2012; Dafforn et al. 2014).
Development of sensitive, more cost-effective, robust bioassessment sampling and processing methods may also help in improving model performance by removing socio-political constraints impeding a common approach to regional model development, for example:
-
Model boundaries should be based on natural physio-graphic, bioregional or drainage boundaries.
-
Within improved model boundaries from the above, standardising methods across jurisdictions would enhance the ability to combine datasets and extend models for reliable, broader State of Environment assessments and reporting. Such standardisation would also reduce inter-operability biases and errors at various steps in the protocol including, for example, taxonomic identifications. Standardisation could also consider not only adoption of a more common predictor-variable suite, but a reduced reliance on on-ground measured variables more prone to subjectivity in selection and measurement.
Broad-scale bioassessment application in large countries such as Australia and Canada brings with it remoteness of sampling sites and access problems for extended periods of the year. Any capacity to reduce expensive access costs (e.g. helicopter use) and time in the field will result in more sites sampled (i.e. increase reference-site density, see above). This may be achieved through remotely acquired proxies for ground-measured environmental variables and by removing on-ground processing of biological samples.
RIVPACS-type predictive models provide a powerful platform to demonstrate improved performance through the refinements offered by the new science tools listed above (Table 3). Many of the identified weaknesses listed above may be potentially redressed.
Improving the biological response measures
Next-generation molecular sequencing technologies, with associated new data generation and analysis methods, are rapidly developing for taxonomic identifications. The potential to use these technologies to extract species-level information on key freshwater biomonitoring species from samples has been demonstrated (Baird and Hajibabaei 2012). Potential applications redressing limitations identified above, include:
-
Rapidity of data generation.
-
Generation of a local barcode reference libraries.
-
Removal of errors associated with traditional taxonomic identifications based on morphology.
-
Generation of highly sensitive species-level information from multiple taxonomic groups, with improved diagnostic value. This includes a basis for trait development.
-
Applicable to impact and conservation assessments, including detection of cryptic invasive biota,
-
Identification of functional genes.
-
Cost-effective, systematic monitoring of test sites and sentinel or reference sites over time to assess effects of broad-scale land-use changes and climate change, as described above.
-
The collection of biological data sets on a scale to match that of environmental data.
Demonstration programs for potential improvements to RIVPACS or AUSRIVAS models are now feasible, based on the approaches described above.
Improved databases defining drivers (human actions), pressures, stressors and state (habitat)
All impact, conservation and biodiversity assessments conducted at broad scales will benefit from the availability of continuous or remotely sensed environmental data and biological data collected at a similar scale. Driver-Pressure-State measures derived from the same databases should ensure that test-site assessments more reliably and accurately reflect human agents of change. Further, a move from spot measurements of water physical–chemical variables in particular, to continuous or remotely sensed measures or surrogates, combined with discharge or water-availability data, will invariably lead to new or improved empirical water-quality models. Accuracy and flexibility in water-quality objective setting, when this process is based upon characteristics of the reference condition (e.g. ANZECC/ARMCANZ 2000), are markedly improved when water-quality variables vary naturally and in predictable ways to discharge.
Early detection capabilities are also enhanced with new technologies and data collected at the broad-scale. This can also potentially overcome problems of accessing remote areas. For example, improved stressor-response relationships from above (empirical or conceptual models) may be combined with remotely sensed or telemetered water quality etc. data to identify emerging stressor hot-spots that require more detailed study. Similarly, using molecular data, new biological invasions posing ongoing threats to ecosystems can be identified at an early stage, before significant spread and before control becomes expensive or impossible.
Finer-scale intervention monitoring
Many of the improvements in approach offered by ecogenomics and earth observation and other remote-data-acquisition technologies identified above, including those for broad-scale assessments, equally apply at the finer-scale. For biological-response measures where species-level data for many taxonomic groups become available, there remain challenges in acquiring relative abundance information from new molecular-sequencing technologies. Overcoming such challenges may provide additional information to further improve impact detection, and better inform management decisions.
Fine-scale intervention monitoring may be better placed for the application of technologies and approaches, which are currently prohibitively expensive to consider at the broad-scale. Testing of the methods, including deployment, testing, calibration and modelling, may lead to new or improved conceptual and empirical models, which may be scaled-up for broader-scale consideration and assessment. These techniques may include continuous measurements from sondes, passive samplers and on-line monitoring of a variety of physical (DO, salinity) and chemical stressors. New unmanned aerial vehicle (UAV), drone, transmitter and camera technologies (e.g. Turner 2014) might also be better tested at such finer scales. These methods provide greater resolution in some key variables including habitat characterisation and may be powerful tools in monitoring the success of local restoration efforts. Early detection capability is also enhanced at this spatial scale. For example, with improved stressor-response relationships using new technologies and data sources, combined with telemetry, it is possible to determine when water-quality limits etc. are reached in compliance and licence settings.
Conclusion
Biological monitoring and assessment have traditionally implemented local-scale site collections to accumulate data and information about pressures on the natural environment and relate these to potential stressors. In the past, sampling efforts to measure physical, chemical and ecological change in the environment have been constrained by costs. The increasing deployment of satellites and collection of large-scale geospatial data are now allowing us to comprehensively consider a wider range of drivers of biogeographical patterns (e.g. geology and climate). Furthermore, biological data-streams have traditionally been poor, but the advent of high-throughput genomic-sequencing techniques now allow us to collect biological datasets on a similar or greater scale to physical and chemical monitoring.
Many important gaps and research areas still remain to be explored by big data techniques. Remote sensing and molecular tools provide large datasets of chemical, physical and now biological measures for improved model calibration and prediction. In future, they will also need to provide spatially and temporally explicit information about functions and processes, which thus far have been difficult to quantify over large spatial and temporal scales, but are crucial building blocks in risk-assessment models. Furthermore, environmental and ecological changes increasingly need to be considered in the context of global climate change. Hence, we require more extensive datasets to describe long-term trends in ecological condition, so that we can differentiate human impacts under shifting baselines. We also highlight that although proxies for pesticide and contaminant inputs (e.g. land use and industry types) can provide useful information for risk assessments, this can be improved with more direct measurements and call for increased use and development of tools such as passive samplers, traits-based analysis and metabarcoding. These direct measurements should be coupled with experimental studies of interacting stressors to provide evidence for causal interactions.
Big-data tools will continue to evolve, to address these research needs, and strategies to tackle challenges associated with big-data sources are at the cutting edge of research. Thus, the unique opportunities provided by emerging molecular tools and remote-sensing technologies seem likely to revolutionise biological monitoring and assessment in the future.
Acknowledgements
The authors thank the CSIRO’s Oceans and Atmosphere Flagship, Sydney Institute of Marine Science and the New South Wales Office of Environment and Heritage for their financial support of the workshop ‘New diagnostics for multiply stressed marine and freshwater systems: integrating models, ecoinformatics and Big Data’. D. J. Baird acknowledges support from the Natural Sciences and Engineering Research Council of Canada's Discovery Grant program. This paper represents SIMS Publication Number 168.
References
Adam, E., Mutanga, O., and Rugege, D. (2010). Multispectral and hyperspectral remote sensing for identification and mapping of wetland vegetation: a review. Wetlands Ecology and Management 18, 281–296.| Multispectral and hyperspectral remote sensing for identification and mapping of wetland vegetation: a review.Crossref | GoogleScholarGoogle Scholar |
Allan, J. D., McIntyre, P. B., Smith, S. D. P., Halpern, B. S., Boyer, G. L., Buchsbaum, A., Burton, G. A., Campbell, L. M., Chadderton, W. L., and Ciborowski, J. J. H. (2013). Joint analysis of stressors and ecosystem services to enhance restoration effectiveness. Proceedings of the National Academy of Sciences of the United States of America 110, 372–377.
| Joint analysis of stressors and ecosystem services to enhance restoration effectiveness.Crossref | GoogleScholarGoogle Scholar | 1:CAS:528:DC%2BC3sXnsFeisQ%3D%3D&md5=29ea6e8665f955e550d2da2fa5bdfab4CAS | 23248308PubMed |
ANZECC/ARMCANZ (2000). Australian and New Zealand Guidelines for Freshwater and Marine Water Quality. (Australian and New Zealand Environment and Conservation Council and Agriculture and Resource Management of Australia and New Zealand: Canberra, ACT.)
Armanini, D. G., Monk, W. A., Carter, L., Cote, D., and Baird, D. J. (2013). Towards generalised reference condition models for environmental assessment: a case study on rivers in Atlantic Canada. Environmental Monitoring and Assessment 185, 6247–6259.
| Towards generalised reference condition models for environmental assessment: a case study on rivers in Atlantic Canada.Crossref | GoogleScholarGoogle Scholar | 1:STN:280:DC%2BC3s3jtVCiuw%3D%3D&md5=cc05ca8eec7e13597df298dedd677aceCAS | 23250724PubMed |
Ayre, K. K., and Landis, W. G. (2012). A Bayesian approach to landscape ecological risk assessment applied to the Upper Grande Ronde Watershed, Oregon. Human and Ecological Risk Assessment: An International Journal 18, 946–970.
| A Bayesian approach to landscape ecological risk assessment applied to the Upper Grande Ronde Watershed, Oregon.Crossref | GoogleScholarGoogle Scholar | 1:CAS:528:DC%2BC38XhsVemtrvJ&md5=c9de0d9fdad2bd2029554c86033439e7CAS |
Baird, D. J., and Hajibabaei, M. (2012). Biomonitoring 2.0: a new paradigm in ecosystem assessment made possible by next-generation DNA sequencing. Molecular Ecology 21, 2039–2044.
| Biomonitoring 2.0: a new paradigm in ecosystem assessment made possible by next-generation DNA sequencing.Crossref | GoogleScholarGoogle Scholar | 22590728PubMed |
Baird, D. J., Van den Brink, P. J., Chariton, A. A., Dafforn, K. A., and Johnston, E. L. (2016). New diagnostics for multiply stressed marine and freshwater ecosystems: integrating models, ecoinformatics and big data. Marine and Freshwater Research 67, 391–392.
| New diagnostics for multiply stressed marine and freshwater ecosystems: integrating models, ecoinformatics and big data.Crossref | GoogleScholarGoogle Scholar |
Baldwin, D. S., Colloff, M. J., Rees, G. N., Chariton, A. A., Watson, G. O., Court, L. N., Hartley, D. M., King, A. J., Wilson, J. S., and Hodda, M. (2013). Impacts of inundation and drought on eukaryote biodiversity in semi‐arid floodplain soils. Molecular Ecology 22, 1746–1758.
| Impacts of inundation and drought on eukaryote biodiversity in semi‐arid floodplain soils.Crossref | GoogleScholarGoogle Scholar | 23379967PubMed |
Ban, N. C., Alidina, H. M., and Ardron, J. A. (2010). Cumulative impact mapping: advances, relevance and limitations to marine management and conservation, using Canada’s Pacific waters as a case study. Marine Policy 34, 876–886.
| Cumulative impact mapping: advances, relevance and limitations to marine management and conservation, using Canada’s Pacific waters as a case study.Crossref | GoogleScholarGoogle Scholar |
Bayliss, P., van Dam, R. A., and Bartolo, R. E. (2012). Quantitative ecological risk assessment of the Magela Creek Floodplain in Kakadu National Park, Australia: comparing point source risks from the Ranger Uranium Mine to diffuse landscape-scale risks. Human and Ecological Risk Assessment: An International Journal 18, 115–151.
| Quantitative ecological risk assessment of the Magela Creek Floodplain in Kakadu National Park, Australia: comparing point source risks from the Ranger Uranium Mine to diffuse landscape-scale risks.Crossref | GoogleScholarGoogle Scholar | 1:CAS:528:DC%2BC38XovFGmtw%3D%3D&md5=c0de34619d74bb7861188e4e5e8d52e7CAS |
Benjamini, Y., and Hochberg, Y. (1995). Controlling the false discovery rate: a practical and powerful approach to multiple testing. Journal of the Royal Statistical Society – B. Methodological 57, 289–300.
Borja, A., Bricker, S. B., Dauer, D. M., Demetriades, N. T., Ferreira, J. G., Forbes, A. T., Hutchings, P., Jia, X., Kenchington, R., Marques, J. C., and Zhu, C. (2008). Overview of integrative tools and methods in assessing ecological integrity in estuarine and coastal systems worldwide. Marine Pollution Bulletin 56, 1519–1537.
| Overview of integrative tools and methods in assessing ecological integrity in estuarine and coastal systems worldwide.Crossref | GoogleScholarGoogle Scholar | 1:CAS:528:DC%2BD1cXhtVGltbnM&md5=78759fa62e7c3012b321fc6f4fbd84feCAS | 18715596PubMed |
Borja, A., Bald, J., Franco, J., Larreta, J., Muxika, I., Revilla, M., Rodríguez, J. G., Solaun, O., Uriarte, A., and Valencia, V. (2009). Using multiple ecosystem components, in assessing ecological status in Spanish (Basque Country) Atlantic marine waters. Marine Pollution Bulletin 59, 54–64.
| Using multiple ecosystem components, in assessing ecological status in Spanish (Basque Country) Atlantic marine waters.Crossref | GoogleScholarGoogle Scholar | 1:CAS:528:DC%2BD1MXitFSgs7Y%3D&md5=2a1b5acfdae19194994994c39993bfdfCAS | 19084879PubMed |
Bowler, D. E., and Benton, T. G. (2005). Causes and consequences of animal dispersal strategies: relating individual behaviour to spatial dynamics. Biological Reviews of the Cambridge Philosophical Society 80, 205–225.
| Causes and consequences of animal dispersal strategies: relating individual behaviour to spatial dynamics.Crossref | GoogleScholarGoogle Scholar | 15921049PubMed |
Burton, G. A., and Johnston, E. L. (2010). Assessing contaminated sediments in the context of multiple stressors. Environmental Toxicology and Chemistry 29, 2625–2643.
| Assessing contaminated sediments in the context of multiple stressors.Crossref | GoogleScholarGoogle Scholar | 1:CAS:528:DC%2BC3cXhsFags77O&md5=6cfb810e227a6cf7e4efcd8707804949CAS | 20931605PubMed |
Buyck, B. (1999). Taxonomists are an endangered species in Europe. Nature 401, 321.
| Taxonomists are an endangered species in Europe.Crossref | GoogleScholarGoogle Scholar | 1:CAS:528:DyaK1MXmsFamtb0%3D&md5=76da16a3a36bc62ff99f8d3c5790fd8aCAS | 16862089PubMed |
Carew, M. E., Pettigrove, V. J., Metzeling, L., and Hoffmann, A. A. (2013). Environmental monitoring using next generation sequencing: rapid identification of macroinvertebrate bioindicator species. Frontiers in Zoology 10, 45.
| Environmental monitoring using next generation sequencing: rapid identification of macroinvertebrate bioindicator species.Crossref | GoogleScholarGoogle Scholar | 23919569PubMed |
Chariton, A. A., Court, L. N., Hartley, D. M., Colloff, M. J., and Hardy, C. M. (2010). Ecological assessment of estuarine sediments by pyrosequencing eukaryotic ribosomal DNA. Frontiers in Ecology and the Environment 8, 233–238.
| Ecological assessment of estuarine sediments by pyrosequencing eukaryotic ribosomal DNA.Crossref | GoogleScholarGoogle Scholar |
Chariton, A. A., Ho, K. T., Proestou, D., Bik, H., Simpson, S. L., Portis, L. M., Cantwell, M. G., Baguley, J. G., Burgess, R. M., Pelletier, M. M., Perron, M., Gunsch, C., and Matthews, R. A. (2014). A molecular-based approach for examining responses of eukaryotes in microcosms to contaminant-spiked estuarine sediments. Environmental Toxicology and Chemistry 33, 359–369.
| A molecular-based approach for examining responses of eukaryotes in microcosms to contaminant-spiked estuarine sediments.Crossref | GoogleScholarGoogle Scholar | 1:CAS:528:DC%2BC2cXmt1Khuw%3D%3D&md5=22b7537048c294fa5e8bbd9234f08923CAS | 24399368PubMed |
Chariton, A., Sun, M. Y., Gibson, J., Webb, J. A., Leung, K. M. Y., Hickey, C. W., and Hose, G. C. (2016). Emergent technologies and analytical approaches for understanding the effects of multiple stressors in aquatic environments. Marine and Freshwater Research 67, 414–428.
| Emergent technologies and analytical approaches for understanding the effects of multiple stressors in aquatic environments.Crossref | GoogleScholarGoogle Scholar |
Clarke, R. T., Wright, J. F., and Furse, M. T. (2003). RIVPACS models for predicting the expected macroinvertebrate fauna and assessing the ecological quality of rivers. Ecological Modelling 160, 219–233.
| RIVPACS models for predicting the expected macroinvertebrate fauna and assessing the ecological quality of rivers.Crossref | GoogleScholarGoogle Scholar |
Creer, S., Fonseca, V. G., Porazinska, D. L., Giblin‐Davis, R. M., Sung, W., Power, D. M., Packer, M., Carvalho, G. R., Blaxter, M. L., and Lambshead, P. J. D. (2010). Ultrasequencing of the meiofaunal biosphere: practice, pitfalls and promises. Molecular Ecology 19, 4–20.
| Ultrasequencing of the meiofaunal biosphere: practice, pitfalls and promises.Crossref | GoogleScholarGoogle Scholar | 20331766PubMed |
Dafforn, K. A., Simpson, S. L., Kelaher, B. P., Clark, G. F., Komyakova, V., Wong, C. K. C., and Johnston, E. L. (2012). The challenge of choosing environmental indicators of anthropogenic impacts in estuaries. Environmental Pollution 163, 207–217.
| The challenge of choosing environmental indicators of anthropogenic impacts in estuaries.Crossref | GoogleScholarGoogle Scholar | 1:CAS:528:DC%2BC38XitFKqsbg%3D&md5=d51701bd1c2d286e80b62cf3923ed6faCAS | 22265759PubMed |
Dafforn, K. A., Baird, D., Chariton, A., Sun, M., Brown, M., Simpson, S., Kelaher, B., and Johnston, E. (2014). Chapter one – faster, higher and stronger? The pros and cons of molecular faunal data for assessing ecosystem condition. Advances in Ecological Research 51, 1–40.
| Chapter one – faster, higher and stronger? The pros and cons of molecular faunal data for assessing ecosystem condition.Crossref | GoogleScholarGoogle Scholar |
Davy-Bowker, J., Clarke, R., Johnson, R., Kokes, J., Murphy, J., and Zahrádková, S. (2006). A comparison of the European Water Framework Directive physical typology and RIVPACS-type models as alternative methods of establishing reference conditions for benthic macroinvertebrates. In ‘The Ecological Status of European Rivers: Evaluation and Intercalibration of Assessment Methods’. (Eds M. Furse, D. Hering, K. Brabec, A. Buffagni, L. Sandin, and P. M. Verdonschot.) pp. 91–105. (Springer: Dordrecht, Netherlands.)
Déry, S. J., Salomonson, V. V., Stieglitz, M., Hall, D. K., and Appel, I. (2005). An approach to using snow areal depletion curves inferred from MODIS and its application to land surface modelling in Alaska. Hydrological Processes 19, 2755–2774.
| An approach to using snow areal depletion curves inferred from MODIS and its application to land surface modelling in Alaska.Crossref | GoogleScholarGoogle Scholar |
Dong, Z., Lewis, C. G., Burgess, R. M., and Shine, J. P. (2015). The Gellyfish: An in‐situ equilibrium‐based sampler for determining multiple free metal ion concentrations in marine ecosystems. Environmental Toxicology and Chemistry 34, 983–992.
| The Gellyfish: An in‐situ equilibrium‐based sampler for determining multiple free metal ion concentrations in marine ecosystems.Crossref | GoogleScholarGoogle Scholar | 1:CAS:528:DC%2BC2MXmt1Snsrs%3D&md5=dcf1e795e7ad46f88f07641af72b8f0eCAS | 25598362PubMed |
Frazier, P., Ryder, D., McIntyre, E., and Stewart, M. (2012). Understanding riverine habitat inundation patterns: remote sensing tools and techniques. Wetlands 32, 225–237.
| Understanding riverine habitat inundation patterns: remote sensing tools and techniques.Crossref | GoogleScholarGoogle Scholar |
Fujioka, E., Soldevilla, M. S., Read, A. J., and Halpin, P. N. (2014). Integration of passive acoustic monitoring data into OBIS-SEAMAP, a global biogeographic database, to advance spatially explicit ecological assessments. Ecological Informatics 21, 59–73.
| Integration of passive acoustic monitoring data into OBIS-SEAMAP, a global biogeographic database, to advance spatially explicit ecological assessments.Crossref | GoogleScholarGoogle Scholar |
Glibert, P. M., Fullerton, D., Burkholder, J. M., Cornwell, J. C., and Kana, T. M. (2011). Ecological stoichiometry, biogeochemical cycling, invasive species, and aquatic food webs: San Francisco Estuary and comparative systems. Reviews in Fisheries Science 19, 358–417.
| Ecological stoichiometry, biogeochemical cycling, invasive species, and aquatic food webs: San Francisco Estuary and comparative systems.Crossref | GoogleScholarGoogle Scholar |
Haase, P., Pauls, S. U., Schindehütte, K., and Sundermann, A. (2010). First audit of macroinvertebrate samples from an EU Water Framework Directive monitoring program: human error greatly lowers precision of assessment results. Journal of the North American Benthological Society 29, 1279–1291.
| First audit of macroinvertebrate samples from an EU Water Framework Directive monitoring program: human error greatly lowers precision of assessment results.Crossref | GoogleScholarGoogle Scholar |
Hajibabaei, M. (2007). The barcode of life initiative. Journal of Phycology 43, 20.
Hajibabaei, M., Shokralla, S., Zhou, X., Singer, G. A. C., and Baird, D. J. (2011). Environmental barcoding: a next-generation sequencing approach for biomonitoring applications using river benthos. PLoS One 6, e17497.
| Environmental barcoding: a next-generation sequencing approach for biomonitoring applications using river benthos.Crossref | GoogleScholarGoogle Scholar | 1:CAS:528:DC%2BC3MXltV2rt7c%3D&md5=23f6dee6ab0a1f1b54a9bd753f7f003eCAS | 21533287PubMed |
Halpern, B. S., and Fujita, R. (2013). Assumptions, challenges, and future directions in cumulative impact analysis. Ecosphere 4, art131.
| Assumptions, challenges, and future directions in cumulative impact analysis.Crossref | GoogleScholarGoogle Scholar |
Halpern, B. S., Walbridge, S., Selkoe, K. A., Kappel, C. V., Micheli, F., D’Agrosa, C., Bruno, J. F., Casey, K. S., Ebert, C., Fox, H. E., Fujita, R., Heinemann, D., Lenihan, H. S., Madin, E. M. P., Perry, M. T., Selig, E. R., Spalding, M., Steneck, R., and Watson, R. (2008). A global map of human impact on marine ecosystems. Science 319, 948–952.
| A global map of human impact on marine ecosystems.Crossref | GoogleScholarGoogle Scholar | 1:CAS:528:DC%2BD1cXhslOmtrk%3D&md5=4050180e6a0e685d994865e9b996f44eCAS | 18276889PubMed |
Hampton, S. E., Strasser, C. A., Tewksbury, J. J., Gram, W. K., Budden, A. E., Batcheller, A. L., Duke, C. S., and Porter, J. H. (2013). Big data and the future of ecology. Frontiers in Ecology and the Environment 11, 156–162.
| Big data and the future of ecology.Crossref | GoogleScholarGoogle Scholar |
Harding, L. W. (1994). Long-term trends in the distribution of phytoplankton in Chesapeake Bay: roles of light, nutrients and streamflow. Marine Ecology Progress Series 104, 267–291.
| Long-term trends in the distribution of phytoplankton in Chesapeake Bay: roles of light, nutrients and streamflow.Crossref | GoogleScholarGoogle Scholar |
Hargett, E. G., ZumBerge, J. R., Hawkins, C. P., and Olson, J. R. (2007). Development of a RIVPACS-type predictive model for bioassessment of wadeable streams in Wyoming. Ecological Indicators 7, 807–826.
| Development of a RIVPACS-type predictive model for bioassessment of wadeable streams in Wyoming.Crossref | GoogleScholarGoogle Scholar |
Harris, G. P., and Heathwaite, A. L. (2012). Why is achieving good ecological outcomes in rivers so difficult? Freshwater Biology 57, 91–107.
| Why is achieving good ecological outcomes in rivers so difficult?Crossref | GoogleScholarGoogle Scholar |
Hawkins, C. P., Olson, J. R., and Hill, R. A. (2010). The reference condition: predicting benchmarks for ecological and water-quality assessments. Journal of the North American Benthological Society 29, 312–343.
| The reference condition: predicting benchmarks for ecological and water-quality assessments.Crossref | GoogleScholarGoogle Scholar |
Hilty, J., and Merenlender, A. (2000). Faunal indicator taxa selection for monitoring ecosystem health. Biological Conservation 92, 185–197.
| Faunal indicator taxa selection for monitoring ecosystem health.Crossref | GoogleScholarGoogle Scholar |
Humphrey, C., Storey, A., and Thurtell, L. (2000). AUSRIVAS: operator sample processing errors and temporal variability – implications for model sensitivity. In ‘Proceedings of an International Workshop held in Oxford, UK on 16th September 1997’. (Eds J. F. Wright, D. W. Sutcliffe, and M. T. Furse.) Record number: 0900386622, pp. 143–163. (Freshwater Biological Association: Ambleside, UK.)
Johnston, C. A., Ghioca, D. M., Tulbure, M., Bedford, B. L., Bourdaghs, M., Frieswyk, C. B., Vaccaro, L., and Zedler, J. B. (2008). Partitioning vegetation response to anthropogenic stress to develop multi-taxa wetland indicators. Ecological Applications 18, 983–1001.
| Partitioning vegetation response to anthropogenic stress to develop multi-taxa wetland indicators.Crossref | GoogleScholarGoogle Scholar | 18536257PubMed |
Johnston, C. A., Zedler, J. B., Tulbure, M. G., Frieswyk, C. B., Bedford, B. L., and Vaccaro, L. (2009). A unifying approach for evaluating the condition of wetland plant communities and identifying related stressors. Ecological Applications 19, 1739–1757.
| A unifying approach for evaluating the condition of wetland plant communities and identifying related stressors.Crossref | GoogleScholarGoogle Scholar | 19831067PubMed |
Jones, F. C. (2008). Taxonomic sufficiency: The influence of taxonomic resolution on freshwater bioassessments using benthic macroinvertebrates. Environmental Reviews 16, 45–69.
| Taxonomic sufficiency: The influence of taxonomic resolution on freshwater bioassessments using benthic macroinvertebrates.Crossref | GoogleScholarGoogle Scholar |
Kingsford, R., Curtin, A., and Porter, J. (1999). Water flows on Cooper Creek in arid Australia determine ‘boom’ and ‘bust’ periods for waterbirds. Biological Conservation 88, 231–248.
| Water flows on Cooper Creek in arid Australia determine ‘boom’ and ‘bust’ periods for waterbirds.Crossref | GoogleScholarGoogle Scholar |
Lake, P. S. (2000). Disturbance, patchiness, and diversity in streams. Journal of the North American Benthological Society 19, 573–592.
| Disturbance, patchiness, and diversity in streams.Crossref | GoogleScholarGoogle Scholar |
LaRue, M. A., Lynch, H. J., Lyver, P. O. B., Barton, K., Ainley, D. G., Pollard, A., Fraser, W. R., and Ballard, G. (2014). A method for estimating colony sizes of Adélie penguins using remote sensing imagery. Polar Biology 37, 507–517.
| A method for estimating colony sizes of Adélie penguins using remote sensing imagery.Crossref | GoogleScholarGoogle Scholar |
Leigh, C., Sheldon, F., Kingsford, R. T., and Arthington, A. H. (2010). Sequential floods drive ‘booms’ and wetland persistence in dryland rivers: a synthesis. Marine and Freshwater Research 61, 896–908.
| Sequential floods drive ‘booms’ and wetland persistence in dryland rivers: a synthesis.Crossref | GoogleScholarGoogle Scholar | 1:CAS:528:DC%2BC3cXhtVansL%2FP&md5=8641aeb9b49c1b4c39dc8ebf1992fe06CAS |
McKinley, A. C., Miskiewicz, A., Taylor, M. D., and Johnston, E. L. (2011). Strong links between metal contamination, habitat modification and estuarine larval fish distributions. Environmental Pollution 159, 1499–1509.
| Strong links between metal contamination, habitat modification and estuarine larval fish distributions.Crossref | GoogleScholarGoogle Scholar | 1:CAS:528:DC%2BC3MXltFOqsbs%3D&md5=b8f9e299f2379ed47b7f925869c24016CAS | 21470729PubMed |
McQueen, D. J., Post, J. R., and Mills, E. L. (1986). Trophic relationships in freshwater pelagic ecosystems. Canadian Journal of Fisheries and Aquatic Sciences 43, 1571–1581.
| Trophic relationships in freshwater pelagic ecosystems.Crossref | GoogleScholarGoogle Scholar |
Metzeling, L., Robinson, D., Perriss, S., and Marchant, R. (2002). Temporal persistence of benthic invertebrate communities in south-eastern Australian streams: taxonomic resolution and implications for the use of predictive models. Marine and Freshwater Research 53, 1223–1234.
| Temporal persistence of benthic invertebrate communities in south-eastern Australian streams: taxonomic resolution and implications for the use of predictive models.Crossref | GoogleScholarGoogle Scholar |
Morgan, M. J., Chariton, A. A., Hartley, D. M., Court, L. N., and Hardy, C. M. (2013). Improved inference of taxonomic richness from environmental DNA. PLoS One 8, e71974.
| Improved inference of taxonomic richness from environmental DNA.Crossref | GoogleScholarGoogle Scholar | 1:CAS:528:DC%2BC3sXhsVSnur%2FP&md5=380a8eade77e4d9fed7e36bcac9100e8CAS | 23991013PubMed |
Nichols, S. J., Robinson, W. A., and Norris, R. H. (2010). Using the reference condition maintains the integrity of a bioassessment program in a changing climate. Journal of the North American Benthological Society 29, 1459–1471.
| Using the reference condition maintains the integrity of a bioassessment program in a changing climate.Crossref | GoogleScholarGoogle Scholar |
Norris, R. H., and Thoms, M. C. (1999). What is river health? Freshwater Biology 41, 197–209.
| What is river health?Crossref | GoogleScholarGoogle Scholar |
Norris, R. H., Webb, J. A., Nichols, S. J., Stewardson, M. J., and Harrison, E. T. (2012). Analyzing cause and effect in environmental assessments: using weighted evidence from the literature. Freshwater Science 31, 5–21.
| Analyzing cause and effect in environmental assessments: using weighted evidence from the literature.Crossref | GoogleScholarGoogle Scholar |
Ostermiller, J. D., and Hawkins, C. P. (2004). Effects of sampling error on bioassessments of stream ecosystems: application to RIVPACS-type models. Journal of the North American Benthological Society 23, 363–382.
| Effects of sampling error on bioassessments of stream ecosystems: application to RIVPACS-type models.Crossref | GoogleScholarGoogle Scholar |
Pettorelli, N., Safi, K., and Turner, W. (2014). Satellite remote sensing, biodiversity research and conservation of the future. Philosophical Transactions of the Royal Society of London. Series B, Biological Sciences 369, 20130190.
| Satellite remote sensing, biodiversity research and conservation of the future.Crossref | GoogleScholarGoogle Scholar | 24733945PubMed |
Pilgrim, E. M., Jackson, S. A., Swenson, S., Turcsanyi, I., Friedman, E., Weigt, L., and Bagley, M. J. (2011). Incorporation of DNA barcoding into a large-scale biomonitoring program: opportunities and pitfalls. Journal of the North American Benthological Society 30, 217–231.
| Incorporation of DNA barcoding into a large-scale biomonitoring program: opportunities and pitfalls.Crossref | GoogleScholarGoogle Scholar |
Pollino, C. A., Woodberry, O., Nicholson, A., Korb, K., and Hart, B. T. (2007). Parameterisation and evaluation of a Bayesian network for use in an ecological risk assessment. Environmental Modelling & Software 22, 1140–1152.
| Parameterisation and evaluation of a Bayesian network for use in an ecological risk assessment.Crossref | GoogleScholarGoogle Scholar |
Prinsenberg, S. J. (1980). Man-made changes in the freshwater input rates of Hudson and James Bays. Canadian Journal of Fisheries and Aquatic Sciences 37, 1101–1110.
| Man-made changes in the freshwater input rates of Hudson and James Bays.Crossref | GoogleScholarGoogle Scholar |
Reynoldson, T. B., and Wright, J. F. (2000). The reference condition: problems and solutions. In ‘Assessing the Biological Quality of Freshwaters. RIVPACS and Other Techniques’. (Eds J. F. Wright, D. W. Sutcliffe, and M. T. Furse.) pp. 293–304 (Freshwater Biological Association Scientific Publication: Ambleside, UK.)
Reynoldson, T., Day, K., and Pascoe, T. (2000). The development of the BEAST: a predictive approach for assessing sediment quality in the North American Great Lakes. In ‘Assessing the Biological Quality of Freshwaters. RIVPACS and Other Techniques’. (Eds J. F. Wright, D. W. Sutcliffe, and M. T. Furse.) Reference number 0900386622, pp. 165–194. (Freshwater Biological Association: Ambleside, UK.)
Schäfer, R. B., Kefford, B. J., Metzeling, L., Liess, M., Burgert, S., Marchant, R., Pettigrove, V., Goonan, P., and Nugegoda, D. (2011). A trait database of stream invertebrates for the ecological risk assessment of single and combined effects of salinity and pesticides in South-East Australia. The Science of the Total Environment 409, 2055–2063.
| A trait database of stream invertebrates for the ecological risk assessment of single and combined effects of salinity and pesticides in South-East Australia.Crossref | GoogleScholarGoogle Scholar | 21376369PubMed |
Shokralla, S., Spall, J. L., Gibson, J. F., and Hajibabaei, M. (2012). Next-generation sequencing technologies for environmental DNA research. Molecular Ecology 21, 1794–1805.
| Next-generation sequencing technologies for environmental DNA research.Crossref | GoogleScholarGoogle Scholar | 1:CAS:528:DC%2BC38XptVGksLo%3D&md5=baafc2c513911163895885c2ac23ddddCAS | 22486820PubMed |
Simpson, J., and Norris, R. (2000). Biological assessment of river quality: development of AUSRIVAS models and outputs. In ‘Assessing the Biological Quality of Freshwaters. RIVPACS and Other Techniques’. (Eds J. F. Wright, D. W. Sutcliffe, and M. T. Furse.) Reference number 0900386622, pp. 125–142. (Freshwater Biological Association: Ambleside, UK.)
Simpson, S. L., Batley, G. E., Chariton, A. A., Stauber, J. L., King, C. K., Chapman, J. C., Hyne, R. V., Gale, S. A., Roach, A. C., and Maher, W. A. (2005). Handbook for Sediment Quality Assessment. (CSIRO: Sydney, NSW.)
Sun, M. Y., Dafforn, K. A., Brown, M. V., and Johnston, E. L. (2012). Bacterial communities are sensitive indicators of contaminant stress. Marine Pollution Bulletin 64, 1029–1038.
| Bacterial communities are sensitive indicators of contaminant stress.Crossref | GoogleScholarGoogle Scholar | 1:CAS:528:DC%2BC38Xmt1WmtL0%3D&md5=74869dbf8ad26ad53448c8dd5e66947cCAS | 22385752PubMed |
Sun, M. Y., Dafforn, K. A., Johnston, E. L., and Brown, M. V. (2013). Core sediment bacteria drive community response to anthropogenic contamination over multiple environmental gradients. Environmental Microbiology 15, 2517–2531.
| Core sediment bacteria drive community response to anthropogenic contamination over multiple environmental gradients.Crossref | GoogleScholarGoogle Scholar | 23647974PubMed |
Taberlet, P., Coissac, E., Pompanon, F., Brochmann, C., and Willerslev, E. (2012). Towards next-generation biodiversity assessment using DNA metabarcoding. Molecular Ecology 21, 2045–2050.
| Towards next-generation biodiversity assessment using DNA metabarcoding.Crossref | GoogleScholarGoogle Scholar | 1:CAS:528:DC%2BC38XptVGkt7w%3D&md5=46d4a28454d581f0e912206047b97d8bCAS | 22486824PubMed |
Tolonen, K. T., Hamalainen, H., Lensu, A., Merilainen, J. J., Palomaki, A., and Karjalainen, J. (2014). The relevance of ecological status to ecosystem functions and services in a large boreal lake. Journal of Applied Ecology 51, 560–571.
| The relevance of ecological status to ecosystem functions and services in a large boreal lake.Crossref | GoogleScholarGoogle Scholar |
Tulbure, M. G., and Broich, M. (2013). Spatiotemporal dynamic of surface water bodies using Landsat time-series data from 1999 to 2011. ISPRS Journal of Photogrammetry and Remote Sensing 79, 44–52.
| Spatiotemporal dynamic of surface water bodies using Landsat time-series data from 1999 to 2011.Crossref | GoogleScholarGoogle Scholar |
Turak, E., Flack, L. K., Norris, R. H., Simpson, J., and Waddell, N. (1999). Assessment of river condition at a large spatial scale using predictive models. Freshwater Biology 41, 283–298.
| Assessment of river condition at a large spatial scale using predictive models.Crossref | GoogleScholarGoogle Scholar |
Turner, W. (2014). Sensing biodiversity. Science 346, 301–302.
| Sensing biodiversity.Crossref | GoogleScholarGoogle Scholar | 1:CAS:528:DC%2BC2cXhvFSjtbrI&md5=721f5e3d8568e4b520a128a52fbed6c2CAS | 25324372PubMed |
Van den Brink, P. J., Choung, C. B., Landis, W. G., Mayer-Pinto, M., Pettigrove, V., Scanes, P., Smith, R., and Stauber, J. L. (2016). New approaches to the ecological risk assessment of multiple stressors. Marine and Freshwater Research 67, 429–439.
| New approaches to the ecological risk assessment of multiple stressors.Crossref | GoogleScholarGoogle Scholar |
Vörösmarty, C. J., McIntyre, P. B., Gessner, M. O., Dudgeon, D., Prusevich, A., Green, P., Glidden, S., Bunn, S. E., Sullivan, C. A., and Liermann, C. R. (2010). Global threats to human water security and river biodiversity. Nature 467, 555–561.
| Global threats to human water security and river biodiversity.Crossref | GoogleScholarGoogle Scholar | 20882010PubMed |
Vrana, B., Allan, I. J., Greenwood, R., Mills, G. A., Dominiak, E., Svensson, K., Knutsson, J., and Morrison, G. (2005). Passive sampling techniques for monitoring pollutants in water. TrAC Trends in Analytical Chemistry 24, 845–868.
| Passive sampling techniques for monitoring pollutants in water.Crossref | GoogleScholarGoogle Scholar | 1:CAS:528:DC%2BD2MXht1CqtLnO&md5=d391ac88abdedcd945548083f7c8ec53CAS |
Waite, T. A., and Campbell, L. G. (2006). Controlling the false discovery rate and increasing statistical power in ecological studies. Ecoscience 13, 439–442.
| Controlling the false discovery rate and increasing statistical power in ecological studies.Crossref | GoogleScholarGoogle Scholar |
Wiegers, J. K., Feder, H. M., Mortensen, L. S., Shaw, D. G., Wilson, V. J., and Landis, W. G. (1998). A Regional Multiple-Stressor Rank-Based Ecological Risk Assessment for the Fjord of Port Valdez, Alaska. Human and Ecological Risk Assessment: An International Journal 4, 1125–1173.
| A Regional Multiple-Stressor Rank-Based Ecological Risk Assessment for the Fjord of Port Valdez, Alaska.Crossref | GoogleScholarGoogle Scholar |
Wright, J., Sutcliffe, D. F., and Furse, M. T. (2000). Assessing the Biological Quality of Fresh Waters: RIVPACS and Other Techniques. (Freshwater Biological Association: Ambleside, UK.)
Yates, A. G., and Bailey, R. C. (2010). Selecting objectively defined reference sites for stream bioassessment programs. Environmental Monitoring and Assessment 170, 129–140.
| Selecting objectively defined reference sites for stream bioassessment programs.Crossref | GoogleScholarGoogle Scholar | 19902368PubMed |