

The East Australian Current, upwellings and downwellings off eastern-most Australia in summer
G. R. Cresswell A D , J. L. Peterson B and L. F. Pender CA CSIRO Marine and Atmospheric Research, GPO Box 1538, Hobart, Tas. 7001, Australia.
B 3906 South Troost Avenue, Tulsa, OK 74105, USA.
C 65 Cades Drive, Kingston, Tas. 7050, Australia.
D Corresponding author. Email: george.cresswell@csiro.au
Marine and Freshwater Research 68(7) 1208-1223 https://doi.org/10.1071/MF16051
Submitted: 19 February 2016 Accepted: 13 October 2016 Published: 14 December 2016
Journal Compilation © CSIRO Publishing 2017 Open Access CC BY-NC-ND
Abstract
The complex influences of the East Australian Current (EAC) and winds on the waters of the continental shelf were addressed with a ship survey, moored and drifting instruments, satellite images and wind and sea level measurements. The study revealed intrusions of continental slope water reaching the inner continental shelf when the EAC was near the shelf edge and wind stress was near zero or upwelling favourable (northerly). The process was the onshore movement of a southward flowing stream of water originally from the continental slope. One event was captured near Cape Byron and Evans Head when these waters upwelled to the surface. When the wind stress turned northward, it reversed the inner shelf current and drove downwelling. Variations in the wind stress also modulated the strength of the EAC out across the shelf to the upper slope. The strength of the EAC per se varied with a time scale of 2–3 months; these variations decreased in amplitude westward until they were undetectable at the inner shelf. The EAC had a subsurface speed maximum of up to 1.6 m s–1 at 100–150-m depth above the continental slope and was seen to accelerate with both time and distance southward along the 190-km length surveyed by the ship.
Additional keywords: current meters, SeaSoar.
Introduction
The continental shelf of central eastern Australia (Fig. 1) is narrow, with an average width of ~25 km, and, at mid-shelf, it is 60–80 m deep. The East Australian Current (EAC) core runs southward above the continental slope, reaching speeds of up to 2 m s–1 between 28 and 33°S (Hamon et al. 1975). This means that it is more of an influence on the circulation of this shelf than the Gulf Stream is on the US eastern shelf, which is 70–120 km wide with a typical depth of 30 m.

|
Upwellings near Evans Head (29°08′S), 50 km south of Australia’s eastern-most point, Cape Byron, were discovered as a result of the ‘coastal hydrology station’ network set up by David Rochford around Australia in the 1950s. The stations were at the 60-m isobath and water samples and temperatures were taken at 10-m intervals to 50-m depth with Nansen bottles and reversing thermometers; fishing boats were chartered for the work. The Evans Head station was occupied more or less monthly from November 1952 to October 1959 (e.g. Crooks 1960) and revealed surface to bottom mixing on the shelf in winter, followed by the onset of stratification in early summer, during which there were sporadic intrusions of cold continental slope water (Rochford 1972). From July 1966 to July 1969, the coastal station was supplemented with three stations out across the continental shelf and slope to 2000-m isobaths and, in the final year of the program, a surface thermograph was used to map surface plumes of upwellings.
What is driving and what is happening within the cold intrusions and upwellings? Although the Evans Head upwelling per se has not been a focus of scrutiny since Rochford’s time, there are significant pointers to the processes from work done subsequently in nearby areas. The EAC off northern New South Wales (NSW) and southern Queensland has long been known to be strong and to spread across the shelf to drive upwelling through a bottom Ekman layer (Griffin and Middleton 1992) that can lead to phytoplankton blooms (Brieva et al. 2015). At Smoky Cape (31°S), Roughan and Middleton (2002) identified four causes for upwelling: (1) wind; (2) encroachment of the EAC onto the shelf; (3) acceleration of the current due to the narrowing of the shelf; and (4) the separation of the EAC from the coast. Wind-driven upwelling was observed less than 2 km from the coast at 28°20′S, some 75 km north of Evans Head (Oke et al. 2003).
With a mooring in May–June 2011 at the 70-m isobath at 30°S, 100 km south of Evans Head, Armbrecht et al. (2014) captured two events where the encroachment of the EAC onto the shelf led to the uplift of cold water. There was also a 2-day interval of downwelling-favourable wind that drove, after a delay of a day, a northward flow of 0.6 m s–1 and, after another day, resulted in the disappearance of the previous stratification. This was the first report of such a downwelling along the northern NSW coast.
From further observations at 30°S, Schaeffer et al. (2014) reported an onshore transport in a 10- to 20-m bottom boundary layer that varied strongly at periods of ~90–100 days and that this tied in with EAC fluctuations and eddy shedding rather than wind forcing. The onshore flow at 0.1 m s–1 resulted in nearshore upwelling. Later work with Slocum gliders emphasised the importance of EAC bottom stress in driving intrusions of continental slope water onto the shelf, particularly where the shelf is narrowest and the EAC is strongest (Schaeffer and Roughan 2015).
Rossi et al. (2014) were able to take a large spatial and temporal view of Australia’s eastern seaboard from 25 to 37.5°S for the years 2002–14 by using satellite measurements of sea surface height and temperature, calibrated with in situ observations. They calculated indices for current-driven upwelling and wind-driven upwelling and downwelling. Their results can be interpreted to show that current-driven upwelling at Evans Head occurred 4–7 days per month year round, with peaks in September, December and April. Wind-driven upwelling occurred on more than 4 days per month between August and December, whereas wind-driven downwelling occurred between September and January, but on less than 5 days per month. For the Evans Head vicinity, the work showed that current and wind-driven upwelling and wind-driven downwelling could all be expected during September–January (the period covered by the moorings in the present study).
Again near 30°S, Wood et al. (2016) used 3 years of moored in situ temperature and velocity observations and wind measurements to show that from spring through autumn the winds were usually either north-eastward or south-westward, favourable for downwelling and upwelling respectively. The wind-driven upwelling, combined with EAC encroachments driving continental slope water onto the shelf, resulted in cool bottom waters and strong stratification during summer. In winter, the winds were north-eastward (downwelling favourable) and, along with vertical mixing, resulted in a loss of stratification such that the bottom waters on the continental shelf were warmer than in summer.
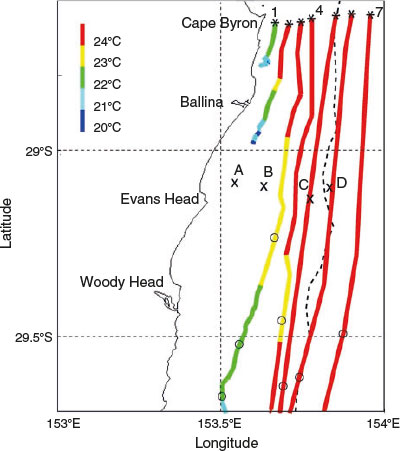
Herein we describe a wind-driven downwelling succeeded by an EAC-driven upwelling near Evans Head, 29°08′S, in November 1989. The main study area bracketed Evans Head and extended 75 km from Cape Byron (28°40′S) to Woody Point (29°20′S). Over the course of 6 days our research vessel occupied seven transects in this study area, from the continental slope in to as shallow as 30-m depth. In addition, the upstream region was examined with four transects up to 240 km north of Evans Head. Seven drifters were released off Cape Byron: all were carried southward by the EAC, with the innermost two responding to the upwelling and being carried at a slight angle onshore until their drogues snagged on the seafloor. Complementary data came from four moorings out from Evans Head, satellite imagery, sea level from a nearby tide gauge, and wind stress from the National Centers for Environmental Prediction and National Center for Atmospheric Research (NCEP/NCAR) (Kalnay et al. 1996). In all there were ~20 instrument systems yielding 50 data streams that were brought together in an attempt to understand the effects of the EAC and winds on the waters of the continental shelf.
Materials and methods
The RV Franklin worked in the study area from 20 to 26 November 1989 and its instrumentation included a Neil Brown conductivity, temperature, depth (CTD) and Niskin bottle rosette for water sampling, a towed profiler (a Chelsea Instruments Ltd, SeaSoar), a thermosalinograph, expendable bathythermographs (XBTs) and an RD Instruments 150-kHz acoustic Doppler current profiler (ADCP) that continuously measured current profiles that were converted to true currents with navigation from the Global Positioning System (GPS). The GPS at the time only had sufficient satellites to give 9 h coverage per day. We attempted to run transects during such GPS ‘windows’, but this was not always possible. Note that the ADCP could not, because of side lobes in the transducer radiation patterns, measure currents in the lowest 15% of the water column, which would certainly carry part of the slope water intrusions that we discuss in this paper. We use practical salinity units (UNESCO 1981) and universal time, where Australian Eastern Standard Time is Coordinated Universal Time (UTC) + 10 h. The ship’s weather sensors recorded wind speed and direction.
Four moorings (A, B, C and D) were installed across the continental shelf at the 43-, 57-, 95- and 203-m isobaths along ~29°S out from Evans Head for 6 months from September 1989. Mooring A was 7 km from the shore, within the location of the upwelling plume described by Rochford (1972).
The depths of the Aanderaa current meters on Moorings A, B and C were 34, 37 and 85 m respectively, and on Mooring D they were 93, 133 and 193 m; herein these meters are referred to as current meters A34, B37 etc. The seven drifters that were released from the RV Franklin along a transect out from Cape Byron were tracked by ARGOS Collecte Localisation Satellites (CLS) and their batteries were charged by solar panels. Each comprised a torpedo-shaped surface float 1.5 m long and 0.6 m in diameter with a holey-sock drogue (sea anchor) 5 m long and 1 m in diameter centred at 50-m depth; these sea anchors were significantly deeper than subsequent World Ocean Circulation Experiment (WOCE)-standard Surface Velocity Program (SVP) drifters (see https://www.nodc.noaa.gov/woce/woce_v3/wocedata_1/svp/docs/reports/rep5/svp5.htm, accessed 26 October 2016).
NOAA satellites collected infrared data with their advanced very high-resolution radiometers (AVHRR) and these were received in Hobart (Tas., Australia). Images were processed to give sea surface temperature (SST) estimates (McMillin and Crosby 1984) and re-mapped to a standard cartographic projection (Nilsson and Tildesley 1986). Cloud cover frequently prevented useable satellite images from being obtained. The Manly Hydraulics Laboratory provided quarter hourly sea level data from Ballina (NSW, Australia).
A developing upwelling gave opportunities to compare surface temperatures measured by different instrument systems and the agreement was quite good, with values of 21°C obtained using satellite AVHRR at 0400 hours on 23 November 1989, 21.2 and 20.2°C obtained using a thermosalinograph on the RV Franklin at 4-m depth at ~2000 hours on 22 November and ~2200 hours on 25 November respectively and 20.2°C obtained using snagged Drifters #1 and #2 at 0.3-m depth on 25 November.
Results
Voyage track and surface temperatures
RV Franklin travelled northward on the continental shelf from Sydney (34°S) with the aim of studying the effects of the EAC and wind forcing on the waters of the shelf and slope off the eastern-most part of Australia. The EAC was not encountered until just north of 30°S and its warm, near-surface waters detected by the thermosalinograph are shown in Fig. 1b, c by the red and orange colours. The strengthening of a coastal upwelling near Evans Head is signalled by the decrease in temperature (light blue to deep blue) between the north-bound and south-bound passes on which a total of 11 zonal transects were occupied (Fig. 1a).
Drifters
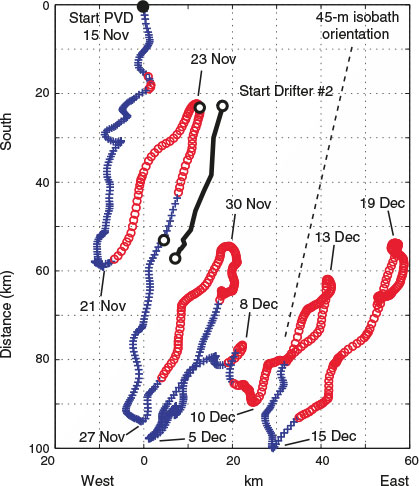
The ship released satellite-tracked drifters at each of seven CTD stations occupied at intervals of several kilometres out from Cape Byron on 23 November 1989: the initial few days of their tracks are shown in Fig. 2. All drifters came under the influence of the southward-flowing EAC. The innermost two drifters, #1 and #2, were released at the 54- and 62-m isobaths, where the bottoms of their drogues were 1.5 and 9.5 m above the sea floor respectively. They were carried at a slight angle into shallower water and into a developing plume of upwelled water and their SSTs decreased from 22.9 to 20.3°C (Drifter #1) and from 24.2 to 20.2°C (Drifter #2). Both then slowed and, after 1.5 days, became snagged to the bottom by their drogues at the 44-m isobath (where they were later recovered by RV Franklin). The speeds of Drifters #1 and #2 while moving unimpeded were 0.18 and 0.55 m s–1 respectively. The onshore movement of Drifter #2 until becoming snagged was ~7.5 ± 2.5 km or 0.06 ± 0.02 m s–1, with the uncertainty coming from the divergence of the isobaths downstream from the release point.
|
Drifter #3 moved along shore to the south at 1 m s–1 but, as it came in across the shelf, its speed dropped to as low as 0.1 m s–1 on 25 November 1989. Its surface temperature fell from 24.5°C at the release site to 22°C as it passed Woody Head, perhaps through encountering upwelled water (cf. Fig. 1b). Drifter #4 travelled along the outer shelf at 1 m s–1 over the first 2 days, later crossing to the slope at 31°S. Drifters #5 and #6 travelled at 1.3 m s–1 for the first 2 days above the upper slope and at the shelf edge respectively. Drifter #7 travelled above the mid-continental slope at 1.2 m s–1 for the first 2.5 days. The complete tracks of the five outermost drifters will be treated in a later paper.
Current meters
The current meter recordings (Fig. 3) showed the overwhelming effects of the southward-flowing EAC at the shelf edge mooring (Mooring D) and how these effects decreased across the shelf in to Mooring A, where southerly winds were strong enough to drive current reversals in the shallow waters. The uppermost current meter at the shelf edge, D93, showed that when the EAC was strong, at ~1–1.5 m s–1, for 1–2 weeks in November–December 1989 and January–February 1990, it turned 10–20° westward. However, this was accompanied by a 30-m drag-down of the instrument (Fig. 4) that may or may not have affected its compass. This strong onshore flow was not evident in the tracks of the drifters at the shelf edge (Fig. 2) nor in the ship’s ADCP measurements on the Evans Head transect at the location of D93 on 22 and 25–26 November. The drag-down for D133 reached 10 m, whereas D193 was too close to the bottom to be affected. The speeds decreased with depth, so that at D133 and D193 during strong events they were approximately one-half and one-fifth respectively of those at D93.

|

|
The records revealed a variety of time scales (Figs 4, 5). The temperatures at D133, D193 and C85 decreased and stayed cool from soon after the start of recording (September 1989) through spring and summer, as if showing the cool half of an annual oscillation, an oscillation that was out of phase with atmospheric temperatures. The southward current at D93 and D133 varied with a period of ~2–3 months and this signal extended in across the shelf to C85 and B37, but not to A34 (Fig. 5). At Mooring D during a lull in January 1990, the north–south current components oscillated with a period of 5–6 days, being most pure and strong at D193 (Fig. 4). The wind stress (Fig. 5) was not strong for most of the month and the variations that it had were unrelated to the current oscillations, so the oscillations must have been due to an embedded oceanographic variability. The oscillations at D193 were equivalent to a repeated north–south movement of 20 km. The sea level from Ballina did not show the oscillations and so they seem unlikely to be due to coastal trapped waves. Meter C85 showed oscillations in phase with those at D193, but with approximately half the amplitude.

|
Southerly (northward) wind stress drove current reversals at A34 and superimposed modulations on the 2- to 3-month period EAC oscillation at B37 and C85 (Fig. 5). From the start of the recordings in the second week of September until late October 1989, the temperatures at A34 and B37 showed only smooth increases, even though the north–south velocity components varied considerably. This may have been due to the water column still being mixed from winter cooling, as well as being horizontally homogeneous on the inner shelf, such that neither vertical nor horizontal movements brought waters of varying temperatures to the instruments. From late October, when stratification would have been established, to late December 1989, the temperature had 3–4°C trough-to-peak variations that we suggest were due to successive upwellings (driven by the EAC or winds) and southerly wind-driven downwellings. There were two mild upwelling-favourable wind events in the first half of December and one strong one at the end of December; the temperature at A34 suggests that upwellings occurred with all three. The first two events would have worked in concert with a strong EAC, whereas the last event drove an upwelling at a time when the current measured at Mooring D was near zero.
The first 2–3 weeks in January 1990 are a puzzle because although the wind stress was negligible and the shelf edge Mooring D registered only weak currents that were, as discussed above, fluctuating north–south, the currents on the shelf were northward and the water at A34 was cool (<21°C). At the end of the month there were two strong southerly wind events, each of which drove the temperature at A34 up to 24°C. In the last few days of January 1990, the EAC at the shelf edge increased to 1.5 m s–1, but its effects on the inner shelf are not clear because Mooring A34 was recovered at that time.
The strong relationship between wind stress, sea level, current and temperature at inner shelf Mooring A and the currents at moorings across the shelf were explored in a 5-week interval in November–December 1989 (Fig. 6). When downwelling-favourable southerly winds had been blowing for a day or two they raised sea level at the coast and drove a near-bottom current to the NNE. The temperature increased, but with a further lag of about 1 day. Upwelling occurred whenever the downwelling-favourable southerlies abated and the EAC on the inner shelf (i.e. at Mooring A) was able to resume its near-southward flow, as it did in the interval 23–27 November 1989. Thus, the EAC alone was sufficient to drive cold bottom waters shoreward, albeit at a very slight angle. Northerly wind stress on 2 and 13 December 1989 probably augmented the effects of the EAC in driving upwelling.

|
The EAC was particularly strong in November–December 1989 (Fig. 6e): at D93 it accelerated from near zero on 15 November 1989 to 1.5 m s–1 southward and then averaged ~1.2 m s–1 for the next 3 weeks. It then began to weaken, apart from a 1.3 m s–1 pulse from 14–16 December, to 0.2 m s–1 on 21 December 1989. The strength of the 4-week EAC pulse was progressively diminished at the moorings across the shelf, with A34 showing no effect. However, short-period, wind-forced oscillations with amplitudes up to 0.3 m s–1 were not just confined to the shelf sites, but also modulated the EAC, as measured at the shelf edge D93, even when it was running at full spate.
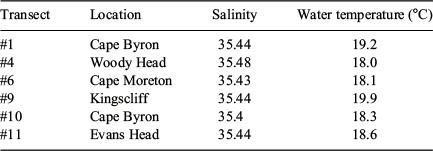
The 2- to 3-day lag of the currents, sea level and temperature variations behind the wind stress (Fig. 6) meant that their correlations with it were near zero or negative. To adjust for this, the currents and sea level time series were moved by 2 days and the temperature by 3 days relative to the wind stress. In addition, the time series was truncated to fit within the period when the EAC component at current meter D93 exceeded 1 m s–1. Correlations for wind stress from 17 November to 13 December 1989, sea level and currents from 19 November to 15 December 1989 and temperature at current meter A34 from 20 November to 16 December 1989 are given in Table 1. Wind stress was a significant driver of variations of current and temperature at current meter A34 and slightly less for sea level. The effect of wind stress decreased outward across the continental shelf to C85, but the correlation still reached 0.3 at the continental shelf edge current meter D93. The currents at the four meters were highly correlated, with coefficients ranging between 0.55 and 0.9; for example, D93 had correlation coefficients of 0.75 and 0.8 with B37 and C85 respectively.

|
The interpretation of progressive vector diagrams (PVDs) has limitations, but they do have the capability to combine time series of current components and temperatures, as is the case for Fig. 7, which covers the same 5-week interval as Fig. 6. Fig. 7 shows that upwelling (cooling) occurred with flow along the bottom topography to the south and that downwelling occurred with the opposite flow. The downwelling flow included a slight cross-bathymetry flow offshore; the upwelling flow was mainly along the bottom topography. One interpretation of this is that the upwelling had occurred further north and was carried past the current meter. The temperature changes often lagged the reversals by about 1 day, probably because time was needed for ‘new’ water (whether upwelled or downwelled) to reach the instrument. The movement of Drifter #2 is included in Fig. 7 so that the direction and distance travelled by it before it ran aground can be compared with the implied water movement from the PVD. The agreement is quite good and both indicate that the drifter was released at the start of a current reversal that was followed by the arrival of cooler water at the current meter.
|
Surface expression of the upwelling
The only partly clear satellite image during the ship survey (21–26 November 1989) showed an upwelling plume with a temperature of 21°C, extending southward away from the coast between Ballina and Evans Head (Fig. 8a). That the upwelling was real is confirmed by other instruments: the underway temperatures measured by the ship at 4-m depth 6 h earlier (Fig. 8b) showed that it crossed cool (21.2°C) water in the same location as the plume in the image. Three days later, the upwelled plume had both become colder (minimum 20.1°C) and it extended further northward (Fig. 8c). When Drifter #1 snagged early on 24 November 1989 after 1 day, its temperature was 21.8°C, dropping gradually to 20.2°C over the next day, presumably as the upwelling developed. Similarly, the temperature at Drifter #2 when it snagged late on 24 November 1989 after 1.5 days was 21.2°C, decreasing to 20.2°C after another day.

|
Shipboard current measurements in the main study area
The ADCP current measurements from the RV Franklin revealed both temporal and spatial changes in the study area. Three sections off Cape Byron on 21, 22 and 25 November 1989 (Fig. 9a–c) and two off Evans Head on 22 and 26 November 1989 (Fig. 9d, e) show how the EAC strengthened: off Cape Byron, from a maximum of 1.2 m s–1 on 21 and 23 November to >1.5 m s–1 on 24 November 1989; off Evans Head, from >1.4 m s–1on 22 November to >1.6 m s–1 on 25 November 1989. Initially, the currents on the inner shelf were northward at both Cape Byron (up to 0.4 m s–1 as measured by the ADCP) and Evans Head (up to 0.28 m s–1 as measured at inshore current meter A34), but after several days they had decreased and reversed to flow southward.

|
Water properties in the main study area
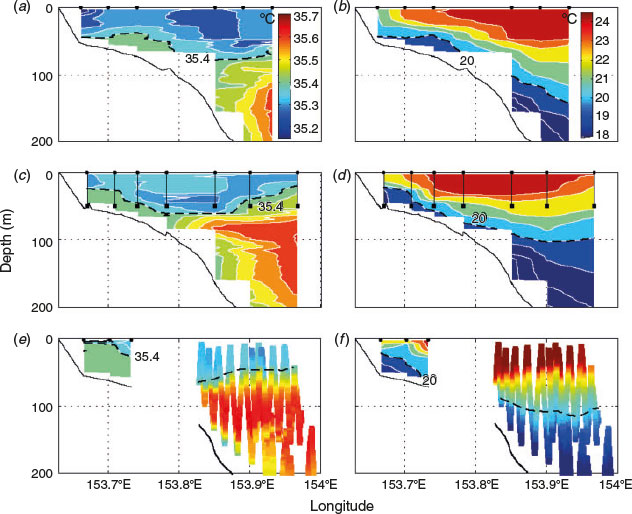
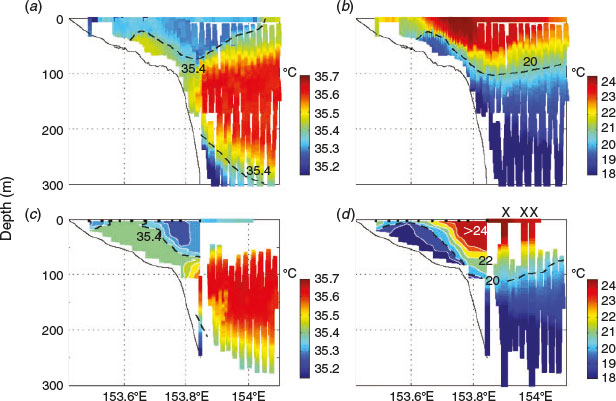
Sections of salinity and temperature and, where bottle samples were available, nitrate and oxygen, were drawn from measurements taken between 21 and 26 November 1989 with the CTD and SeaSoar along seven transects (#1–5, 10 and 11) between Cape Byron and Woody Head. Here we present the salinity, temperature, nitrate and oxygen sections from the southernmost transect, Woody Head, Transect #4 (Fig. 10), then salinity and temperature sections from three transects at Cape Byron, Transects #1, 5 and 10 (Fig. 11), and two at Evans Head, Transects #3 and 11 (Fig. 12). To save space, the nitrate and oxygen sections are presented for Woody Head only.

|
|
|
Woody Head, Transect #4 on 22 November 1989
During this transect, the wind stress was near zero and the current meter A34 recorded a northward flow of <0.1 m s–1 (Fig. 9). Shipboard ADCP measurements were not taken because the GPS satellites were not in view. The sections (Fig. 10) showed warm, fresh, nitrate-poor and oxygen-rich EAC waters above the continental slope. Below 100-m depth were the high-salinity waters from the central Tasman Sea. On the shelf between the 50- and 150-m isobaths there was considerable doming up to ~20-m depth of a near-mixed continental slope water intrusion, possibly uplifted further north, with temperature 18.0°C, salinity 35.48, nitrate a little over 6 μmol L–1 and oxygen ~175 µmol L–1. This contrasted with the water above: temperature 21.6°C, salinity 35.36, zero nitrate and high oxygen (>230 µmol L–1). At the shallowest station (bottom depth 29 m) there was a 15-m layer of low salinity (~35.03), probably river run-off, atop a 10-m layer with salinity ~35.32. The temperature in the lower layer was constant at 21.7°C, nitrate was depleted and oxygen was rich to the bottom. This water was too fresh and too warm to be from the continental slope and was probably influenced by the plume of the Clarence River. The transect started 5 km north of the river mouth, and the inner shelf (A34) currents at the time were northward.
Cape Byron, Transects #1, 5 and 10 on 21, 23 and 25 November 1989
During this 4-day interval, the current at A34 changed from >0.25 m s–1 northward, with downwelling, as a result of northward wind stress, reversing to 0.2 m s–1 southward, with upwelling, when the wind event ceased. At the mid-shelf, an intrusion of continental slope water was present as a doming of the salinity, temperature, nitrate and oxygen contours (Fig. 11). The doming was greatest above the 70-m isobath, where, below 50-m depth, the waters were near mixed and salty (35.44), cold (19.2°C), nitrate rich (5.5 µmol L–1) and oxygen poor (185 µmol L–1). The nearshore surface water had a temperature of 21°C and low salinity (35.15), perhaps from the plume of the Richmond River that enters the sea at Ballina 25 km to the south; because the northward component measured by the ADCP on RV Franklin at the time was 0.4 m s–1, this distance could be covered in ~18 h.
Transects #5 and 10 revealed a coastward progression of the stream of continental slope water and on Transect #11 it reached the surface, as indicated by the 35.4 isohaline. At the nearshore station the salinity was near constant at 35.4 down to the bottom at 55 m and was thus likely to be upwelled and originally from the continental slope. The surface and bottom temperatures were 22.5 and 18.3°C respectively, with insolation, perhaps, creating the thermocline. The absence of low-salinity water at the surface suggests that the Richmond River plume was no longer having an effect, which is to be expected because the southward currents recorded at A34 would have been carrying it southward. The nitrate values at the inner shelf on Transect #10 exceeded 1 µmol L–1 below 20-m depth and 5 µmol L–1 in the bottom 10 m.
Evans Head, Transects #3 and 11 on 22 and 25–26 November 1989
On both transects the warm, low-salinity waters of the EAC spread in across the shelf to about the 80-m isobath and the high-salinity Tasman Sea water reached in to the shelf edge (Fig. 12). On Transect #3, the salinity 35.4 and 20°C contours domed up to 30-m depth at the 70-m isobath, thereby marking the extent of intrusion by continental slope waters. At the inshore CTD station (bottom depth 32 m), the surface waters were warm (22°C) and relatively fresh (salinity 35.15), like those on Cape Byron Transect #1. In this case fresh water from the mouth of the Clarence River, 35 km to the south, could have reached the transect in less than a day and a half if travelling at the 0.3 m s–1 measured by A34 at the time. The values at the bottom of the cast (28 m) were salinity 35.27 and 21.4°C and therefore the water was not a continental slope intrusion. Transect #11 showed that, as at Cape Byron, there had been a movement over the 4-day interval of the southward-flowing stream of water of continental slope origin that was both shoreward, by some 12 km, and upward, such that the 35.4 isohaline upwelled from 30-m depth to the surface and the 20°C isotherm reached 10-m depth. The 1- and 5-µmol L–1 contours of nitrate concentration approximately followed the 21 and 20°C isotherms respectively. At the 50-m isobath there was a subsurface mixed layer of salinity 35.44 and 18.6°C that extended from 20-m depth to the bottom. At the surface, the innermost station, at the 28-m isobath, had a 10-m low-salinity, cool layer (salinity 35.29, 21.5°C) that would have been due to outflow from the Richmond River responding to the southward current as seen at A34. However, beneath this there was continental slope water that could be identified by its high salinity (salinity 35.41) and low temperature of 19.8°C.
The northern transects
The ADCP measurements along the northern transects (Fig. 13) revealed, within limitations of the survey being synoptic, that the EAC accelerated southward from 1.1 to 1.2 to 1.3 m s–1 as it progressed Point Lookout–Jumpinpin–Kingscliff and, further south, it increased to 1.5 m s–1 at Cape Byron and 1.6 m s–1 at Evans Head (Fig. 9), a total distance of 190 km. In addition, the cross-sectional area of the strong current region increased with distance southward. No ADCP measurements were taken off Cape Moreton because of a lack of GPS coverage.
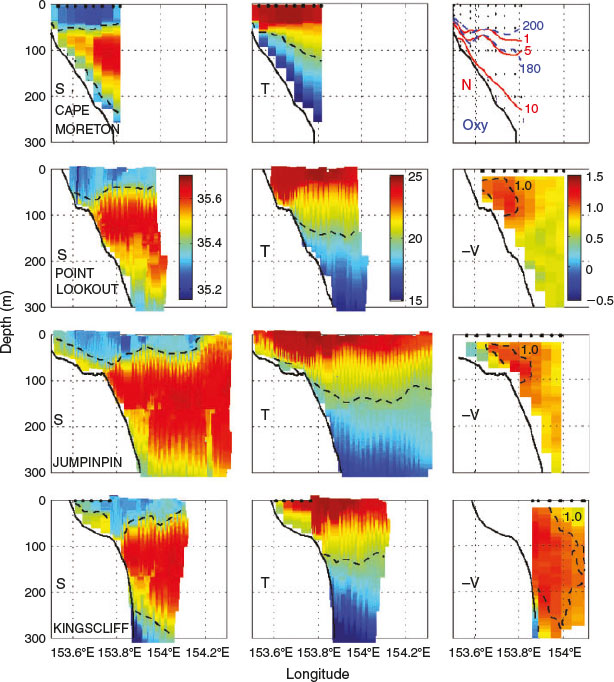
|
The Cape Moreton transect revealed warm, low-salinity, zero-nitrate, high-oxygen surface waters and the other transects suggested that these waters moved southward through the study area (Fig. 13). Their source may have been the bifurcation of the South Equatorial Current near 15°S. Below them, between 100 and 200 m, were high-salinity waters from the central Tasman Sea. The temperature, salinity and nitrate structures were near parallel with the floor of the continental shelf, which has a consistent slope out to the 250-m isobath. The nearshore bottom waters at 50-m depth at the 59-m isobath had salinity 35.43, temperature 18.1°C, nitrate >5 µmol L–1 and oxygen 170 µmol L–1.
The high-salinity waters of the central Tasman Sea were found on all the northern transects, and on the Jumpinpin transect, which extended furthest east, they reached the surface. The edge of the salinity maximum spread across the floor of the shelf as an intrusion from the continental slope in the following manner:
-
at Point Lookout it extended all the way in to the 30-m isobath where the salinity was 35.47 with a temperature of 20.1°C
-
at Jumpinpin the bottom salinities at the mid-shelf exceeded salinity 35.5 with temperatures as low as 19.2°C, and even at the inshore end of the transect the bottom salinity was 35.49 with a temperature of 20.1°C
-
similarly, at Kingscliff the high-salinity waters reached the 35-m isobath where at 28-m depth the salinity and temperature were 35.44 and 19.9°C; the surface values were 35.36 and 21.4°C, and the low temperature could be ascribed to upwelling but with the low salinity it is more likely to come from the plume of the Tweed River mouth 10 km to the north.
Temperature–salinity diagrams
Temperature–salinity (TS) diagrams (Fig. 14) made with data from the CTD and SeaSoar cover from the inner shelf to the continental slope where the Tasman Sea salinity maximum was encountered. The profiles in TS space follow three main trajectories that can be seen in the Cape Moreton panel: the first trajectory passes through the Tasman Sea salinity maximum at 35.65 and 20°C (Fig. 14, blue); the second passes through a salinity maximum at 35.5–35.55 and 19°C (Fig. 14, green); and the third reaches down towards salinity 35.4–35.45 and 18°C (Fig. 14, red). Crossovers occur due to mixing. Superimposed on all the diagrams is the TS trajectory for the station at the 42-m isobath (the third shallowest station) on the Evans Head Transect #11, where cold, low-salinity waters with density ~1025–1025.5 kg m–3 upwelled to the surface. Evidence for mixing with the Richmond and Clarence River plumes can be seen in Fig. 14 (top left panel), where the trajectories for the shelf stations are distorted to below salinity 35.25 between 21 and 22°C. The nearshore surface salinity minima that were reached were 34.82 for Ballina Transect #2, 35.03 for Woody Point Transect #4 and 35.15 for Cape Byron Transect #1 and Evans Head Transect #3. Waters warmer than 22°C are from the upper 100–200 m of the EAC.

|
The continental slope waters intruding onto the mid- and inner shelf had a range of salinities and temperatures that would have depended upon their origins, but from examining the sections it appears that they came from the upper part of the open ocean salinity maximum. The TS properties (Table 2) are from CTD stations within the intrusions. The range of properties probably reflects variability in space and time. Note that the temperatures recorded at current meter A34 briefly dropped below 18°C 1 day after Transect #11, showing that the upwelling had continued to develop.
|
Discussion
The present study examined features of the EAC, downwellings driven by southerly winds and upwellings mainly driven by the EAC, but sometimes by northerly winds, near Evans Head at 29°S in the summer of 1989–90. The ‘normal’ situation was for the EAC to drive cool continental slope water onto the shelf and for this to lead to nearshore upwelling. However, there was one upwelling when the EAC was weak and the wind forcing was northerly, as well as two others when the EAC and wind forcing were both present. Between late October 1989 (the onset of stratification) and early February 1990, a current meter on the innermost of four moorings revealed that the upwellings were interrupted by 10 southerly wind events that reversed the southward current and drove downwelling. The current reversals and increases in coastal sea level lagged the wind forcing by ~2 days and then after another day the temperature increased. The same lags occurred at the end of the southerly wind events, with the current turning southward and lower temperatures and sea level being restored. Although the wind reversed the current at this nearshore site, the current meters out across the shelf registered the events only as a modulation of the southward flow. The high frequency of the upwellings and downwellings is in keeping with the findings of Rossi et al. (2014). The nearshore current reversal due to a southerly wind was first reported by Halligan (1911): a southerly gale reversed the current from 1.25 knots (~0.64 m s–1) southward to 0.9 knots (~0.46 m s–1) northward; 2 days after the gale had abated, the southward current was resumed. Somewhat later, Armbrecht et al. (2014) described a northward flow that lagged a southerly wind event by a day and that after another day stratification disappeared; that is, a downwelling had been established. Both delays were a day shorter than those that we interpreted from our data.
Quite fortuitously, in the present study a downwelling followed by an upwelling was captured with RV Franklin during a 1-week survey. Here we start with the first event, the downwelling, and merge measurements from the RV Franklin and the moorings into an oblique diagram (Fig. 15). The downwelling came at the end of a 3-day southerly wind event and was revealed by warm nearshore waters and a 0.3 m s–1 northward flow seen by the ADCP on the RV Franklin on the Cape Byron transect and a similar flow, with a slight offshore component, at current meter A34, where the temperature was 3°C warmer than before the event. The temperature sections showed warm waters nearshore, but seaward (from about the 50-m isobath) the floor of the shelf was bathed by colder waters, probably uplifted by a bottom Ekman effect driven by the EAC. The warm western edge of the EAC spread into the inner shelf near Cape Byron, but by the Woody Point transect it was above the outer shelf and, on that transect, the mid-shelf cold water was uplifted quite close to the surface, almost an upwelling. Thus, the EAC continued to drive the uplift of upper continental slope waters onto the shelf even though the southerly wind drove downwelling and prevented these cool waters from reaching the inner shelf.

|
In the next oblique diagram (Fig. 16), we treat the second event, an upwelling, for which additional instrument systems were available. The upwelling commenced after 2 days of calm wind conditions when the inner shelf currents had resumed their southward flow. The seven drifters released on the transect out from Cape Byron on 23 November 1989, the current meter A34 and the ship’s ADCP all revealed the resumption of southward flow on the inner shelf following the northward flow and downwelling (Fig. 15). The two nearshore drifters moved shoreward at a slight angle to the topography and then their drogues became snagged on the bottom. The surface temperature of the water that carried Drifters #1 and #2 was initially 24°C, but dropped to 20–21°C as they were carried into the region where cold water was upwelling to the surface. A satellite image from this time showed a plume of cold water apparently moving away from the coast, and it is represented in Fig. 16. The Evans Head temperature section on 25–26 November 1989, when the upwelling appeared to be fully developed, showed that the 20°C isotherm, an approximate upper boundary for the cold, salty, low-oxygen, high-nitrate upwelled water, had moved 12 km shoreward and 30 m vertically in the 3 days since the first transect (see also Fig. 11). Of course, this was part of a strong southward flow, so the upwelling process was a slow migration coastward (and upward) of the edge of a south-going stream, rather than the bulk movement of a parcel of water across the shelf. Finally, the nearshore surface edge of the EAC, as indicated by the 24°C isotherm, was 7 km offshore from Cape Byron and 25 km off Evans Head, so it was separating from the coast.

|
The model results of Oke and Middleton (2000) showed the EAC strengthening due to the narrow shelf off Cape Byron and that this led to a shoreward component and to upwelling. Such an acceleration was one of four causes given for upwelling at Smoky Cape (31°S) by Roughan and Middleton (2002), the others being wind, encroachment of the EAC onto the shelf and the separation of the EAC from the coast. The role of the acceleration of the EAC in the present study is difficult to interpret because, although the shelf width narrowed from ~25 to ~15 km at Cape Byron, the EAC increased in speed along its 170-km path from Point Lookout, past Cape Byron and on to Evans Head (shelf width 30 km), as well as increasing in speed with time at both Cape Byron and Evans Head. Brieva et al. (2015) found that wind and EAC forcing in unison in the September–December period drove episodic upwellings leading to high chlorophyll a events south-east of Fraser Island, but in our case near Evans Head either form of forcing was sufficient, with the EAC being dominant, as found by Schaeffer et al. (2014), with the onshore transport at 30°S being strongly linked to EAC forcing. Their estimate of the cross shelf velocity component was 0.1 m s–1 (Schaeffer et al. 2014), whereas ours was 0.06 ± 0.02 m s–1 from a drifter track and 0.035 m s–1 for the shoreward migration of the southward-flowing stream of continental slope water on the shelf.
At a mid-shelf mooring (CH070) at 30°S, Wood et al. (2016) observed a seasonal cycle with a maximum in March in the upper waters, but the phase changed with depth so that near the bottom the minimum was in November. Wood et al. (2016) ascribed this to wind-driven upwelling and the EAC in summer driving slope water onto the shelf and causing stratification. In winter, the winds were downwelling favourable and, with vertical mixing, broke down the stratification to give relatively warm bottom waters (Wood et al. 2016). Our summer measurements agree with this: the outer shelf current meter C85 and the two deeper shelf edge current meters D133 and D193 showed the cool half of an annual cycle between September and February. The vertically mixed inner shelf water in winter was reported by Rochford (1972) and is also suggested by the September–October part of the temperature record from our current meter A34.
Although wind-driven upwelling occurs at several locations along the temperate Australian coast, such as south-western Australia (Gersbach et al. 1999), the Great Australian Bight (Kämpf et al. 2004) and western Tasmania (Kämpf 2015), the present study has revealed a contrary situation, with wind forcing switching off existing upwelling that was driven by the EAC.
The observations for the present study were performed over a quarter of a century ago and, since then, the importance of upwelling for phytoplankton growth and the implications for the food chains near Coffs Harbour and Fraser Island have been well documented in the recent work cited above. The present study adds to knowledge about a region that is important for commercial fishing, including trap and line fishing on the continental shelf for kingfish, snapper, trevalla, mackerels, tunas, sharks and spanner crabs, as well as trawling for prawns on the shelf and in the estuaries. There is a high level of recreational fishing, coastal engineering and tourism in the area.
Conclusions
-
An inner mooring out from Evans Head between October 1989 and February 1990 recorded alternating currents that were southward (cool) and northward (warm) and were associated with forcing by the EAC and southerly winds respectively. We identified the events as upwellings and downwellings.
-
The variations in currents and sea level lagged behind the southerly wind events by ~2 days; the temperature at the current meter lagged by a further day. Similar lags occurred when the southerlies stopped and EAC forcing took over.
-
The southerly wind reversed the inner shelf current off Evans Head, but only modulated and did not reverse the currents at moorings further out across the shelf. The effect of the southerly wind nearshore was to ‘switch off’ upwelling and ‘turn on’ downwelling.
-
A week-long survey with a research vessel, complemented by a variety of instrument systems, captured a downwelling event that was followed by an upwelling when the southerly wind abated.
-
There was a southward stream of continental slope water on the shelf during the entire week and it moved coastward when the downwelling event ceased, and this led to the upwelling.
-
The upwelling occurred close to the coast at Cape Byron and nearer the middle of the shelf off Evans Head.
-
The EAC, which had a subsurface speed maximum, accelerated both along its path and as time passed during the survey.
-
The effects of large variations in the strength of the EAC with a time scale of a few months reached inward across the shelf with progressively decreasing influence, becoming undetectable at the inner shelf mooring.
-
The plumes from the Richmond and Clarence rivers were detected at some of the nearshore CTD stations. Given that the upwelled waters were also detected nearshore, one may speculate that parts of them may enter the rivers on flood tides and benefit juvenile fish and prawns.
Acknowledgements
The authors thank the captain and crew of the RV Franklin, the seagoing scientific crew and numerous CSIRO staff ashore for guidance with data analysis, particularly Kim Badcock for assistance with satellite image processing. The authors thank the three MFR reviewers for their many constructive criticisms.
References
Armbrecht, L. H., Roughan, M., Rossi, V., Schaeffer, A. K., Davies, P. L., Waite, A. M., and Armand, L. K. (2014). Phytoplankton composition under contrasting oceanographic conditions: upwelling and downwelling (eastern Australia). Continental Shelf Research 75, 54–67.| Phytoplankton composition under contrasting oceanographic conditions: upwelling and downwelling (eastern Australia).Crossref | GoogleScholarGoogle Scholar |
Brieva, D., Ribbe, J., and Lemckert, C. (2015). Is the East Australian Current causing a marine ecological hot-spot and an important fisheries near Fraser Island, Australia? Estuarine, Coastal and Shelf Science 153, 121–134.
| Is the East Australian Current causing a marine ecological hot-spot and an important fisheries near Fraser Island, Australia?Crossref | GoogleScholarGoogle Scholar | 1:CAS:528:DC%2BC2MXkvF2ksQ%3D%3D&md5=c8acac6d1dd89d1b770987c4245c0b74CAS |
Crooks, A. D. (1960). Coastal hydrological investigations in south-eastern Australia, 1958. Oceanographic station list, Vol. 40, CSIRO Division of Fisheries and Oceanography, Melbourne, Vic., Australia.
Gersbach, G. H., Pattiarachi, C. B., Ivey, G. N., and Cresswell, G. R. (1999). Upwelling on the south-west coast of Australia – source of the Capes Current? Continental Shelf Research 19, 363–400.
| Upwelling on the south-west coast of Australia – source of the Capes Current?Crossref | GoogleScholarGoogle Scholar |
Griffin, D. A., and Middleton, J. H. (1992). Upwelling and internal tides over the inner New South Wales continental shelf. Journal of Geophysical Research 97, 14389–14405.
| Upwelling and internal tides over the inner New South Wales continental shelf.Crossref | GoogleScholarGoogle Scholar |
Halligan, G. H. (1911). The bar harbours of New South Wales. Minutes of Proceedings of the Institution of Civil Engineers 184, 128–148.
Hamon, B. V., Godfrey, J. S., and Greig, M. A. (1975). Relation between mean sea level, current and wind stress on the east coast of Australia. Australian Journal of Marine and Freshwater Research 26, 389–403.
| Relation between mean sea level, current and wind stress on the east coast of Australia.Crossref | GoogleScholarGoogle Scholar |
Kalnay, E., Kanamitsu, M., Kistler, R., Collins, W., Deaven, D., Gandin, L., Iredell, M., Saha, S., White, G., Woollen, J., Zhu, Y., Chelliah, M., Ebisuzaki, W., Higgins, W., Janowiak, J., Mo, K. C., Ropelewski, C., Wang, J., Leetmaa, A., Reynolds, R., Jenne, R., and Joseph, D. (1996). The NCEP/NCAR 40-year reanalysis project. Bulletin of the American Meteorological Society 77, 437–471.
| The NCEP/NCAR 40-year reanalysis project.Crossref | GoogleScholarGoogle Scholar |
Kämpf, J. (2015). Phytoplankton blooms on the western shelf of Tasmania: evidence of a highly productive ecosystem. Ocean Science 11, 1–11.
| Phytoplankton blooms on the western shelf of Tasmania: evidence of a highly productive ecosystem.Crossref | GoogleScholarGoogle Scholar |
Kämpf, J., Doubell, M., Griffin, D., Matthews, R. L., and Ward, T. M. (2004). Evidence of a large seasonal coastal upwelling system along the Southern Shelf of Australia. Geophysical Research Letters 31, L09310.
| Evidence of a large seasonal coastal upwelling system along the Southern Shelf of Australia.Crossref | GoogleScholarGoogle Scholar |
McMillin, L. M., and Crosby, D. S. (1984). Theory and validation of multiple window sea surface temperature technique. Journal of Geophysical Research 89, 3655–3661.
| Theory and validation of multiple window sea surface temperature technique.Crossref | GoogleScholarGoogle Scholar |
Nilsson, C. S., and Tildesley, P. C. (1986). Navigation and re-mapping of AVHRR imagery. In ‘Proceedings of the 1st Australian AVHRR Conference’, 22–24 October 1986, Perth, WA, Australia. (Ed. A. J. Prata.) pp. 286–298. (CSIRO, Division of Groundwater Research: Perth, WA, Australia.)
Oke, P. R., and Middleton, J. H. (2000). Topographically induced upwelling off eastern Australia. Journal of Physical Oceanography 30, 512–531.
| Topographically induced upwelling off eastern Australia.Crossref | GoogleScholarGoogle Scholar |
Oke, P. R., England, M. H., and Middleton, J. H. (2003). On the dynamics of an observed thermal front off central eastern Australia. Journal of Geophysical Research 108, 3106–3117.
| On the dynamics of an observed thermal front off central eastern Australia.Crossref | GoogleScholarGoogle Scholar |
Rochford, D. J. (1972). Nutrient enrichment of East Australian coastal waters: I. Evans Head upwelling. CSIRO Division of Fisheries and Oceanography Technical Paper 33, Melbourne, Vic., Australia.
Rossi, V., Schaeffer, A. K., Wood, J., Galibert, G., Morris, B. D., Sudre, J., Roughan, M., and Waite, A. M. (2014). Seasonality of sporadic physical processes driving temperature and nutrient high-frequency variability in the coastal ocean off southeast Australia. Journal of Geophysical Research – Oceans 119, 445–460.
| Seasonality of sporadic physical processes driving temperature and nutrient high-frequency variability in the coastal ocean off southeast Australia.Crossref | GoogleScholarGoogle Scholar |
Roughan, M., and Middleton, J. H. (2002). A comparison of observed upwelling mechanisms off the east coast of Australia. Continental Shelf Research 22, 2551–2572.
| A comparison of observed upwelling mechanisms off the east coast of Australia.Crossref | GoogleScholarGoogle Scholar |
Schaeffer, A., and Roughan, M. (2015). Influence of a western boundary current on shelf dynamics and upwelling from repeat glider deployments. Geophysical Research Letters 42, 121–128.
| Influence of a western boundary current on shelf dynamics and upwelling from repeat glider deployments.Crossref | GoogleScholarGoogle Scholar |
Schaeffer, A., Roughan, M., and Wood, J. E. (2014). Observed bottom boundary layer transport and uplift on the continental shelf adjacent to a western boundary current. Journal of Geophysical Research – Oceans 119, 4922–4939.
| Observed bottom boundary layer transport and uplift on the continental shelf adjacent to a western boundary current.Crossref | GoogleScholarGoogle Scholar |
UNESCO (1981). Tenth Report of the Joint Panel on Oceanographic Tables and Standards. UNESCO Technical Papers in Marine Science 36, UNESCO, Paris.
Wood, J. E., Schaeffer, A., Roughan, M., and Tate, P. M. (2016). Seasonal variability in the continental shelf waters off southeastern Australia: fact or fiction? Continental Shelf Research 112, 92–103.
| Seasonal variability in the continental shelf waters off southeastern Australia: fact or fiction?Crossref | GoogleScholarGoogle Scholar |