

Baseline biogeochemical data from Australia’s continental margin links seabed sediments to water column characteristics
Lynda Radke A D , Tony Nicholas A , Peter A. Thompson B , Jin Li A , Eric Raes C , Matthew Carey A , Ian Atkinson A , Zhi Huang A , Janice Trafford A and Scott Nichol AA National Earth and Marine Observations Group, Geoscience Australia, GPO Box 378, Canberra, ACT 2601, Australia.
B CSIRO Marine and Atmospheric Research, Hobart, Tas. 7001, Australia.
C Alfred-Wegener-Institute, Helmholtz-Centre for Polar and Marine Research Am Handelshafen 12, D-27570 Bremerhaven, Germany.
D Corresponding author. Email: lynda.radke@ga.gov.au
Marine and Freshwater Research 68(9) 1593-1617 https://doi.org/10.1071/MF16219
Submitted: 17 June 2016 Accepted: 10 November 2016 Published: 16 January 2017
Journal Compilation © CSIRO Publishing 2017 Open Access CC BY-NC-ND
Abstract
Surficial marine sediments are an important source of nutrients for productivity and biodiversity, yet the biogeochemistry of these sediments is poorly known in Australia. Seabed samples were collected at >350 locations in Australia’s western, northern and eastern continental margins during Federal Government surveys (2007–14). Parameters analysed included measures of organic matter (OM) source (δ13C, δ15N and C : N ratios), concentration (percentage total organic carbon, %TOC, and surface area-normalised TOC, OC : SA) and bioavailability (chlorin indices, total reactive chlorins, total oxygen uptake, total sediment metabolism (TSM), sediment oxygen demand (SOD) and SOD and TSM normalised against TOC). The aim of the present study was to summarise these biogeochemical ‘baseline’ data and make contextualised inferences about processes that govern the observed concentrations. The OM was primarily from marine sources and the OC : SA broadly reflected water column productivity (based on Moderate Resolution Imaging Spectroradiometer, MODIS). Approximately 40% of sediments were organic poor by global standards, reflecting seawater oligotrophy; ~12% were organic rich due to benthic production, high water column productivity and pockmark formation. OM freshness varied due to pigment degradation in water columns and dilution with refractory OM in reworked sediments. δ15N values confirmed the importance of N2 fixation to Timor Sea productivity, and point to recycling of fixed nitrogen within food chains in Western Australia.
Additional keywords: diazotroph, Fe, particulate organic carbon, total nitrogen, Trichodesmium.
Introduction
Background
Modern ocean sediments cover ~70% of the Earth’s surface (Dutkiewicz et al. 2015). These sediments comprise the largest carbon (C) reservoir on the planet and the reactive components play a key role in controlling atmospheric oxygen (O2) and carbon dioxide (CO2) concentrations on time scales of thousands of years (Sundquist 1985). Marine primary production accounts for ~50% of the global annual CO2 uptake (Field et al. 1998; Sabine et al. 2004; Falkowski 2012), and up to 17% of the organic matter (OM) that is synthesised settles to the benthic layer (Wollast 1991; Bacon et al. 1994), where it supports a broad range of benthic organisms (McCallum et al. 2013). For example, the biodiversity of polychaetes and crustaceans in sediments between 35 and 13°S along Australia’s western coast showed strong correlations with estimated net productivity and OM flux to the sediments (McCallum et al. 2015). Management of the deep sea and benthic biodiversity is an Australian Government (e.g. Commonwealth of Australia 2002) and international priority with support from the Parties to the Convention on Biological Diversity and the United Nations (Bax et al. 2016).
Australia has one of the three largest marine jurisdictions in the world covering an area of ~14 × 106 km2 of ocean (Symonds et al. 2009) and incorporating a diverse range of geomorphic features that span water depths from <200 m (continental shelf) to ~7000 m (deep ocean trenches; Heap and Harris 2008). Australian ocean waters are generally oligotrophic (Hobday et al. 2006), very nitrogen (N) limited (Thompson et al. 2011a, 2011b) and are recognised for a high abundance of N2-fixing cyanobacteria (Drexel 2007) that have a high iron (Fe) requirement (Rubin et al. 2011). However, there are almost no previous studies that allow a large-scale perspective on the role of N2 fixation in the regional N cycle. Indeed, despite playing fundamental roles in global biogeochemical cycling and benthic biodiversity, there is little basic information on seabed biogeochemical properties over most of Australia’s marine jurisdiction (outside of coastal waters). For example, there were only three samples with total organic carbon (TOC) measurements from the Australian continental margin in the global seabed dataset of ~5600 samples compiled by Seiter et al. (2004). Similarly, a global dataset of ~2300 δ15N values had scant information for the Australian continental margin (Tesdal et al. 2013). Both global datasets had notable deficits of information in the Australian tropics, which is recognised for globally significant levels of biodiversity (Tittensor et al. 2010).
Over the past decade, Geoscience Australia (GA) has undertaken several geophysical seabed mapping surveys for Australian Federal Government programs (Table 1). Although the predominant focus of these surveys was energy security and CO2 sequestration, sedimentology, biology and geochemistry data were also collected as environmental baselines to improve our understanding of seafloor environments and redress some of the regional and global data gaps. The aim of the present study was to summarise the biogeochemical ‘baseline’ data collected from more than 350 stations situated in the continental margins of Australia and to make contextualised inferences about the processes that govern the observed concentrations. These stations were primarily situated in the west and north, although there was a small number of stations in the east. Emphasis was placed on parameters that could be measured on samples collected in quick succession to enhance the geophysical mapping programs and to complement contemporaneous collections of physical and biological samples that were focused on describing habitats and developing biodiversity surrogates (McArthur et al. 2010; Radke et al. 2011a, 2011b; Huang et al. 2012). The data are presented in conventional formats and, where possible, against a background of global values. Grain size and element data are also used to add context. The datasets have been made publically available (see the reference list in the Supplementary material).

|
The biogeochemical parameters considered in the present study are summarised in Table 2 and comprise OM concentration (percentage total organic carbon, %TOC, and specific surface area, SSA, normalised TOC concentrations, OC : SA), source (δ13C and δ15N) and quality (chlorin indices (CIs), total reactive chlorins (TRC), total oxygen uptake (TOU), total sediment metabolism (TSM), sediment oxygen demand (SOD) and SOD and TSM normalised against TOC) measures. Sediment percentage total organic carbon (%TOC) concentrations are the most widely available sedimentary parameter for representing the flux of particulate OM (POM) to the sea floor (Seiter et al. 2004; 2005), which exhibits significant regional variability (Lutz et al. 2002). These concentrations can be a useful measure of resources available to support benthic biota (Snelgrove et al. 1992) because positive relationships have been observed between %TOC and benthic biodiversity (Snelgrove and Butman 1994; Snelgrove et al. 1996). %TOC is often inversely correlated with grain size (Mayer 1994; Keil et al. 1997) because ~99% of sedimentary OM occurs in fine fractions as discontinuous blebs on clay surfaces (Ransom et al. 1997). A practical approach to comparing OM concentrations between samples with different textures is to normalise against SSA, which determines the abundance of OM-binding sites. ‘Typical’ coastal, shelf and upper slope sediments have OM loadings of 0.5–1.1 mg TOC m–2 (Hedges and Keil 1995). When used in conjunction, δ13C values and C : N ratios of OM can provide information about the sources (Meyers 1997). Planktonic OM typically has C : N ratios of 5–10 and δ13C values ranging from –17 to –22‰, whereas fresh terrestrial OM usually has C : N ratios >20 and δ13C signatures ranging from –14 to –26‰ (Burdige 2006). The δ15N values of marine sedimentary OM provide insights into N sources and cycling, and generally range from ~2.5 to 16.6‰ (Tesdal et al. 2013).

|
The need for lability indicators arises from the notion that bulk OM concentrations (e.g. %TOC) reveal little about OM quality (e.g. bioavailability). Organic matter quality pertains to the degradability of OM (e.g. living biomass, plant and animal detritus and black carbon) and pigments (Danovaro et al. 1995; Tselepides et al. 2000), and reflects the propensity of sedimentary OM towards mineralisation (e.g. OM breakdown to produce CO2, H2O and nutrients; Schubert et al. 2005). Reactivity is a function of the degree of alteration (or freshness) because the availability of OM for further microbial degradation decreases with ongoing decomposition (Schubert et al. 2005). Fresh OM has degradation rates that are more than an order of magnitude higher than those of refractory OM (4 days–0.33 years v. 1–440 years; Stephens et al. 1997) and is considered more important in benthic metabolism (Ferguson et al. 2003) and invertebrate nutrition (Danovaro et al. 1995).
Study areas
Geological context
There were nine surveys across eight study areas (Fig. 1). The study areas represent a diverse set of climatic and geological conditions, and spanned water depths from ~20 to ~5000 m (Table 3). The Western Timor Sea (WTS), Eastern Timor Sea (ETS) and Joseph Bonaparte Gulf (JBG) study areas are situated in water depths of <200 m within the Joseph Bonaparte Gulf proper, where the climate is tropical monsoonal. The Joseph Bonaparte Gulf proper is a large, semi-enclosed basin (i.e. the Bonaparte Basin) that was affected by eustatic changes in sea level during the Mid- to Late Quaternary (Yokoyama et al. 2000; Nicholas et al. 2015) and has acted as a trap for fine sediments of terrestrial riverine origin since the Paleozoic (Gunn 1988). The WTS study area in the north-western part of the basin comprises several banks and intervening soft sediment plains, which are situated within the Oceanic Shoals Commonwealth Marine Reserve (Nichol et al. 2013). The ETS has a complex seabed geomorphology with the carbonate banks, ridges and valleys of the Van Diemen Rise and Beagle Gulf and intervening soft sediment plains (Heap et al. 2010; Anderson et al. 2011). The JBG study area is situated in a low-relief paleo estuarine-to-deltaic setting that was formed when sea levels were low to transgressive (post Last Glacial Maximum; Nicholas et al. 2014, 2015). The region is currently described as a sediment-starved shelf because it experiences little modern day sedimentation (Van Andel and Veevers 1967), hence paleo estuarine-to-deltaic geomorphic features are well preserved at the seabed. Seabeds of the WTS, ETS and JBG are noted for extensive pockmark fields (Heap et al. 2009; Nichol et al. 2013; Nicholas et al. 2014), which arise due to gas and fluid expulsion caused by the degradation of buried OM. Taraxerol was detected in JBG seabed sediments, which suggests that at least some of the OM was derived from mangroves that were buried during the post-glacial sea level rise (Nicholas et al. 2015).

|

|
The remaining six study areas were in open shelf and slope regions. The Caswell Sub-basin (CSB) area is situated at water depths of 83–448 m along the northern continental shelf and slope, offshore from the Kimberley coast and downslope from the Yampi Shelf, which is noted for active hydrocarbon seepage (Rollet et al. 2006). The survey locations lie between the shallow water areas, including Scott Reef, Ashmore and Cartier Islands and Heywood Shoals (Howard et al. 2016). The Leveque Shelf (LS), which is also situated in the northern continental margin, is a carbonate-dominated shelf (>50%) with low-stand valleys, terraces and seabed plains that were affected by Late Quaternary sea level changes (Picard et al. 2014). The samples collected at this location were from water depths that ranged from 46 to 98 m. In the modern context, terrestrial sediment supply to the shelf is nearly zero. Radiocarbon-dated bivalves and solitary corals from this location point to significant reworking of early and mid-Holocene biogenic carbonates within the veneer that overlies carbonate rock (Nicholas et al. 2016).
The Western Australian Margin (WAM) study area pertains to seabeds overlying a broad sweep of continental margin inclusive of the Wallaby Plateau, Houtman Sub-basin and Zeewick Sub-basin (Daniell et al. 2010) in climatic regimes that range from marginal warm temperate to subtropical. The sediment samples from this survey were deposited well below the storm wave base (from 900 to ~4000 m) in relatively quiescent settings. Sediment samples from the North Perth Basin (NPB) survey were collected from water depths of 40–992 m inclusive of the shelf and slope. The Rottnest Shelf (RS) area refers to two survey areas situated to the north and south of Rottnest Island, offshore from Perth, in water depths that ranged from 34 to 125 m (Nicholas et al. 2012; Borissova et al. 2015). Fields of sand waves were common in water depths of ~34–50 m, and rhodoliths and their fragments were abundant in the recovered samples. The large grain sizes reflect the high energy, open oceanic carbonate setting and the absence of terrestrially derived material.
The Lord Howe Rise (LHR) is an elongate continental fragment some 1600 km long and 400–500 km wide composed of several basins and blocks that became separated from the Australian continent due to rifting and sea floor spreading during the Cretaceous (Willcox et al. 1980; Crawford et al. 2003; Bryan et al. 2012). Two areas were surveyed: one was situated over the Capel and Faust Basins, and the other comprised the seabed of the Gifford Guyot seamount (Heap et al. 2009). Pelagic carbonate ooze, which was >70% CaCO3 and composed of skeletal planktonic and benthic microfauna, was abundant throughout the regions. A range of geomorphologies was observed, such as dewatering polygonal cracks, plains and volcanic peaks (Nichol et al. 2011).
Oceanography
The West Australian shelf is affected by tropical currents. The south-east Indian Ocean between the north-west coast of Australia and the Indonesian Archipelago is termed the Indo-Australian Basin. The Indonesian Throughflow (ITF), which flows through the Indonesian Seas towards northern Australia, allows for the interoceanic exchange between the Pacific and Indian oceans (Wijffels et al. 2002). This is a region of intense summer rainfall, significant terrestrial run-off and some of the lightest (warm and fresh = low density) seawater on the planet (Durack and Wijffels 2010). Two tropical water sources, one from the equatorial Indian Ocean, via the South Java Current, and the other from the equatorial Pacific Ocean, via the ITF, join the westward flow of the South Equatorial Current in the top 100 m of the Indo-Australian Basin (Domingues et al. 2007). The South Equatorial Current retroflects into the Eastern Gyral Current and expands into the pole-ward flowing eastern boundary flow of the Leeuwin Current. Unlike other eastern boundary currents, such as the productive Humboldt and Benguela currents, the Leeuwin Current is a warm, downwelling boundary current, which suppresses wind-driven upwelling and pelagic productivity of the west coast of Australia (Feng et al. 2009). In the north-west, productivity is strongly influenced by modest upwelling associated with the El Niño–Southern Oscillation (ENSO) and a positive phase of the Indian Ocean dipole (Currie et al. 2013) producing considerable interannual variability (Furnas 2007; Rousseaux et al. 2012). Productivity is quite low on the mid-west coast (Waite et al. 2007a; Lourey et al. 2013) and increases within warm core eddies (Thompson et al. 2007).
The east Australia coastline is influenced by the East Australian Current (EAC), which is the western boundary current of the South Pacific subtropical gyre (Ridgway and Dunn 2003). This western boundary current carries warm, salty and low-nutrient water south along the east coast of Australia between ~15 and 31°S (Mata et al. 2000). The more productive regions of Australia’s Exclusive Economic Zone (EEZ) include the northern continental shelves along the Gulf of Carpentaria and around to the Kimberley (Condie and Dunn 2006; Furnas and Carpenter 2016). The Leeuwin Current and the EAC have generally lower levels of productivity (Hanson et al. 2005; Thompson et al. 2011a; Everett and Doblin 2015), despite the existence of hot spots (Rossi et al. 2014; Brieva et al. 2015). The more productive regions of Australia’s EEZ include the northern continental shelves along the Gulf of Carpentaria and around to the Kimberley (Rothlisberg et al. 1994). However, chlorophyll-a (Chl-a) concentrations estimated from satellites can be locally increased due to the migration of eddies, and these concentrations are generally higher than surrounding waters in autumn and winter (Huang and Feng 2015). In the regions of relatively high surface Chl-a, nitrate levels are typically zero (Thompson et al. 2011b). In both boundary currents, surface nitrate concentrations are generally below 0.5 μmol L–1 in summer and the mean (±s.d.) NO3– : PO43– ratio is ~4 ± 2. This is far below the Redfield ratio (Redfield 1958), indicating strong nitrate limitation for primary production (Thompson et al. 2009; Raes et al. 2015).
Materials and methods
Field and laboratory
Samples of seafloor sediment were collected using Smith-McIntyre grabs (maximum surface area 0.1 m2), Shipek grabs (maximum surface area 0.042 m2) or two sizes of box cores (maximum surface areas 0.02 and 0.25 m2) depending on the grain size characteristics of the seabed environments. Information on the methods used to extract the sediments from the sea floor is reported on a station-by-station basis with the individual datasets (see reference list in the Supplementary material). From a single sample of recovered seabed, subsamples were extracted using cut off 20-mL Terumo syringes that were inserted to depths of 2 cm and then put into containers that were designated for the following analyses: (1) chlorin analyses; (2) TSM and solid-phase organic and inorganic elements; and (3) SOD. Samples for grain size (and infauna) were also taken from collocated sediment grab samples and are described herein. The field and laboratory methods undertaken on Subsamples 1–3 and grain size are summarised in Table 4, and described in detail in Radke et al. (2015). The upper 2 cm of sediment was the focus of our investigation because, at least in the deep sea, 80% of organisms live in this horizon (Pfannkuche and Thiel 1987). Moreover, this is the approximate depth horizon of many GA samples used to populate the Marine Sediments (MARS) database (see http://dbforms.ga.gov.au/pls/www/npm.mars.search). At a more limited number of stations during some surveys (due to logistical constraints), core barrels were also pushed into the sediment surfaces to extract sediment for core incubation experiments. Different experimental set-ups were used for core incubations undertaken in surveys before 2010 (LHR and WAM) and after 2011 (WTS, LS and CSB), as described below.

|
LHR and WAM
Sediment cores (and overlying water) were collected by hand-pushing 84-mm diameter polyvinyl chloride (PVC) tubes into the surface of a box core sample. Once in the sediment, the core liners were sealed at the bottom with plastic plugs fitted with O-rings. Respective sediment depths and water heights of 120–210 and 60–95 mm (LHR) and 0.14–0.19 and 0.7–0.125 m (WAM) were obtained in the core barrels. Gas-tight lids fitted with O-rings were used to seal the top of each core barrel after an initial preincubation period of 4–6 h. The lids were fitted on the underside with magnetic stirrers that rotated (~20 rpm) when a second magnet situated on top of the lid was driven by a small motor. The motor was situated centrally between four cores in a Waeco portable fridge, which was used as the incubator. The cores were incubated in the dark and at near in situ temperatures for ~3 days (LHR; 3–4°C) and 1.1–2.5 days (WAM; 2–3°C). Dissolved oxygen concentrations of the water overlying the sediment cores were measured at approximately 4-h intervals using a HACH HQ40D meter and LDO Intellical probes. The probes passed through the O-ring-sealed holes in the core lids and were held in the incubation water for the duration of the incubation. The accuracy of the probes wasn ±0.1 mg L–1 for oxygen concentrations over the range 0–8 mg L–1. Triplicate samples for dissolved inorganic carbon (DIC) were collected at the beginning and end of the incubations. The DIC samples were filtered through 0.45-μm disposable filters into 3-mL gas-tight containers Exetainer’s (Labco) that had been precharged with 0.025 mL of saturated mercuric chloride solution (to poison the samples). The DIC samples were stored in the refrigerator until analysis.
WTS, LS and CSB
Two cylindrical cores of sediment were extracted from Smith-McIntyre grabs, Shipek grabs or box cores by hand-pushing polycarbonate tubes (~180 mm long, 45 mm in diameter) into the captured sediment. The core barrels were sealed at the bottom using 30 mm long plugs that were fitted with two o-rings. The sediment–water interfaces of the sediment cores were pumped to a height of 8 cm from the top of the polycarbonate cylinders using a caulking gun. The empty space above the sediment was gently filled with seawater that had been filtered to 0.2 μm. The volume of the incubating water in each core was ~118 mL after emplacement of lids and magnetic stirring devices. The cores were placed in an incubation chamber filled with filtered seawater (0.2 μm). The chamber was made of black Perspex, and was 385 mm wide, 410 mm long and 335 mm deep. The chamber was subdivided into four separate compartments, each of which had a separate lid and space for four cores. Throughout the experiment, aquarium pumps circulated water around the chamber through openings near the base of the compartments. After an initial equilibration period of 3 h, gas-tight fitted lids were applied to the core barrels and the incubations were initiated. Cores were incubated in the dark for ~4 h at ~25°C. The lids were fitted on the undersides with Presens oxygen sensor spots (PreSens Precision Sensing GmbH, Regensburg, Germany). Oxygen measurements were taken at ~30-min intervals for 4 h by applying Sensor Type PSt3 (PreSens Precision Sensing GmbH), which was connected by polymer optical fibre to a fibre oxygen transmitter (Fibrox 3, PreSens Precision Sensing GmbH), to a purpose-built indentation in the lid adjacent to the sensor spot. Prior to the survey, the sensors were calibrated using sodium sulphite solution (~0.2 M) for the zero point and air saturated with water for 100% O2. The accuracy of the measurements was ±0.4% at 20.9% O2. Duplicate samples for DIC were taken at the beginning and end of each incubation experiment by the methods described above. As samples were withdrawn, they were replaced with an equivalent amount of incubator water.
DIC concentrations were determined using an AS-C3 DIC analyser (Apollo SciTech) with an infrared-based CO2 detector (Li-Cor 7000) at GA using certified reference material for oceanic CO2 measurements as a standard (Scripps Institute of Oceanography; Batch 97). Oxygen and total carbon dioxide (TCO2) fluxes were calculated from the slopes of the linear regressions against time.
Data analysis
Upper water column particulate organic carbon (POC) and Chl-a were estimated for each station from Moderate Resolution Imaging Spectroradiometer (MODIS) Aqua satellite images (Table 3). These MODIS images have a spatial resolution of ~1 km and were processed using NASA’s SeaDas software. The Stramski algorithm was used for POC (Stramski et al. 2008). The Stramski POC algorithm has reasonably good performance from oligotrophic (Case 1) waters to eutrophic coastal upwelling areas (Case 2 waters; Stramski et al. 2008). The POC concentrations were extracted from all the available data, which included 36 monthly images from January 2009 to December 2011. To obtain statistics for global POC, we averaged the monthly Aqua MODIS POC imageries, with a spatial resolution of ~4 km, between January 2009 and December 2011 downloaded from the NASA’s website (http://oceancolor.gsfc.nasa.gov/cgi/browse.pl, accessed 5 November 2015). For Chl-a, the processing algorithm was the Ocean Chlorophyll 3 (OC3) algorithm (O’Reilly et al. 1998). The OC3 Chl-a algorithm was designed for Case 1 waters and is not accurate for Case 2 waters. Case 2 waters usually only occur in very limited coastal areas on the Australian continental shelf, including some embayments and estuaries (Lee and Hu 2006; Matsushita et al. 2012). However, waters in parts of the Joseph Bonaparte Gulf proper can be classified as Case 2 in the Australian winter. The Chl-a concentrations were extracted from 83 monthly images (October 2007 to August 2014) comprising the total time period of all the surveys (Table 1). Similarly, the global statistics for Chl-a were obtained from the temporal average of the monthly Aqua MODIS Chl-a images (OC3 algorithm) between October 2007 and August 2014 (which is the range of dates of the surveys).
The parameters (Table 5) all had unequal variances and were not always normally distributed. Moreover, there were different sample sizes among the regions. Therefore a Kruskal–Wallis rank sum test was used to compare differences in the means of the variables among regions and for multiple comparisons. All tests were implemented in R, ver. 3.1.0 (R Foundation for Statistical Computing, Vienna, Austria). Principal components analyses (PCA) were undertaken on the data using the computer software program STATISTICA (Release 12) (StatSoft, Tulsa, OK, USA) to identify significant relationships among and major gradients in organic and some inorganic elemental constituents of the sediment matrix. Individual elements were tested for normality and were log or square root transformed to approximate normality as required. Two correlation matrices (product–moment correlations) of selected variables were also undertaken in STATISTICA (Release 12) comprising the complete data matrix and one in which the semi-enclosed shelf sediments were removed (JBG, ETS, WTS). Relationships were otherwise explored using box-and-whisker diagrams and two-way scatterplots.

|
Results
Grain size and mineralogy
The mineralogical composition and texture of the sediments are summarised in Fig. 2 and Table 3. WTS sediments ranged in composition from silica (SiO2) dominated to calcium carbonate (CaCO3) dominated, and are noted for high concentrations of Al. Sediment textures were predominantly muddy sandy gravel, gravelly muddy sands or muds. The ETS sediments ranged from siliclastics to carbonates, but were predominantly gravelly muddy sands in texture. The sediment found in the JBG region was uniformly gravelly muddy sands containing <50% CaCO3. CSB seabed sediment samples were primarily carbonates (>85%) that fell into gravelly muddy sand textural classes. LS sediments were dominated by carbonate gravelly sands. WAM sediments were predominantly mud and sandy mud in texture. NPB shelf sediments consisted of slightly gravelly sand, whereas those from the slope were composed of slightly gravelly sandy mud. Samples from the slope had higher proportions of silt and fine sand than those on the shelf. RS sediments were predominantly carbonates and textures were either gravelly sands or sandy gravels. Carbonate sandy muds were found across the LHR region.

|
Organic carbon, C : N ratios and δ13C and δ15N values
TOC concentrations ranged from 0.02 to 2% (Fig. 3a). The medians of almost half the samples were below the lower quartile (0.34) of a large global dataset (Seiter et al. 2004). Regionally, the %TOC was greater in WTS sediments than in any other sample location (Kruskal–Wallis one-way analysis of variance (ANOVA) on ranks, P ≤ 0.05). The 25th percentile range of the WTS region exceeded the 75th percentile range of all other regions (Fig. 3a). The single highest TOC concentration, 2.9%, was observed at a depth of 1982 m in WAM. This sample (considered an outlier and not shown) also had the lowest carbonate concentration in the dataset (2.3%), and presumably was collected from below the carbonate compensation depth. The median %TOC values of sediments from JBG, LS, CSB and RS were all below the lower quartile of the global dataset.

|
A review by Burdige (2006) found five broad groups of OC : SA loadings on particles in marine sediments, and these are all evident in the Australian dataset (Fig. 4a). These concentrations ranged from 0.1 to 12.6 mg m–2 (Fig. 3b). Sediments with the lowest OM loadings were found in JBG, with concentrations lower than all other regions except CSB and WAM (Kruskal–Wallis one-way ANOVA on ranks, P ≤ 0.05). The highest OM loadings were found in RS samples, although the distributions were not significantly different from those of the ETS and NPB. WTS, LS and NPB sediments had OC : SA loadings in a range considered normal for continental shelf sediments (Hedges and Keil 1995). There was a general trend of increasing OC : SA loadings with higher MODIS POC (R2 = 0.03, P = 0.004) and Chl-a concentrations (R2 = 0.01, P = 0.029; Fig. 4b, c).

|
The δ13C values and C : N ratios ranged from –17.3 to –25.5‰ (Fig. 3c) and from 5.5 to 15.8 (Fig. 3d) respectively and were generally consistent with marine phytoplankton (Fig. 5a). The highest C : N ratios occurred in the CSB, RS, JBG, NPB and LS sediments, although there was overlap with other regions (Table 5). Lowest C : N ratios occurred in the deep ocean sediments of the LHR and WAM. The LHR samples were also generally more enriched in 13C relative to the other samples, although not significantly different from LS and WAM. The total nitrogen (TN) concentrations were consistent with the normal range for marine sediments (<0.03–1.2%; Burdige 2007; Table 5; Fig. 3e). TN was tightly coupled (R2 = 0.98) with TOC, with a slope that corresponded to a molar C : N ratio of 7.69 (Fig. 5b). Largest y-intercepts in the TN–TOC couplet were evident in LHR, JBG and WAM sediments (Fig. 5b).

|
The δ15N values of sedimentary OM had a wide range (1.7–11) and showed considerable interregional variability (Fig. 3f). The samples from around Australia had a median δ15N value of 5.93 (n = 359), whereas the global dataset (Tesdal et al. 2013) had a significantly greater mean value of 6.58 (Kruskal–Wallis one-way ANOVA on ranks, P < 0.001; n = 2176). Regions with median values that lay outside the global 25th–75th percentile range included WTS and JBG (lower) and WAM and LHR (higher). However, ETS had some of the lowest δ15N values in the dataset. Indeed, the WTS and LHR had the lowest and highest values respectively. There was a distinctive spatial pattern in the isotope signatures, with values <6‰ occurring at latitudes of ~12 to 13°S, and higher values elsewhere (Fig. 5c). The δ15N values and Fe described a negative exponential relationship (δ15N = 7.885e(–0.0000262×Fe), R2 = 0.29, P < 0.0001) across all data, and the R2 of this relationship was improved (0.36) if the outlying sample from WAM (6A) was excluded from the analysis. There was an inverse linear relationship between δ15N values and Fe in WTS and ETS samples, and the slope of the decline of δ15N with Fe was steeper in ETS sediments (Fig. 5d).
Organic matter reactivity
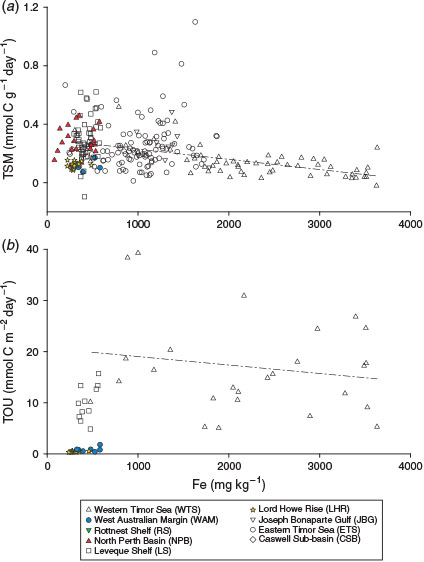
TOU and TSM fluxes ranged from 0.1 to 39.4 mmol m–2 day–1 and from <0.0 to 0.004 mmol g–1 day–1 respectively. These fluxes were generally highest in WTS and lowest in WAM and LHR. The reaction rate coefficient of TSM (kTSM) values ranged from <0.01 to 3.7 day–1 and were significantly higher in CSB and LS than in all other regions (except NPB and JBG). SOD and normalised SOD (nSOD) fluxes ranged from <0.001 to 0.006 mmol g–1 day–1 and from <1.0 to 129 mmol g–1 day–1 respectively. ETS SODs were higher than those of all other regions except JBG, and the lowest SODs occurred in the NPB. There was considerable overlap in the distribution of SOD in all other regions. Samples from WTS, NPB had lower nSODs than samples from CSB, LS, ETS and JBG. RS samples fit into both groups. Chlorin indices covered the known spectrum from 0.2 to 1.0 and were highest (lowest reactivity) in WAM, LHR, WTS and JBG sediments and lowest (highest reactivity) in NPB and RS sediments. There were no statistically significant differences in the distribution CIs among JBG, ETS, LS, CSB and NPB sediments. Reactive chlorin concentrations ranged from <0.1 to 6.6 µg g–1. Median concentrations were highest in RS sediments, although the concentrations were not significantly different from those in CSB and WTS sediments. Lowest concentrations occurred in LHR and WAM sediments.
With the exception of the kTSM and nSOD, the OM quality indicators were significantly correlated with water depth, and the strongest relationship was with TOU (Table 6; Fig. 6). The depth distribution of our ex situ TOU fluxes was generally consistent with that of a global dataset (Fig. 5a). Over all sites, there was an exponential rise in TOU as depth decreased (Fig. 6a). The r-values describing the depth-related trends in CIs, TRC, TSM, kTSM and TOU were larger when the open shelf and slope sediments (e.g. CSB, LHR, NPB, RS and WAM) were considered independent of samples from the semi-enclosed Joseph Bonaparte Gulf (WTS, ETS and JBG). The correlations between the pigment measures (CIs and TRC) and MODIS variables were also stronger.

|

|
Principal components analysis
The first four combined PCA axes explained ~72% of the variance in the dataset (Table 7). Al, Fe, %TOC and percentage total nitrogen (%TN) were inversely correlated with kTSM and δ15N on Axis 1 (PCA-1), which accounted for 32.8% of the variance. This axis clearly delineates samples from the Joseph Bonaparte Gulf (WTS, JBG and ETS) from the other sediments on the basis of these higher element concentrations and lower δ15N values (Fig. 7a). Axis 2 (PCA-2) explained 15.6% of the variance and captured the depth–degradability relationships evident in Fig. 6 (Fig. 7b). The pigment indicators TRC and CIs figured most prominently on this axis. Highest loadings for SODs and nSODs occurred on Factor 3 (12.7%), whereas those for OC : SA and TSM were on Factor 4.

|

|
Discussion
Organic carbon
The recent samples from around Australia had a median %TOC of only 0.3%, less than half the global median (0.62%; Seiter et al. 2004), highlighting that most Australian seabed sediments are very low in OM by global standards (Fig. 3a). A global map of %TOC shows highest concentrations along most western continental margins (North and South America and Africa), where upwelling is known to be intense, and lowest concentrations in open ocean (pelagic) settings and around the whole of Australia (Seiter et al. 2004). Thus, in broad terms, the global %TOC distribution reflects ocean and shelf productivity patterns that are often oligotrophic around Australia (Longhurst et al. 1995; Behrenfeld et al. 2005; Everett and Doblin 2015). The oligotrophy of Australian shelf and ocean waters is due, in part, to current patterns that direct nutrient-poor waters southwards from the tropics and subtropics and supress upwelling along the western coast (for a review, see Hobday et al. 2006), although sporadic upwelling events occur (Rossi et al. 2013a). Australia also has a high proportion of nutrient-poor soils (Orians and Milewski 2007) and highly variable rainfall, which means that there is little input of nutrients from terrestrial sources. Indeed, global modelling studies suggest that the continental export of all forms of nutrients is lowest in Australia (Seitzinger and Harrison 2005), with the exception of JBG river catchments, which are recognised as small global hot spots in the river yields of POC, as well as particulate N and phosphorus (Seitzinger and Harrison 2005). Consistently, the WTS sediments derived from these catchments (mainly during Last Glacial Maximum to early Holocene times; ~20–8 ka; (Yokoyama et al. 2001) had the highest %TOC in the dataset (Fig. 3a). The high %TOC is linked to elevated Al (Table 5), and thus clay concentrations, as evidenced by large negative site scores for WTS sediments on PCA-1 (Fig. 7a; Table 7). Despite the elevated %TOC, WTS samples varied around the expected values of riverine suspended sediments (0.7 mg TOC m–2) when TOC was normalised against SSA (Fig. 4a). Indeed, ~40% of samples in the overall dataset were in the typical shelf range when normalised against SSA (Fig. 3b). Therefore, the generally low %TOC of Australian marine sediments reflects the predominance of coarse grain sizes (Fig. 2b), as well as seawater oligotrophy.
SSA normalisation of TOC confirmed that ~40% of samples, across the full range of SSAs, were OM lean (Fig. 3b). Indeed, at least 25% of samples from each region had OC : SA ratios that were below the typical range (<0.5 mg TOC m–2; Fig. 4b, c). The correlation between OC : SA and MODIS parameters (Fig. 4b) highlights a direct relationship between the OC : SA ratios and water column productivity that is probably due to variations in the POM flux to the sea floor. Deficiencies with the application of the OC3 Chl-a algorithm in the Case 2 waters (see ‘Materials and methods’ section) may explain why the correlation between OC : SA and MODIS POC was slightly better than the correlation between OC : SA and MODIS Chl-a. Correlations between MODIS-based parameters and %TOC were not significant (see Fig. S1 available as Supplementary material to this paper) due the reliance of %TOC on clay concentrations (e.g. %TOC = 1.7 × Al + 0.17; R2 = 0.53, P < 0.001). Notwithstanding, the pattern of decapod species richness along the west to north-west coast of Australia (McCallum et al. 2013) was consistent with spatial variability in %TOC reported herein.
Extremely low OC : SA loadings, similar to those commonly observed in deltaic or open ocean settings (e.g. ~0.15 mg TOC m–2; Burdige 2006), were observed in the majority of samples from JBG, WAM and CSB (Fig. 4a). Very low phytoplankton biomass likely explains the low OC : SA loadings in CSB sediments (Fig. 4b, c). The low OC : SA of JBG sediments may be due to long oxygen exposure times (Hartnett et al. 1998) that were initially caused by deltaic processes (e.g. reworking causing re-exposure to oxygenated waters; Burdige 2005) during times of lower sea levels, but are now due to extended periods of containment at the sediment–water interface because of a lack of modern sedimentation. The WAM comprised deep ocean sediments and thus the usual range of hypotheses can be raised to explain the low concentrations observed there, such as low productivity and lengthy sedimentations due to deep water columns, low accumulation rates, deep O2 penetration into sediments and long O2 exposure times (Hedges and Oades 1997).
Particle loadings >2 mg TOC m–2 are suggestive of large OM loadings that can be indicative of high water column productivity, bottom waters that are low in oxygen or both (Burdige 2006). Large OM loadings in shallow RS (and likewise shallow NPB) sediments may reflect the widespread occurrence of benthic microalgal films that were observed in the area in towed video (Nicholas et al. 2012) and sediment samples. Benthic Chl-a was ~80 mg m–2 at 8 m (Forehead and Thompson 2010), falling to <10 mg m–2 at 80 m (P. Thompson, pers. obs.). Further analysis showed the pigments were >40% fucoxanthin (mostly diatoms) and actively photosynthesising during daylight (Forehead and Thompson 2010). Excess OM was also observed in some ETS sediments found on banks within the euphotic zone (<60 m) and regionally high β-diversity of infauna was observed at these depths (Radke et al. 2015). Higher than monolayer-equivalent loadings can also occur in course sediment fractions (<3 m2 g–1) due to the occurrence of discrete OM debris (Keil et al. 1994). This was likely the case in outer shelf channel and scree sediments in the ETS (Fig. 4b), where subsurface gas efflux apparently facilitates the upward translocation of buried intertidal sediment with abundant discrete plant debris in the process of pockmark formation (Radke et al. 2015). Surface water column POC concentrations (MODIS estimated) higher than the 75th percentile of the global range also accounts for some of the ‘excess’ OM we observed in ETS sediments (Fig. 4b, c).
C : N ratios and δ13C and δ15N values
TN and TOC were tightly coupled in the dataset with a slope that corresponded to a C : N ratio of 7.81 (Fig. 5b), which lies between the Redfield ratio for planktonic OM (6.6; Redfield 1958) and most C : N ratios from surface sediments in open ocean settings (e.g. 8–12; for a review, see Burdige 2006). Indeed, most C : N ratios and δ13C values were consistent with the normal range of fresh to degraded marine plankton (5–12; Emery and Uchupy 1984), although with the potential for terrestrial soil inputs at some sites (Burdige 2006). The mean (±s.d) value of –19.8 ± 0.7‰ was quite low, suggesting the plankton may have been mostly diatoms (Fry and Wainright 1991). In the ETS, C : N ratios <7 were attributed to the occurrence of highly labile OM resulting from benthic production on carbonate banks that were situated within the euphotic zone (<60 m; Radke et al. 2015). Given the low proportion of reactive chlorins and the water depths >1000m (Fig. 6f), the C : N ratios of 5–7 in LHR and WAM sediments probably do not indicate the occurrence of fresh planktonic OM. Instead, the large y-intercepts in the linear regression equation describing the relationships between TN and TOC in LHR and WAM sediments point to the occurrence of inorganic N that is not coupled to TOC (Fig. 5b). Indeed, inorganic N concentrations (likely NH4+ fixed on clays) are often substantial in organic-poor sediments such as these (Schubert and Calvert 2001).
Organic-poor deep-sea sediments are also frequently enriched in δ15N (by 1–5‰) relative to sinking particles (Robinson et al. 2012). This enrichment may be due to the preferential remineralisation of low δ15N amino acids and the retention of high δ15N amino acids (Tesdal et al. 2013). Consistently, organic-poor sediments from the LHR and WAM had δ15N values that were considerably elevated for the dataset and were higher than the upper quartile of the global dataset (Fig. 3f). Low oxygen zones are a feature of the Indian Ocean north-west of Australia (Stramma et al. 2010; Thompson et al. 2011b; Rossi et al. 2013b) and may contribute to the anomalously high δ15N values in WAM sediments at ~25°S (e.g. Voss et al. 2001) where the mean (±s.d.) background isotopic composition of subeuphotic nitrate is typically 6.6 ± 0.7‰ (Waite et al. 2007b, 2013). The δ15N values of sinking fluxes are often equal to the isotopic composition of subeuphotic nitrate that is supplied to the euphotic zone by mixing or upwelling assuming nitrate is fully utilised (Galbraith et al. 2008; Robinson et al. 2012; Tesdal et al. 2013).
Large differences between the δ15N values of subeuphotic nitrate and diazotrophic biomass can provide a useful metric for assessing the regional importance of N2 fixation to OM exported to the seabed. Diazotrophic biomass typically has δ15N values ranging from –1 to –2‰ (Montoya 2007), whereas the mean global isotopic signature of subeuphotic nitrate is ~5‰ (Sigman et al. 1997). Our application of the isotopic mixing model of Montoya et al. (2002) using 5 (global mean) and 6.6 (regional mean for Western Australia) as inputs for subeuphotic nitrate (Waite et al. 2013) and –1.6 as the input for Trichodesmium (Raes et al. 2014) suggests that diazotrophic biomass could contribute up to 50% of the N in sedimentary OM pools at latitudes from 11 to 13°S, coincident with the sharp decline in δ15N values in WTS, ETS and JBG sediments. Although pelagic N2 fixation can be important further south (e.g. Raes et al. 2014), it did not make a significant contribution to the benthic OM at other locations in the present dataset. The apparently low diazotrophic input into open-shelf sedimentary OM (RS, WAM, LS, NPB, LHR and CSB) is matched by its clear lack of transfer into mesozooplankton in these regions (Raes et al. 2014). This may imply that unicellular N2-fixing cyanobacteria are rare or recycled within the upper layers of the water column (as proposed by Raes et al. 2014), whereas the export flux is dominated by rapidly sinking faecal pellets derived by mesozooplankton. As reviewed by Montoya (2007), faecal material typically has δ15N values similar to or slightly higher than their food source, which is postulated to be mostly microplankton (diatoms and dinoflagellates) across this region (Raes et al. 2014).
Relative to global values, δ15N values were low in Timor Sea datasets from the Joseph Bonaparte Gulf (ETS, JBG and WTS), suggesting a high component of diazotrophic N. This may be due, in part, to the widespread occurrence of Trichodesmium, because such colonies contribute an estimated 50% to the N of POM in the region (Drexel 2007). Furthermore: (1) a diazotrophic community shift from unicellular forms towards Trichodesmium was noted in the Timor Sea in a dataset that had significant coverage in western and northern Australia (Raes et al. 2014); and (2) the δ15N values of ETS, JBG and WTS sediments are in the range of those from other tropical Australian seabeds during a Trichodesmium bloom (e.g. 2.4–3.7‰; Burford et al. 2009). Trichodesmium and faecal pellets from grazers such as Macrosettela (O’Neil and Roman 1994; O’Neil et al. 1996) enable fixed N to be exported to the seabed with the OM flux.
Trichodesmium have a high metabolic requirement for Fe (Richier et al. 2012) and are actively able to dissolve it from oxides and dust by cell-surface processes (Rubin et al. 2011). Iron is most likely derived from dust over most of the study areas (Jickells et al. 2005; Mackie et al. 2008; Radke et al. 2011b). The hyperbolic relationship of δ15N with Fe (Fig. 5d) suggests a limit on N2 fixation by Trichodesmium when Fe supply is insufficient to contribute ~5000 mg kg–1 to sediment pools. Indeed, the inflection in the δ15N data towards lower values (less than ~6‰) at ~5000 mg Fe kg–1 (Fig. 5d) may mark a predominant source change for terrestrial elements from dust to rivers. This change is clearly evident on PCA-1, where it separates sediments from the Joseph Bonaparte Gulf (WTS, ETS, JBG) from those of open-shelf regions on the basis of higher Al and Fe concentrations and lower δ15N values (Fig. 7a; Table 7). In the WTS, currents exceed the threshold speed for mean grain size ~50% of the time (Porter-Smith et al. 2004). Therefore, iron-rich particles of riverine origin could be resuspended from the sea floor and captured by Trichodesmium filaments in the water column, potentially giving rise to diazotrophic N signals and the inverse correlation between Fe (and Al) and δ15N (Fig. 5d; Table 7). However, at least in the WTS, the potential for a terrestrial OM contribution to the low δ15N values cannot be discounted because many δ13C values and C : N ratios are consistent with a soil source for the OM (Fig. 5a). Moreover, the δ15N signatures of WTS sediments decline gradually to ~4‰, not <0‰ as in Trichodesmium, over the range of measured Fe concentrations (Fig. 5d). By comparison, the relationship between δ15N and Fe concentrations in the ETS is sharper and tends towards lower δ15N values, and may thus reflect more of a diazotrophic N signal than a soil signal.
OM reactivity
At regional scales, the reactivity of sedimentary OM tends to vary inversely with water depth (Arndt et al. 2013), reflecting the amount of degradation in the water column (Niggemann et al. 2007). Such degradability–depth relationships often break down at global scales (Arndt et al. 2013) but in situ TOU rates show this trend (Fig. 6a; Glud 2008). In most open shelf sediments, water column alteration affects the composition of OM freshness parameters in the ways we expect: with increasing water depth, CIs generally increase and the magnitudes of TRC, SOD, TOU and TSM decrease (Fig. 6; Table 6). These changes with water depth are captured on PCA-2 (Fig. 6b) and constitute a major source of variation in the data (Table 7). Significant correlations between TRC and the mineralisation rate indicators (TOU and TSM) suggest that rates of OM degradation are often a function of the quantity of labile pigments (Table 6). Likewise, the significant correlations between CIs and kTSM indicate that quality changes in bulk OM pools are often related to quality changes in sedimentary pigments. The diversity of Lebensspuren was positively correlated with the CIs of the LHR and WAM datasets (Przeslawski et al. 2012), which have notably low levels of reactive OM. Indeed, the preservation of such an abundant and diverse suite of clearly defined invertebrate tracks and traces in these deep-sea sediments probably reflects low overall levels of biological activity on the assumption that extensive bioturbation would obliterate the distinctiveness of the track morphologies. The expected trend of increasing C : N ratios with water depth (Fig. 6g) was not observed due to the incorporation of inorganic N in organic-poor deep-sea sediments (discussed previously). Similarly, SOD and nSOD did not correlate well with PCA-2 (OM lability), suggesting that this parameter better reflects chemical oxygen demand than OM lability in this dataset (Fig. 6c, d).
The organic-rich sediments of the RS and NPB were a regional hot spot for pigment lability indicators due to the abundance of microphytobenthos on the shallow euphotic seafloors (Fig. 3l, m). The CSB sediments also stand out as having elevated labile OM concentrations, as evidenced by TOU, SOD, nSOD, TRC and kTSM that were high relative to the water depths (Fig. 6). Because laboratory-based core incubation experiments tend to underestimate TOU by a factor of two to three compared with fluxes measured at the seabed (Glud 2008), in situ TOU in these sediments may be considerably elevated relative to global rates. The occurrence of high-quality OM in CSB sediments, which are predominantly sandy, occurs despite low decadal MODIS-based water column Chl-a and POC concentrations and OC : SA ratios indicative of OM poor sediments (Fig. 4b, c). However, water column chlorophyll profiles in the nearby Sahul Shelf have mid-water maxima that would not be captured by satellite observations (McKinnon et al. 2011). Hence, the comparisons with satellite data may not be appropriate in this region. Likewise, intermittent high productivity events caused by physical forcing are known to occur in the region (e.g. McKinnon et al. 2011; Rossi et al. 2013a, 2014). The Sahul Shoals, located to the east of the CSB stations at water depths of 30–40 m, are also a potential source of highly labile OM to the CSB sediments that is derived from benthic production. The Shoals have been likened to virtual oases because the TOU rates measured there are quite elevated (73–173 mmol m–2 day–1; D. Alongi, pers. comm.). It is possible that labile materials shed from these reefs move westward in currents that are not strong enough to mix regenerated metabolites into the surface layer of the ocean. These results support the view of Boudreau et al. (2001) that sandy continental shelf sediments such as these may support higher levels of OM remineralisation than previously thought.
Sediments from the Joseph Bonaparte Gulf proper (JBG, ETS and WTS) had wide ranges for most of the OM quality parameters (Fig. 3) and a lack of relationship with water depth (Fig. 6), which was due to several factors. First, banks and terraces rise tens of metres above soft sediment plains and valleys in the region, bringing parts of the sea floor into contact with the euphotic zone (<60 m) where they can form habitats that are suitable for microphytobenthos, which are a source of labile OM (Radke et al. 2015). Second, there was a wide spectrum of water column productivities (MODIS POC) across the region (Fig. 4b, c), which, due to the shallow water columns, input varying amounts of labile OM into seabed sediments. Third, the sediments are highly reworked and contain abundant sediment-bound refractory TOC in the clay fractions, which dilutes the labile OM (Fig. 7a; Table 7). Recent studies have shown that clays can even bind reactive OM (including chlorins; Niggemann et al. 2007) and shield it from degradation under anaerobic conditions (Kennedy and Wagner 2011; Lalonde et al. 2012; Barber et al. 2014). The WTS TSM results are a case in point because these rates varied inversely with Fe (Fig. 8). The TSM rates were determined on vials that were completely filled with sediment and capped, and thus were more likely affected by anoxia than TOU determined from core incubation sediments, which did not vary with Fe.
|
Summary and conclusions
The sediment surveys presented herein revealed considerable spatial heterogeneity in the concentrations of sedimentary OM that support benthic biodiversity in Australia’s marine jurisdiction. Australian marine sediments had %TOC concentrations that were low by global standards, reflecting seawater oligotrophy and the predominance of coarse grain sizes (Fig. 2b). The OC : SA ratios were positively correlated with MODIS-estimated POC and Chl-a, highlighting a direct connection between surface area-normalised sedimentary TOC concentrations and water column productivity. Approximately 40% of samples had OC : SA ratios that were below the typical shelf range (<0.5 mg TOC m–2), and these were spread across the study areas, reflecting the generally low standing stocks of phytoplankton and the low pelagic productivity of the Australian EEZ. Organic-rich sediments occurred where MODIS-estimated water column POC and Chl-a concentrations were relatively high (ETS), where light conditions and substrates were suitable for benthic algal growth (ETS, RS, NPB) and in areas underlain by paleo-intertidal sediments in which discrete OM can be brought to the surface through the process of pockmark formation (ETS).
The higher δ15N of sedimentary OM in the south-west samples supports the contention that fixed N is recycled within the water column at higher western latitudes (Raes et al. 2014). Similarly, the δ15N of sedimentary OM at 11–13°S independently confirms that N2 fixation is able to produce up to 50% of POM at these northern latitudes (Raes et al. 2014). Moreover, the strong link to Fe concentrations is consistent with the physiology of N2 fixation.
In open shelf and slope areas (CSB, LHR, RS, NPB, WAM), most parameters used to describe OM freshness varied with water depth due to the alteration of pigments during transit through water columns. In comparison, input of fine-grained terrestrial sediment was a major control on freshness of sedimentary OM pools in some semi-enclosed Joseph Bonaparte Gulf (WTS, ETS, JBG) samples owing mainly to dilution caused by the admixture of these highly reworked sediments with bound refractory OM. Hot spots of OM lability coincided with benthic algal production in euphotic organic-rich RS and ETS sediments, and likely with lateral inputs of labile OM, which was also likely derived from benthic production, in subeuphotic organic-poor CSB sediments.
In conclusion, the collection of ‘baseline’ biogeochemical datasets during Federal Government surveys has redressed some major regional and global data gaps and led to the generation of knowledge about marine processes that support benthic diversity in Australia’s marine jurisdiction. The biogeochemistry of benthic sediments in Australia’s marine jurisdiction is broadly coupled to water column productivity and food chains. These new data provide opportunities to improve deterministic models of biogeochemical cycling and statistical models of benthic biodiversity.
Supplementary material
A full list of data publications from the surveys (Table 1) with links to the individual datasets is provided in the Supplementary material. Fig. S1 is a plot showing %TOC v. (a) MODIS POC and (b) Chl-a. The Supplementary material is available from the journal online.
Acknowledgements
This paper is a contribution to the Marine Biodiversity Hub, a collaborative partnership supported by funding from the Australian Government’s National Environmental Science Program. The various people who crewed the research vessels and provided laboratory and field assistance are too numerous to mention, but are gratefully acknowledged in the post-survey reports (see Table 1) or are co-authors in the data publications cited in the reference list in the Supplementary material. Thanks to R. Glud for providing the global TOU dataset, Theo Chiotis for drafting the figures and the Australian Institute of Marine Science (AIMS) at the Arafura Timor Sea Research Facility (ATRF) in Darwin (NT, Australia) for providing office facilities; this paper was written while Lynda Radke was on placement there. The paper was improved thanks to constructive reviews by Brendan Brooke, Nic Bax and two anonymous reviewers. This manuscript is published with permission of the CEO, Geoscience Australia.
References
Anderson, T. J., Nichol, S., Radke, L., Heap, A. D., Battershill, C., Hughes, M., Siwabessy, P. J., Barrie, V., Alvarez de Glasby, B., Tran, M., and Daniell, J. and Shipboard Party (2011). Seabed environments of the eastern Joseph Bonaparte Gulf, northern Australia: GA0325/Sol5117 – Post-survey report. Geoscience Australia Record 2011/08, Geoscience Australia, Canberra, ACT, Australia.Arndt, S., Jørgesen, B. B., LaRowe, D. E., Middleburg, J. J., Pancost, R. D., and Regnier, P. (2013). Quantifying the degradation of organic matter in marine sediments: a review and synthesis. Earth-Science Reviews 123, 53–86.
| Quantifying the degradation of organic matter in marine sediments: a review and synthesis.Crossref | GoogleScholarGoogle Scholar | 1:CAS:528:DC%2BC3sXptFOns78%3D&md5=db0302966a39f8175218f50a6a32172aCAS |
Bacon, M. P., Belastock, R. A., and Bothner, M. H. (1994). 210Pb balance and implications for particle transport on the continental shelf, US Middle Atlantic Bight. Deep-sea Research – II. Topical Studies in Oceanography 41, 511–535.
| 210Pb balance and implications for particle transport on the continental shelf, US Middle Atlantic Bight.Crossref | GoogleScholarGoogle Scholar | 1:CAS:528:DyaK2MXjsVCrs7w%3D&md5=a292a28cee1b0438653930479922ac68CAS |
Barber, A., Lalonde, K., Mucci, A., and Gélinas, Y. (2014). The role of iron in the diagenesis of organic carbon and nitrogen in sediments: a long-term incubation experiment. Marine Chemistry 162, 1–9.
| The role of iron in the diagenesis of organic carbon and nitrogen in sediments: a long-term incubation experiment.Crossref | GoogleScholarGoogle Scholar | 1:CAS:528:DC%2BC2cXmsVKmt7w%3D&md5=0492d58034c3dc2bef06248114765fe9CAS |
Bax, N. J., Cleary, J., Donnelly, B., Dunn, D. C., Dunstan, P. K., Fuller, M., and Halpin, P. N. (2016). Results of efforts by the Convention on Biological Diversity to describe ecologically or biologically significant marine areas. Conservation Biology 30, 571–581.
| Results of efforts by the Convention on Biological Diversity to describe ecologically or biologically significant marine areas.Crossref | GoogleScholarGoogle Scholar |
Behrenfeld, M. J., Boss, E., Siegel, D. A., and Shea, D. M. (2005). Carbon-based ocean productivity and phytoplankton physiology from space. Global Biogeochemical Cycles 19, GB1006.
| Carbon-based ocean productivity and phytoplankton physiology from space.Crossref | GoogleScholarGoogle Scholar |
Borissova, I., Lech, M. E., Jorgensen, D. C., Southby, C., Wang, L., Bernardel, G., Nicholas, W. A., Lescinsky, D. L., and Johnston, S. (2015). An integrated study of the CO2 storage potential in the offshore Vlaming Sub-Basin: results of the study undertaken as part of the NCIP program. Geoscience Australia Record 2015/09, Geoscience Australia, Canberra, ACT, Australia
Boudreau, B. P., Huettel, M., Forster, S., Jahnke, R. A., McLachlan, A., Middelburg, J. J., Nielsen, P., Sansone, F., Taghon, G., Van Raaphorst, W., Webster, I., Marcin, J., Wiberg, P., and Sundby, B. (2001). Permeable marine sediments: overturning an old paradigm. Eos, Transactions, American Geophysical Union 82, 133–136.
Brieva, D., Ribbe, J., and Lemckert, C. (2015). Is the East Australian Current causing a marine ecological hot-spot and important fisheries near Fraser Island, Australia? Estuarine, Coastal and Shelf Science 153, 121–134.
| Is the East Australian Current causing a marine ecological hot-spot and important fisheries near Fraser Island, Australia?Crossref | GoogleScholarGoogle Scholar | 1:CAS:528:DC%2BC2MXkvF2ksQ%3D%3D&md5=a5a1193fe76df01ef6e6ca467a99702cCAS |
Bryan, S. E., Cook, A., Allen, C. M., Siegel, C., Purdy, D., Greentree, J., and Uysal, T. (2012). Early–mid Cretaceous tectonic evolution of eastern Gondwana: from silicic LIP magmatism to continental rupture. Episodes 35, 142–152.
Burdige, D. J. (2005). Burial of terrestrial organic matter in marine sediments: a re-assessment. Global Biogeochemical Cycles 19, GB4011.
| Burial of terrestrial organic matter in marine sediments: a re-assessment.Crossref | GoogleScholarGoogle Scholar |
Burdige, D. J. (2006). ‘Geochemistry of Marine Sediments.’ (Princeton University Press: Princeton, NJ, USA).
Burdige, D. J. (2007). Preservation of organic matter in marine sediments: Controls, mechanisms and an imbalance in sediment organic carbon budgets. Chemical Reviews 107, 467–485.
| Preservation of organic matter in marine sediments: Controls, mechanisms and an imbalance in sediment organic carbon budgets.Crossref | GoogleScholarGoogle Scholar | 1:CAS:528:DC%2BD2sXot1WmtQ%3D%3D&md5=08efd1e1bc4e28a0a4453c37da191608CAS |
Burford, M. A., Rothlisberg, P., and Revill, A. T. (2009). Sources of nutrients driving production in the Gulf of Carpentaria, Australia: a shallow tropical shelf system. Marine and Freshwater Research 60, 1044–1053.
| Sources of nutrients driving production in the Gulf of Carpentaria, Australia: a shallow tropical shelf system.Crossref | GoogleScholarGoogle Scholar | 1:CAS:528:DC%2BD1MXht1ymtLnI&md5=b71d00abbd06aaec8fb3361dd0d710d8CAS |
Carroll, A. G., Jorgensen, D. C., Siwabessy, P. J. W., Jones, L. E. A., Sexton, M. J., Tran, M., Nicholas, W. A., Radke, L. C., Carey, M. P., Howard, F. J. F., Stowar, M. J., Heyward, A. J., and Potter, A. and Shipboard Party (2012). Seabed environments and shallow geology of the Petrel Sub-Basin, northern Australia: SOL5463 (GA0335) – Post survey report. Geoscience Australia Record 2012/66, Geoscience Australia, Canberra, ACT, Australia.
Commonwealth of Australia (2002). ‘Tasmanian Seamounts Marine Reserve Management Plan.’ (Environment Australia: Canberra, ACT, Australia.)
Condie, S. A., and Dunn, J. R. (2006). Seasonal characteristics of the surface mixed layer in the Australasian region: implications for primary production regimes and biogeography. Marine and Freshwater Research 57, 569–590.
| Seasonal characteristics of the surface mixed layer in the Australasian region: implications for primary production regimes and biogeography.Crossref | GoogleScholarGoogle Scholar | 1:CAS:528:DC%2BD28XovVeksr8%3D&md5=819ffc304649e658ea2a0b039a04c8f5CAS |
Crawford, A. J., Meffre, S., and Symonds, P. A. (2003). 120 to 0 Ma tectonic evolution of the southwest Pacific and analogous geological evolution of the 600 to 220 Tasman Fold Belt System. Geological Society of Australia Special Publication 22, 377–397.
Currie, J. C., Lengaigne, M., Vialard, J., Kaplan, D. M., Aumont, O., Naqvi, S. W. A., and Maury, O. (2013). Indian Ocean Dipole and El Niño/Southern Oscillation impacts on regional chlorophyll anomalies in the Indian Ocean. Biogeosciences 10, 6677–6698.
| Indian Ocean Dipole and El Niño/Southern Oscillation impacts on regional chlorophyll anomalies in the Indian Ocean.Crossref | GoogleScholarGoogle Scholar | 1:CAS:528:DC%2BC2cXntVals78%3D&md5=1124c0eccec9e29effb3b67ca29c2a7aCAS |
Daniell, J., Jorgensen, D.C., Anderson, T., Borissova, I., Burq, S., Heap, A.D., Hughes, M., Mantle, D., Nelson, G., Nichol, S., Nicholson, C., Payne, D., Przeslawski, R., Radke, L., Siwabessy, J., Smith, C., and Shipboard Party (2010). Frontier basins of the West Australian Continental Margin: Post-survey report of marine reconnaissance and geological sampling survey GA2476. Geoscience Australia Record 2009/38, Geoscience Australia, Canberra, ACT, Australia.
Danovaro, R., Della Croce, N., Eleftheriou, A., Fabiano, M., Papadopoulou, N., Smith, C., and Tselepides, A. (1995). Meiofauna of the deep Eastern Mediterranean Sea: distribution and abundance in relation to bacterial biomass, organic matter composition and other environmental factors. Progress in Oceanography 36, 329–341.
| Meiofauna of the deep Eastern Mediterranean Sea: distribution and abundance in relation to bacterial biomass, organic matter composition and other environmental factors.Crossref | GoogleScholarGoogle Scholar |
Domingues, C. M., Maltrud, M. E., Wijffels, S. E., Church, J. A., and Tomczak, M. (2007). Simulated Lagrangian pathways between the Leeuwin Current System and the upper-ocean circulation of the southeast Indian Ocean. Deep-sea Research – II. Topical Studies in Oceanography 54, 797–817.
| Simulated Lagrangian pathways between the Leeuwin Current System and the upper-ocean circulation of the southeast Indian Ocean.Crossref | GoogleScholarGoogle Scholar |
Drexel, J. P. (2007). Contribution of nitrogen fixation to planktonic food webs north of Australia. M.Sc. Thesis, Georgia Institute of Technology, Atlanta, GA, USA.
Durack, P. J., and Wijffels, S. E. (2010). Fifty-year trends in global ocean salinities and their relationship to broad-scale warming. Journal of Climate 23, 4342–4362.
| Fifty-year trends in global ocean salinities and their relationship to broad-scale warming.Crossref | GoogleScholarGoogle Scholar |
Dutkiewicz, A., Müller, R. D., O’Callaghan, S., and Jónasson, H. (2015). Census of seafloor sediments in the world’s ocean. Geology 43, 795.
| Census of seafloor sediments in the world’s ocean.Crossref | GoogleScholarGoogle Scholar | 1:CAS:528:DC%2BC2MXhs1Omu7zJ&md5=973af6e50e462989c25660ab7b313984CAS |
Emery, K. O., and Uchupy, E. (1984). ‘The Geology of the Atlantic Ocean.’ (Springer-Verlag: New York, NY, USA.)
Everett, J. D., and Doblin, M. A. (2015). Characterising primary productivity measurements across a dynamic western boundary current region. Deep-sea Research – I. Oceanographic Research Papers 100, 105–116.
| Characterising primary productivity measurements across a dynamic western boundary current region.Crossref | GoogleScholarGoogle Scholar | 1:CAS:528:DC%2BC2MXksFWhs78%3D&md5=710b3c8cda377103619bc66a7b85fc0bCAS |
Falkowski, P. (2012). Ocean science: the power of phytoplankton. Nature 483, S17–S20.
| Ocean science: the power of phytoplankton.Crossref | GoogleScholarGoogle Scholar | 1:CAS:528:DC%2BC38XivFygtrg%3D&md5=cfd8f90ecab183c5b074beb168fbe817CAS |
Feng, M., Waite, A. M., and Thompson, P. A. (2009). Climate variability and ocean production in the Leeuwin Current system off the west coast of Western Australia. Journal of the Royal Society of Western Australia 92, 67–81.
Ferguson, A. J. P., Eyre, B. D., and Gay, J. M. (2003). Organic matter and benthic metabolism in euphotic sediments along shallow sub-tropical estuaries, northern New South Wales, Australia. Aquatic Microbial Ecology 33, 137–154.
| Organic matter and benthic metabolism in euphotic sediments along shallow sub-tropical estuaries, northern New South Wales, Australia.Crossref | GoogleScholarGoogle Scholar |
Field, C. B., Behrenfeld, M. J., Randerson, J. T., and Falkowski, P. (1998). Primary production of the biosphere: integrating terrestrial and oceanic components. Science 281, 237–240.
| Primary production of the biosphere: integrating terrestrial and oceanic components.Crossref | GoogleScholarGoogle Scholar | 1:CAS:528:DyaK1cXksFKitb0%3D&md5=e69a1edb85a7d78208d3ef4cd3f6fac5CAS |
Folk, R. L. (1954). The distinction between grain size and mineral composition in sedimentary rock nomenclature. The Journal of Geology 62, 344–359.
| The distinction between grain size and mineral composition in sedimentary rock nomenclature.Crossref | GoogleScholarGoogle Scholar | 1:CAS:528:DyaG2cXmslyjtw%3D%3D&md5=b1c5a645c4e9e4cc68a6e80c0cb4bf08CAS |
Forehead, H. I., and Thompson, P. A. (2010). Microbial communities of subtidal shallow sandy sediments change with depth and wave disturbance, but nutrient exchanges remain similar. Marine Ecology Progress Series 414, 11–26.
| Microbial communities of subtidal shallow sandy sediments change with depth and wave disturbance, but nutrient exchanges remain similar.Crossref | GoogleScholarGoogle Scholar | 1:CAS:528:DC%2BC3cXhsVGms7fK&md5=65c3d59b6381344b9197e407092d0b05CAS |
Fry, B., and Wainright, S. C. (1991). Diatom sources of l3C-rich carbon in marine food webs. Marine Ecology Progress Series 76, 149–157.
| Diatom sources of l3C-rich carbon in marine food webs.Crossref | GoogleScholarGoogle Scholar |
Furnas, M. J. (2007). Intra-seasonal and inter-annual variations in phytoplankton biomass, primary production and bacterial production at North West Cape, Western Australia: links to the 1997–1998 El Niño event. Continental Shelf Research 27, 958–980.
| Intra-seasonal and inter-annual variations in phytoplankton biomass, primary production and bacterial production at North West Cape, Western Australia: links to the 1997–1998 El Niño event.Crossref | GoogleScholarGoogle Scholar |
Furnas, M. J., and Carpenter, E. J. (2016). Primary production in the tropical continental shelf seas bordering northern Australia. Continental Shelf Research 129, 33–48.
| Primary production in the tropical continental shelf seas bordering northern Australia.Crossref | GoogleScholarGoogle Scholar |
Galbraith, E. D., Sigman, R. S., Robinson, R. S., and Pederson, T. (2008). Nitrogen in past marine environments. In ‘Nitrogen in the Marine Environment’, 2nd edn. (Eds D. G. Capone, D. Bronk, M. R. Mulholland and E. Carpenter.) pp. 1497–1535. (Academic Press: Burlington, MA, USA.)
Glud, R. N. (2008). Oxygen dynamics of marine sediments. Marine Biology Research 4, 243–289.
| Oxygen dynamics of marine sediments.Crossref | GoogleScholarGoogle Scholar |
Gunn, P. J. (1988). Bonaparte Basin: evolution and structural framework. In ‘The North West Shelf, Australia, Proceedings of the Petroleum Exploration Society of Australia, Symposium 1988’. (Eds P. G. Purcell and R. R. Purcell.) pp. 275–285. (Petroleum Exploration Society of Australia: Perth, WA, Australia.)
Hanson, C. E., Pattiaratchi, C. B., and Waite, A. M. (2005). Seasonal productions regimes off south-western Australia: influence of the Capes and Leeuwin currents on phytoplankton dynamics. Marine and Freshwater Research 56, 1011–1026.
| Seasonal productions regimes off south-western Australia: influence of the Capes and Leeuwin currents on phytoplankton dynamics.Crossref | GoogleScholarGoogle Scholar |
Hartnett, H. E., Keil, R. G., Hedges, J. I., and Devol, A. (1998). Influence of oxygen exposure time on organic carbon preservation in continental margin sediments. Nature 391, 572–575.
| Influence of oxygen exposure time on organic carbon preservation in continental margin sediments.Crossref | GoogleScholarGoogle Scholar | 1:CAS:528:DyaK1cXhtVSntrg%3D&md5=11ae4ed8de53a83a483178272a3bb564CAS |
Heap, A. D., and Harris, P. T. (2008). Geomorphology of the Australian margin and adjacent seafloor. Australian Journal of Earth Sciences 55, 555–585.
| Geomorphology of the Australian margin and adjacent seafloor.Crossref | GoogleScholarGoogle Scholar |
Heap, A.D., Hughes, M., Anderson, T., Nichol, S., Hashimoto, T., Daniell, J., Przeslawski, R., Payne, D., Radke, L., and Shipboard Party (2009). Seabed environments and subsurface geology of the Capel and Faust basins and Gifford Guyot, eastern Australia – post survey report. Geoscience Australia Record 2009/22, Geoscience Australia, Canberra, ACT, Australia.
Heap, A. D., Przeslawski, R., Radke, L., Trafford, J., and Battershill, C. and Shipboard Party (2010). Seabed environments of the eastern Joseph Bonaparte Gulf, northern Australia: SOL4934 post survey report. Geoscience Australia Record 2010/09, Geoscience Australia, Canberra, ACT, Australia.
Hedges, J., and Keil, R. G. (1995). Sedimentary organic matter preservation: an assessment and speculative synthesis. Marine Chemistry 49, 81–115.
| Sedimentary organic matter preservation: an assessment and speculative synthesis.Crossref | GoogleScholarGoogle Scholar | 1:CAS:528:DyaK2MXmtVyqsb4%3D&md5=7bc416316d2d86c9af888cdffa12d44eCAS |
Hedges, J. I., and Oades, J. M. (1997). Comparative organic geochemistries of soils and marine sediments. Organic Geochemistry 27, 319–361.
| Comparative organic geochemistries of soils and marine sediments.Crossref | GoogleScholarGoogle Scholar | 1:CAS:528:DyaK1cXotVWrsA%3D%3D&md5=29f4f6f48fc79711832564c3221e9a15CAS |
Henrichs, S. M. (1992). Early diagenesis of organic matter in marine sediments: progress and perplexity. Marine Chemistry 39, 119–149.
| Early diagenesis of organic matter in marine sediments: progress and perplexity.Crossref | GoogleScholarGoogle Scholar | 1:CAS:528:DyaK38XmtlOhtrc%3D&md5=d9dba10545ba258ec9a49197b7ecc731CAS |
Herman, P. M. J., Middelburg, J., Van de Koppel, J., and Heip, C. H. R. (1999). Ecology of estuarine macrobenthos. Advances in Ecological Research 29, 195–240.
| Ecology of estuarine macrobenthos.Crossref | GoogleScholarGoogle Scholar |
Hobday, A. J., Okey, T. A., Poloczanska, E. S., Kunz, T. J., and Richardson, A. J. (2006). Impacts of climate change on Australian marine life: part A. Executive summary. Report to the Australian Greenhouse Office, Canberra, ACT, Australia.
Howard, F. J. F., Nicholson, C., Bernardel, G., Carroll, A. G., Grosjean, E., Hackney, R., Lech, M., Melrose, R., Nichol, S. L., Picard, K., Radke, L. C., Rollet, N., Romeyn, R., Siwabessy, P. J. W., and Trafford, J. (2016). A marine survey to investigate seal integrity between potential CO2 storage reservoirs and seafloor in the Caswell Sub-basin, Browse Basin, Western Australia: GA0345/GA0346/TAN1411 – post-survey report. Geoscience Australia Record 2016/05, Geoscience Australia, Canberra, ACT, Australia
Huang, Z., and Feng, M. (2015). Remotely sensed spatial and temporal variability of the Leeuwin Current using MODIS data. Remote Sensing of Environment 166, 214–232.
| Remotely sensed spatial and temporal variability of the Leeuwin Current using MODIS data.Crossref | GoogleScholarGoogle Scholar |
Huang, Z., McArthur, M., Radke, L., Anderson, T., Nichol, S., Siwabessy, J., and Brooke, B. (2012). Developing physical surrogates for benthic biodiversity using co-located samples and regression tree models: a conceptual synthesis for a sandy temperature embayment. International Journal of Geographical Information Science 26, 2141–2160.
| Developing physical surrogates for benthic biodiversity using co-located samples and regression tree models: a conceptual synthesis for a sandy temperature embayment.Crossref | GoogleScholarGoogle Scholar |
Jickells, T. D., An, Z. S., Andersen, K. K., Baker, A. R., Bergametti, G., Brooks, N., Cao, J. J., Boyd, P. W., Duce, R. A., Hunter, K. A., Kawahata, H., Kubilay, N., laRoche, J., Liss, P. S., Mahowald, N., Prospero, J. M., Ridgwell, A. J., Tegen, I., and Torres, R. (2005). Global iron connections between desert dust, ocean biogeochemistry, and climate. Science 308, 67–71.
| Global iron connections between desert dust, ocean biogeochemistry, and climate.Crossref | GoogleScholarGoogle Scholar | 1:CAS:528:DC%2BD2MXivVaqs7w%3D&md5=cb565cf7deb908bfaa727b588dce6dcfCAS |
Keil, R. G., Tsamakis, E., Bor Fuh, C., Giddings, J. C., and Hedges, J. I. (1994). Mineralogical and textural controls on the organic composition of coastal marine sediments: hydrodynamic separation using SPLITT-fractionation. Geochimica et Cosmochimica Acta 58, 879–893.
| Mineralogical and textural controls on the organic composition of coastal marine sediments: hydrodynamic separation using SPLITT-fractionation.Crossref | GoogleScholarGoogle Scholar | 1:CAS:528:DyaK2cXhs12ht70%3D&md5=6afc23aad2ca5edbd1e2d2475215bba9CAS |
Keil, R. G., Mayer, L. M., Quay, P. D., Richey, J. E., and Hedges, J. I. (1997). Loss of organic matter from riverine particles in deltas. Geochimica et Cosmochimica Acta 61, 1507–1511.
| Loss of organic matter from riverine particles in deltas.Crossref | GoogleScholarGoogle Scholar | 1:CAS:528:DyaK2sXivVShtb8%3D&md5=7bd16f4448fa3ec373de2ae1fb440020CAS |
Kennedy, M. J., and Wagner, T. (2011). Clay mineral continental amplifier for marine carbon sequestration in a greenhouse ocean. Proceedings of the National Academy of Sciences of the United States of America 108, 9776–9781.
| Clay mineral continental amplifier for marine carbon sequestration in a greenhouse ocean.Crossref | GoogleScholarGoogle Scholar | 1:CAS:528:DC%2BC3MXnvVOmsrY%3D&md5=fb24dd522941575e50a9f61d866420e9CAS |
Lalonde, K., Mucci, A., Ouellet, A., and Gélinas, Y. (2012). Preservation of organic matter in sediments promoted by iron. Nature 483, 198–200.
| Preservation of organic matter in sediments promoted by iron.Crossref | GoogleScholarGoogle Scholar | 1:CAS:528:DC%2BC38XjtlOqs7k%3D&md5=b498167ccf45674f33d63d4ce14b4891CAS |
Lee, Z. P., and Hu, C. (2006). Global distribution of Case-1 waters: an analysis from SeaWiFS measurements. Remote Sensing of Environment 101, 270–276.
| Global distribution of Case-1 waters: an analysis from SeaWiFS measurements.Crossref | GoogleScholarGoogle Scholar |
Longhurst, A., Sathyendranath, S., and Platt, T. A. (1995). An estimate of global primary production in the ocean from satellite radiometer data. Journal of Plankton Research 17, 1245–1271.
| An estimate of global primary production in the ocean from satellite radiometer data.Crossref | GoogleScholarGoogle Scholar |
Lourey, M. J., Thompson, P. A., McLaughlin, M. J., Bonham, P., and Feng, M. (2013). Primary production and phytoplankton community structure during a winter shelf-scale phytoplankton bloom off Western Australia. Marine Biology 160, 355–369.
| Primary production and phytoplankton community structure during a winter shelf-scale phytoplankton bloom off Western Australia.Crossref | GoogleScholarGoogle Scholar |
Lutz, M., Dunbar, R., and Caldeira, K. (2002). Regional variability in the vertical flux of particulate organic carbon in the ocean interior. Global Biogeochemical Cycles 16, 1037.
| Regional variability in the vertical flux of particulate organic carbon in the ocean interior.Crossref | GoogleScholarGoogle Scholar |
Mackie, D. S., Boyd, P. W., McTainsh, G. H., Tindale, N. W., Westberry, T. K., and Hunter, K. A. (2008). Biogeochemistry of iron in Australian dust: from eolian uplift to marine uptake. Geochemistry Geophysics Geosystems 9, –Q03Q08.
| Biogeochemistry of iron in Australian dust: from eolian uplift to marine uptake.Crossref | GoogleScholarGoogle Scholar | 1:CAS:528:DC%2BD1cXoslSntb4%3D&md5=55288b5a0ca57070efe6758e5842953dCAS |
Mata, M. M., Tomczak, M., Wijffels, S., and Church, J. A. (2000). East Australian Current volume transports at 30°S: estimates from the World Ocean Circulation Experiment hydrographic sections PR11/P6 and the PCM3 current meter array. Journal of Geophysical Research 105, 28509–28526.
| East Australian Current volume transports at 30°S: estimates from the World Ocean Circulation Experiment hydrographic sections PR11/P6 and the PCM3 current meter array.Crossref | GoogleScholarGoogle Scholar |
Matsushita, B., Yang, W., Chang, P., Yang, F., and Fukushima, T. (2012). A simple method for distinguishing global Case-1 and Case-2 waters using SeaWiFS measurements. ISPRS Journal of Photogrammetry and Remote Sensing 69, 74–87.
| A simple method for distinguishing global Case-1 and Case-2 waters using SeaWiFS measurements.Crossref | GoogleScholarGoogle Scholar |
Mayer, L. M. (1994). Surface area control of organic carbon accumulation incontinetal shelf sediments. Geochimica et Cosmochimica Acta 58, 1271–1284.
| Surface area control of organic carbon accumulation incontinetal shelf sediments.Crossref | GoogleScholarGoogle Scholar | 1:CAS:528:DyaK2cXislGktbs%3D&md5=241caacdaf79eb59c3e856fb87035ab2CAS |
McArthur, M. A., Brooke, B. P., Przeslawski, R., Ryan, D. A., Lucieer, V. L., Nichol, S., McCallum, A. W., Mellin, C., Cresswell, I. D., and Radke, L. C. (2010). On the use of abiotic surrogates to describe marine benthic biodiversity. Estuarine, Coastal and Shelf Science 88, 21–32.
| On the use of abiotic surrogates to describe marine benthic biodiversity.Crossref | GoogleScholarGoogle Scholar |
McCallum, A. W., Poore, G. C. B., Williams, A., Althaus, F., and O’Hara, T. (2013). Environmental predictors of decapod species richness and turnover along an extensive Australian continental margin (13–35°S). Marine Ecology 34, 298–312.
| Environmental predictors of decapod species richness and turnover along an extensive Australian continental margin (13–35°S).Crossref | GoogleScholarGoogle Scholar |
McCallum, A. W., Woolley, S., Błażewicz-Paszkowycz, M., Browne, J., Gerken, S., Kloser, R., Poore, G. C. B., Staples, D., Syme, A., Taylor, J., Walker-Smith, G., Williams, A., and Wilson, R. S. (2015). Productivity enhances benthic species richness along an oligotrophic Indian Ocean continental margin. Global Ecology and Biogeography 24, 462–471.
| Productivity enhances benthic species richness along an oligotrophic Indian Ocean continental margin.Crossref | GoogleScholarGoogle Scholar |
McKinnon, A. D., Carleton, J. H., and Duggan, S. (2011). Determinants of pelagic metabolism in the Timor Sea during the inter-monsoon period. Marine and Freshwater Research 62, 130–140.
| Determinants of pelagic metabolism in the Timor Sea during the inter-monsoon period.Crossref | GoogleScholarGoogle Scholar | 1:CAS:528:DC%2BC3MXitlejt7k%3D&md5=123c2558a586aecd660f7de6c6b77d6aCAS |
Meyers, P. A. (1997). Organic geochemical proxies of paleoceanographic, paleolimnologic and paleoclimatic processes. Organic Geochemistry 27, 213–250.
| Organic geochemical proxies of paleoceanographic, paleolimnologic and paleoclimatic processes.Crossref | GoogleScholarGoogle Scholar | 1:CAS:528:DyaK1cXotVequg%3D%3D&md5=1bc17b9f507b1f656fe699cd46905625CAS |
Montoya, J. P. (2007). Natural abundance of N15 in marine planktonic ecosystems. In ‘Stable Isotopes in Ecology and Environmental Science’. (Eds R. Mitchener and K. Lajtha.) pp. 176–201. (Blackwell Publishers: Boston, MA, USA.)
Montoya, J. P., Carpenter, E. J., and Capone, D. G. (2002). Nitrogen fixation and nitrogen isotope abundances in zooplankton of the oligotrophic North Atlantic. Limnology and Oceanography 47, 1617–1628.
| Nitrogen fixation and nitrogen isotope abundances in zooplankton of the oligotrophic North Atlantic.Crossref | GoogleScholarGoogle Scholar | 1:CAS:528:DC%2BD38Xps1Kqt7c%3D&md5=c2c19ef8a90f85d486e000549806ed65CAS |
Müller, G., and Gastner, M. (1971). The ‘Karonate-Bombe’ a simple device for the determination of the carbonate content in sediments, soils and other materials. Neues Jahrbuch für Mineralogie Monatshefte 10, 466–469.
Nichol, S. L., Heap, A. D., and Daniell, J. (2011). High resolution geomorphic map of a submerged marginal plateau, northern Lord Howe Rise, east Australian margin. Deep-sea Research – II. Topical Studies in Oceanography 58, 889–898.
| High resolution geomorphic map of a submerged marginal plateau, northern Lord Howe Rise, east Australian margin.Crossref | GoogleScholarGoogle Scholar |
Nichol, S. L., Howard, F. J. F., Kool, J., Stowar, M., Bouchet, P., Radke, L., Siwabessy, J., Przeslawski, R., Picard, K., Alvarez de Glasby, B., Colquhoun, J., Letessier, T., and Heyward, A. (2013). Oceanic Shoals Commonwealth Marine Reserve (Timor Sea) Biodiversity Survey: GA0339/SOL5650 – post survey report. Geoscience Australia Record 2013/38, Geoscience Australia, Canberra, ACT, Australia.
Nicholas, W. A., Borissova, I., Radke, L., Tran, M., Bernardel, G., Jorgensen, D. M., Siwabessy, J., Carroll, A., and Whiteway, T. (2012). Seabed environments and shallow geology of the Vlaming Sub-Basin, Western Australia – marine data for the investigation of the geological storage of CO2. GA0334 post-survey report. Geoscience Australia Record 2013/09, Geoscience Australia, Canberra, ACT, Australia.
Nicholas, W. A., Nichol, S. L., Howard, F. J. F., Picard, K., Dulfer, H., Radke, L. C., Carroll, A. G., Tran, M., and Siwabessy, P. J. W. (2014). Pockmark development in the Petrel Sub-basin, Timor Sea, northern Australia: seabed habitat mapping in support of CO2 storage assessments. Continental Shelf Research 83, 129–142.
| Pockmark development in the Petrel Sub-basin, Timor Sea, northern Australia: seabed habitat mapping in support of CO2 storage assessments.Crossref | GoogleScholarGoogle Scholar |
Nicholas, W. A., Carroll, A., Picard, K., Radke, L., Siwabessy, J., Howard, F. J. F., Dulfer, H., Tran, M., Consoli, C., Przeslawski, R., Li, J., and Jones, L. E. A. (2015). Seabed environments, shallow sub-surface geology and connectivity, Petrel Sub-basin, Bonaparte Basin, Timor Sea. Geoscience Australia Record 2015/24, Geoscience Australia, Canberra, ACT, Australia.
Nicholas, W. A., Carroll, A. G., Radke, L., Tran, M., Howard, F. J. F., Przeslawski, R., Chen, J., Siwabessy, P. J. W., and Nichol, S. L. (2016). Seabed environments and shallow geology of the Leveque Shelf, Browse Basin, Western Australia: GA0340 – interpretive report. Record 2016/18. Geoscience Australia, Canberra, ACT, Australia.
Niggemann, J., Ferdelman, T. G., Lomstein, B. A., Kallmeyer, J., and Schubert, C. J. (2007). How depositional conditions control input, composition and degradation or organic matter in sediments from the Chilean coastal upwelling region. Geochimica et Cosmochimica Acta 71, 1513–1527.
| How depositional conditions control input, composition and degradation or organic matter in sediments from the Chilean coastal upwelling region.Crossref | GoogleScholarGoogle Scholar | 1:CAS:528:DC%2BD2sXis1Gjs70%3D&md5=77427c1549e82c89e96397ac15f73e5dCAS |
O’Neil, J., and Roman, M. (1994). Ingestion of the cyanobacterium Trichodesmium spp. by pelagic harpacticoid copepods Macrosetella, Miracia and Oculosetella. Hydrobiologia 292, 235–240.
| Ingestion of the cyanobacterium Trichodesmium spp. by pelagic harpacticoid copepods Macrosetella, Miracia and Oculosetella.Crossref | GoogleScholarGoogle Scholar |
O’Neil, J., Metzler, P., and Glibert, P. (1996). Ingestion of 15N2-labelled Trichodesmium spp. and ammonium regeneration by the harpacticoid copepod Macrosetella gracilis. Marine Biology 125, 89–96.
| Ingestion of 15N2-labelled Trichodesmium spp. and ammonium regeneration by the harpacticoid copepod Macrosetella gracilis.Crossref | GoogleScholarGoogle Scholar | 1:CAS:528:DyaK28XislKgs70%3D&md5=5ab6c243dee7829ffcd418aca4288522CAS |
O’Reilly, J. E., Maritorena, S., Mitchell, B. G., Siegel, D. A., Carder, K. L., Garver, S. A., Kahru, M., and McClain, C. (1998). Ocean color algorithms for SeaWiFS. Journal of Geophysical Research 103, 24937–24953.
| Ocean color algorithms for SeaWiFS.Crossref | GoogleScholarGoogle Scholar | 1:CAS:528:DyaK1cXntVegsbg%3D&md5=e3f9a910e2e0ab43a68977e0d5542326CAS |
Orians, G. H., and Milewski, A. V. (2007). Ecology of Australia: the effect of nutrient-poor soils and intense fires. Biological Reviews of the Cambridge Philosophical Society 82, 393–423.
| Ecology of Australia: the effect of nutrient-poor soils and intense fires.Crossref | GoogleScholarGoogle Scholar |
Pfannkuche, O., and Thiel, H. (1987). Meiobenthic stocks and benthic activity on the NE-Svalbard Shelf and in the Nansen Basin. Polar Biology 7, 253–266.
| Meiobenthic stocks and benthic activity on the NE-Svalbard Shelf and in the Nansen Basin.Crossref | GoogleScholarGoogle Scholar |
Picard, K., Nichol, S. L., Hashimoto, R., Carroll, A. G., Bernardel, G., Jones, L. E. A., Siwabessy, P. J. W., Radke, L. C., Nicholas, W. A., Carey, M. C., Stowar, M., Howard, F. J. F., Tran, M., and Potter, A. (2014). Seabed environments and shallow geology of the Leveque Shelf, Browse Basin, Western Australia; GA0340/SOL5754 – Post-survey report. Geoscience Australia Record 2014/10, Geoscience Australia, Canberra, ACT, Australia.
Porter-Smith, R., Harris, P. T., Anderson, O. B., Coleman, R., Greenslade, D., and Jenkins, C. J. (2004). Classification of the Australian continental shelf based on predicted sediment threshold exceedance from tidal currents and swell waves. Marine Geology 211, 1–20.
| Classification of the Australian continental shelf based on predicted sediment threshold exceedance from tidal currents and swell waves.Crossref | GoogleScholarGoogle Scholar |
Przeslawski, R., Dundas, K., Radke, L., and Anderson, T. J. (2012). Deep-sea Lebensspuren of the Australian continental margins. Deep-sea Research – I. Oceanographic Research Papers 65, 26–35.
| Deep-sea Lebensspuren of the Australian continental margins.Crossref | GoogleScholarGoogle Scholar |
Radke, L. C., Huang, Z., Przeslawski, R., Webster, I. T., McArthur, M. A., Anderson, T. J., Siwabessy, P. J., and Brooke, B. (2011a). Including biogeochemical factors and a temporal component in benthic habitat maps: influences on infaunal diversity in a temperate embayment. Marine and Freshwater Research 62, 1432–1448.
| Including biogeochemical factors and a temporal component in benthic habitat maps: influences on infaunal diversity in a temperate embayment.Crossref | GoogleScholarGoogle Scholar | 1:CAS:528:DC%2BC3MXhsFCit7jM&md5=7b96927a77f860b105c6ae08f7907944CAS |
Radke, L. C., Heap, A. D., Douglas, G., Nichol, S., Trafford, J., Li, J., and Przeslawski, R. (2011b). A geochemical characterization of deep-sea floor sediments of the northern Lord Howe Rise. Deep-sea Research – II. Topical Studies in Oceanography 58, 909–921.
| A geochemical characterization of deep-sea floor sediments of the northern Lord Howe Rise.Crossref | GoogleScholarGoogle Scholar | 1:CAS:528:DC%2BC3MXjvFeju7s%3D&md5=0a82f17a0a2e976fd1015fcb37353e27CAS |
Radke, L. C., Li, J., Douglas, G., Przeslawski, R., Nicholl, S., Siwabessy, J., Huang, Z., Trafford, J., Watson, T., and Whiteway, T. (2015). Characterising sediments for a tropical sediment-starved shelf using cluster analysis of physical and geochemical variables. Environmental Chemistry 12, 204–226.
| Characterising sediments for a tropical sediment-starved shelf using cluster analysis of physical and geochemical variables.Crossref | GoogleScholarGoogle Scholar | 1:CAS:528:DC%2BC2MXltVWnu7o%3D&md5=c7daac94c17e407490844d7c14257f97CAS |
Raes, E. J., Waite, A. W., McInnes, A. S., Olsen, H., Nguyen, H. M., Hardman-Mountford, N., and Thompson, P. A. (2014). Changes in latitude and dominant diazotrophic community alter N2 fixation. Marine Ecology Progress Series 516, 85–102.
| Changes in latitude and dominant diazotrophic community alter N2 fixation.Crossref | GoogleScholarGoogle Scholar | 1:CAS:528:DC%2BC2MXisFaqtLk%3D&md5=ed4f11344a154cc503c98a9740852a11CAS |
Raes, E. J., Thompson, P. A., McInnes, A. S., Nguyen, H. M., Hardman‐Mountford, N., and Waite, A. M. (2015). Sources of new nitrogen in the Indian Ocean. Global Biogeochemical Cycles 29, 1283–1297.
| Sources of new nitrogen in the Indian Ocean.Crossref | GoogleScholarGoogle Scholar | 1:CAS:528:DC%2BC2MXhsVarurfL&md5=76dcdfa766b44adfc39c6362a711e608CAS |
Ransom, B., Bennet, R. H., Baerwald, R., and Shea, K. (1997). TEM study of in situ organic matter on continental margins: occurrence and the monolayer hypothesis. Marine Geology 138, 1–9.
| TEM study of in situ organic matter on continental margins: occurrence and the monolayer hypothesis.Crossref | GoogleScholarGoogle Scholar | 1:CAS:528:DyaK2sXjtlCnsbk%3D&md5=df9758c4aad7e5e424a2a1cdef99f591CAS |
Redfield, A. C. (1958). The biological control of chemical factors in the environment. American Scientist 46, 205–221.
| 1:CAS:528:DyaG1cXhtVCmtLg%3D&md5=b1b450b9f1de0c9e58bbc841a985a63bCAS |
Richier, S., Macey, A. I., Pratt, N. J., Honey, D. J., Moore, M., and Bibby, T. S. (2012). Abundances of iron-binding photosynthetic and nitrogen-fixing proteins of Trichodesmium both in culture and in situ from the North Atlantic. PLoS One 7, e35571.
| Abundances of iron-binding photosynthetic and nitrogen-fixing proteins of Trichodesmium both in culture and in situ from the North Atlantic.Crossref | GoogleScholarGoogle Scholar | 1:CAS:528:DC%2BC38XntVeks7g%3D&md5=51404ec8ddbab5d12e6c9a6dcd2eebefCAS |
Ridgway, K., and Dunn, J. (2003). Mesoscale structure of the mean East Australian Current System and its relationship with topography. Progress in Oceanography 56, 189–222.
| Mesoscale structure of the mean East Australian Current System and its relationship with topography.Crossref | GoogleScholarGoogle Scholar |
Robinson, R., Kienest, M., Albuquerque, A. L., Altabet, M., Contreras, S., De Pol Holz, R., Dubois, N., Francois, R., Galbraith, E., Hsu, T.-C., Ivanochko, T., Jaccard, S., Kao, S.-J., Kiefer, T., Kienast, S., Lehmann, M., Martinez, P., McCarthy, M., Möbius, J., Pederson, T., Quan, T. M., Ryabenko, M., Schmittner, A., Schneider, R., Schneider-Mor, A., Shigemitsu, M., Sinclair, D., Somes, C., Studer, A., Thunell, R., and Yang, J.-Y. (2012). A review of nitrogen isotope alteration in marine sediments. Paleoceanography 27, 1–13.
| A review of nitrogen isotope alteration in marine sediments.Crossref | GoogleScholarGoogle Scholar |
Rollet, N., Logan, G. A., Kennard, J. M., O’Brien, P., Jones, A., and Sexton, M. (2006). Characterisation and correlation of active hydrocarbon seepage using geophysical data sets: an example from the tropical, carbonate Yampi Shelf, Northwest Australia. Marine and Petroleum Geology 23, 145–164.
| Characterisation and correlation of active hydrocarbon seepage using geophysical data sets: an example from the tropical, carbonate Yampi Shelf, Northwest Australia.Crossref | GoogleScholarGoogle Scholar |
Rossi, V., Feng, M., Pattiaratchi, C., Roughan, M., and Waite, A. M. (2013a). On the factors influencing the development of sporadic upwelling in the Leeuwin Current system. Journal of Geophysical Research – Oceans 118, 3608–3621.
| On the factors influencing the development of sporadic upwelling in the Leeuwin Current system.Crossref | GoogleScholarGoogle Scholar |
Rossi, V., Feng, M., Pattiaratchi, C., Roughan, M., and Waite, A. M. (2013b). Linking synoptic forcing and local mesoscale processes with biological dynamics off Ningaloo Reef. Journal of Geophysical Research – Oceans 118, 1211–1225.
| Linking synoptic forcing and local mesoscale processes with biological dynamics off Ningaloo Reef.Crossref | GoogleScholarGoogle Scholar |
Rossi, V., Schaeffer, A., Wood, J., Galibert, G., Morris, B., Sudre, J., Roughan, M., and Waite, A. M. (2014). Seasonality of sporadic physical processes driving temperature and nutrient high-frequency variability in the coastal ocean off southeast Australia. Journal of Geophysical Research – Oceans 119, 445–460.
| Seasonality of sporadic physical processes driving temperature and nutrient high-frequency variability in the coastal ocean off southeast Australia.Crossref | GoogleScholarGoogle Scholar |
Rothlisberg, P., Pollard, P., Nichols, P., Moriarty, D., Forbes, A., Jackson, C., and Vaudrey, D. (1994). Phytoplankton community structure and productivity in relation to the hydrological regime of the Gulf of Carpentaria, Australia, in summer. Marine and Freshwater Research 45, 265–282.
| Phytoplankton community structure and productivity in relation to the hydrological regime of the Gulf of Carpentaria, Australia, in summer.Crossref | GoogleScholarGoogle Scholar |
Rousseaux, C. S. G., Lowe, R., Feng, M., Waite, A. M., and Thompson, P. A. (2012). The role of the Leeuwin Current and mixed layer depth on the autumn phytoplankton bloom off Ningaloo Reef, Western Australia. Continental Shelf Research 32, 22–35.
| The role of the Leeuwin Current and mixed layer depth on the autumn phytoplankton bloom off Ningaloo Reef, Western Australia.Crossref | GoogleScholarGoogle Scholar |
Rubin, M., Berman-Frank, I., and Shaked, Y. (2011). Dust- and mineral-iron utilization by the marine dinitrogen-fixer Trichodesmium. Nature Geoscience 4, 529–534.
| Dust- and mineral-iron utilization by the marine dinitrogen-fixer Trichodesmium.Crossref | GoogleScholarGoogle Scholar | 1:CAS:528:DC%2BC3MXpsFWlu70%3D&md5=90bc70c776449b8ab43be9def3d3e24aCAS |
Sabine, C. L., Feely, R. A., Gruber, N., Key, R. M., Lee, K., Bullister, J. L., Wanninkhof, R., Wong, C. S., Wallace, D. W. R., Tilbrook, B., Millero, F. J., Peng, T.-H., Kozyr, A., Ono, T., and Rios, A. F. (2004). The oceanic sink for anthropogenic CO2. Science 305, 367–371.
| The oceanic sink for anthropogenic CO2.Crossref | GoogleScholarGoogle Scholar | 1:CAS:528:DC%2BD2cXls1egsbc%3D&md5=18a42b95b4381f49452497386c6e9074CAS |
Schubert, C. J., and Calvert, S. E. (2001). Nitrogen and carbon isotopic composition of marine and terrestrial organic matter in Arctic Ocean sediments: implications for nutrient utilisation and organic matter composition. Deep-sea Research. – I. Oceanographic Research Papers 48, 789–810.
| Nitrogen and carbon isotopic composition of marine and terrestrial organic matter in Arctic Ocean sediments: implications for nutrient utilisation and organic matter composition.Crossref | GoogleScholarGoogle Scholar | 1:CAS:528:DC%2BD3cXptVWqsbk%3D&md5=306ca2b0cd1aacfb3132101a9cab0473CAS |
Schubert, C. J., Niggemann, J., Klockgether, G., and Ferdelman, G. (2005). Chlorin Index: a new parameter for organic matter freshness in sediment. Geochemistry Geophysics Geosystems 6, Q03005.
| Chlorin Index: a new parameter for organic matter freshness in sediment.Crossref | GoogleScholarGoogle Scholar |
Seiter, K., Hensen, C., Schroter, J., and Zabel, M. (2004). Organic carbon content in surface sediments – defining regional provinces. Deep-sea Research – I. Oceanographic Research Papers 51, 2001–2026.
| Organic carbon content in surface sediments – defining regional provinces.Crossref | GoogleScholarGoogle Scholar | 1:CAS:528:DC%2BD2cXhtVWgtLzN&md5=015f30c1de14c2106155d412aad7c2d3CAS |
Seiter, K., Hensen, C., and Zabel, M. (2005). Benthic carbon mineralisation on a global scale. Global Biogeochemical Cycles 19, 1–26.
| Benthic carbon mineralisation on a global scale.Crossref | GoogleScholarGoogle Scholar |
Seitzinger, S. P., and Harrison, J. A. (2005). Sources and delivery of carbon, nitrogen, and phosphorus to the coastal zone: an overview of global nutrient export from watershed (NEWS) models and their application. Global Biogeochemical Cycles 19, GB4S01.
| Sources and delivery of carbon, nitrogen, and phosphorus to the coastal zone: an overview of global nutrient export from watershed (NEWS) models and their application.Crossref | GoogleScholarGoogle Scholar |
Sigman, D. M., Altabet, M. A., Michener, R., McCorkle, D. C., Fry, B., and Holmes, R. M. (1997). Natural abundance-level measurement of the nitrogen isotopic composition of oceanic nitrate: an adaptation of the ammonia diffusion method. Marine Chemistry 57, 227–242.
| Natural abundance-level measurement of the nitrogen isotopic composition of oceanic nitrate: an adaptation of the ammonia diffusion method.Crossref | GoogleScholarGoogle Scholar | 1:CAS:528:DyaK2sXks12mtro%3D&md5=ec7518d3bf16951dd972b0ac98e201f0CAS |
Snelgrove, P. V. R., and Butman, C. A. (1994). Animal sediment relationships revisited: cause versus effect. Oceanography and Marine Biology – an Annual Review 32, 111–177.
Snelgrove, P. V. R., Grassle, J. F., and Petrecca, R. F. (1992). The role of food patches in maintaining high deep-sea diversity: field experiments with hydrodynamically unbiased colonization trays. Limnology and Oceanography 37, 1543–1550.
| The role of food patches in maintaining high deep-sea diversity: field experiments with hydrodynamically unbiased colonization trays.Crossref | GoogleScholarGoogle Scholar |
Snelgrove, P. V. R., Grassle, J. F., and Petrecca, R. F. (1996). Experimental evidence for aging food patches as a factor contributing to high deep-sea macrofaunal diversity. Limnology and Oceanography 41, 605–614.
| Experimental evidence for aging food patches as a factor contributing to high deep-sea macrofaunal diversity.Crossref | GoogleScholarGoogle Scholar |
Stephens, M. P., Kadko, D. C., Smith, C. R., and Latasa, M. (1997). Chlorophyll-a and pheopigments as tracers of labile organic carbon at the central equatorial Pacific seafloor. Geochimica et Cosmochimica Acta 61, 4605–4619.
| Chlorophyll-a and pheopigments as tracers of labile organic carbon at the central equatorial Pacific seafloor.Crossref | GoogleScholarGoogle Scholar | 1:CAS:528:DyaK1cXmsl2m&md5=511fc943420b095d8835a9f6eea4f9c2CAS |
Stramma, L., Schmidtko, S., Levin, L. A., and Johnson, G. C. (2010). Ocean oxygen minima expansions and their biological impacts. Deep-sea Research – I. Oceanographic Research Papers 57, 587–595.
| Ocean oxygen minima expansions and their biological impacts.Crossref | GoogleScholarGoogle Scholar | 1:CAS:528:DC%2BC3cXjvF2isrg%3D&md5=b3023a46aeb89d9d5b752aede562e7baCAS |
Stramski, D., Reynolds, R. A., Babin, M., Kaczmarek, S., Lewis, M. R., Rottgers, R., Sciandra, A., Stramska, M., Twardowski, M. S., Franz, B. A., and Claustre, H. (2008). Relationships between the surface concentration of particulate organic carbon and optical properties in the eastern South Pacific and eastern Atlantic Oceans. Biogeosciences 5, 171–201.
| Relationships between the surface concentration of particulate organic carbon and optical properties in the eastern South Pacific and eastern Atlantic Oceans.Crossref | GoogleScholarGoogle Scholar | 1:CAS:528:DC%2BD1cXhtF2iurbN&md5=2c499fbf461efff1a9b6f81514baa90dCAS |
Sundquist, E. T. (1985) Geological perspectives on carbon dioxide and the carbon cycle. In ‘The Carbon Cycle and Atmospheric CO: Natural Variations Archean to Present’. (Eds E. T. Sundquist and W. S. Broecker.) pp. 5–59. (American Geophysical Union: Washington, DC, USA.)
Symonds, P., Alcock, M., and French, C. (2009). Setting Australia’s limits: understanding Australia’s marine jurisdiction. AUSGEO News 93, 1–8.
Tesdal, J.-E., Galbraith, E. D., and Kienest, M. (2013). Nitrogen isotopes in bulk marine sediment: linking seafloor observations with subseafloor records. Biogeosciences 10, 101–118.
| Nitrogen isotopes in bulk marine sediment: linking seafloor observations with subseafloor records.Crossref | GoogleScholarGoogle Scholar |
Thompson, P. A., Pesant, S. A., and Waite, A. M. (2007). Contrasting the vertical differences in the phytoplankton biology of a warm core versus cold core eddy in the south-eastern Indian Ocean. Deep-sea Research – II. Topical Studies in Oceanography 54, 1003–1028.
| Contrasting the vertical differences in the phytoplankton biology of a warm core versus cold core eddy in the south-eastern Indian Ocean.Crossref | GoogleScholarGoogle Scholar |
Thompson, P., Baird, M., Ingleton, T., and Doblin, M. (2009). Long-term changes in temperate Australian coastal waters: implications for phytoplankton. Marine Ecology Progress Series 394, 1–19.
| Long-term changes in temperate Australian coastal waters: implications for phytoplankton.Crossref | GoogleScholarGoogle Scholar | 1:CAS:528:DC%2BC3cXotVOmtA%3D%3D&md5=47b1ffa17494f69bc28e2ba6952e8305CAS |
Thompson, P. A., Bonham, P., Waite, A. M., Clementson, L. A., Cherukuru, N., and Doblin, M. A. (2011a). Contrasting oceanographic conditions and phytoplankton communities on the east and west coasts of Australia. Deep-sea Research – II. Topical Studies in Oceanography 58, 645–663.
| Contrasting oceanographic conditions and phytoplankton communities on the east and west coasts of Australia.Crossref | GoogleScholarGoogle Scholar | 1:CAS:528:DC%2BC3MXit1aqsbo%3D&md5=b9dc33f4f4e213174dcb625a76f21c73CAS |
Thompson, P. A., Wild-Allen, K., Lourey, M., Rousseaux, C., Waite, A. M., Feng, M., and Beckley, L. E. (2011b). Nutrients in an oligotrophic boundary current: evidence of a new role for the Leeuwin Current. Progress in Oceanography 91, 345–359.
| Nutrients in an oligotrophic boundary current: evidence of a new role for the Leeuwin Current.Crossref | GoogleScholarGoogle Scholar |
Tittensor, D. P., Mora, C., Jetz, W., Lotze, H. K., Ricard, D., Vanden Berghe, E., and Worm, E. B. (2010). Global patterns and predictors of marine biodiversity across taxa. Nature 466, 1098–1101.
| Global patterns and predictors of marine biodiversity across taxa.Crossref | GoogleScholarGoogle Scholar | 1:CAS:528:DC%2BC3cXptl2rsrY%3D&md5=9a0188ec4a154c63ba7df413a834bfd1CAS |
Tselepides, A., Polychronaki, T., Marrale, D., Akoumianaki, I., Dell’Anno, A., Pusceddu, A., and Danavaro, R. (2000). Organic matter composition of the continental shelf and bathyal sediments of the Cretan Sea (NE Mediterranean). Progress in Oceanography 46, 311–344.
| Organic matter composition of the continental shelf and bathyal sediments of the Cretan Sea (NE Mediterranean).Crossref | GoogleScholarGoogle Scholar |
Van Andel, T. H., and Veevers, J. J. (1967). Morphology and sediments of the Timor Sea. Bureau of Mineral Resources, Geology and Geophysics Bulletin 83, Canberra, ACT, Australia.
Voss, M., Dippner, J. W., and Montoya, J. P. (2001). Nitrogen isotope patterns in the oxygen-deficient waters of the Eastern Tropical North Pacific Ocean. Deep-sea Research – I. Oceanographic Research Papers 48, 1905–1921.
| Nitrogen isotope patterns in the oxygen-deficient waters of the Eastern Tropical North Pacific Ocean.Crossref | GoogleScholarGoogle Scholar | 1:CAS:528:DC%2BD3MXkslSmsLs%3D&md5=9bda8a2f509fd921ac8a07bc760379e1CAS |
Waite, A. M., Pesant, S., Griffin, D. A., Thompson, P. A., and Holl, C. M. (2007a). Oceanography, primary production and dissolved inorganic nitrogen uptake in two Leeuwin Current eddies. Deep-sea Research – II. Topical Studies in Oceanography 54, 981–1002.
| Oceanography, primary production and dissolved inorganic nitrogen uptake in two Leeuwin Current eddies.Crossref | GoogleScholarGoogle Scholar |
Waite, A. M., Muhling, B. A., Holl, C. M., Beckley, L. E., Montoya, J. P., Strzelecki, J., Thompson, P. A., and Pesant, S. (2007b). Food web structure in two counter-rotating eddies based on δ15N and δ13C isotopic analysis. Deep-sea Research – II. Topical Studies in Oceanography 54, 1055–1075.
| Food web structure in two counter-rotating eddies based on δ15N and δ13C isotopic analysis.Crossref | GoogleScholarGoogle Scholar |
Waite, A. M., Rossi, V., Roughan, M., Tilbrook, B., Thompson, P. A., Feng, M., Wyatt, A. S. J., and Raes, E. J. (2013). Formation and maintenance of high-nitrate, low pH layers in the eastern Indian Ocean and the role of nitrogen fixation. Biogeosciences 10, 5691–5702.
| Formation and maintenance of high-nitrate, low pH layers in the eastern Indian Ocean and the role of nitrogen fixation.Crossref | GoogleScholarGoogle Scholar |
Wijffels, S., Sprintall, J., Fieux, M., and Bray, N. (2002). The JADE and WOCE I10/IR6 throughflow sections in the southeast Indian Ocean. Part 1: water mass distribution and variability. Deep-sea Research – II. Topical Studies in Oceanography 49, 1341–1362.
| The JADE and WOCE I10/IR6 throughflow sections in the southeast Indian Ocean. Part 1: water mass distribution and variability.Crossref | GoogleScholarGoogle Scholar |
Willcox, J. B., Symonds, P. A., Hinz, K., and Bennett, D. (1980). Lord Howe Rise, Tasman Sea – preliminary geophysical results and petroleum prospects. BMR Journal of Australian Geology and Geophysics 5, 225–226.
Wollast, R. (1991). The coastal organic carbon cycle: fluxes, sources, and sinks. In ‘Ocean Margin Processes in Global Change’. (Eds M. J. M. Mantoura and R. F. C. Wollast.) pp. 365–382. (Wiley: Chichester, UK.)
Yokoyama, Y., Lambeck, K., De Deckker, P., Johnston, P., and Fifield, K. (2000). Timing of the Last Glacial Maximum from observed sea-level minima. Nature 406, 713–716.
| Timing of the Last Glacial Maximum from observed sea-level minima.Crossref | GoogleScholarGoogle Scholar | 1:CAS:528:DC%2BD3cXmt1CgsLs%3D&md5=7a3ec91cc8450c1a74d27ebcb2c51ebfCAS |
Yokoyama, Y., De Deckker, P., Lambeck, K., Johnston, P., and Fifield, L. K. (2001). Sea-level at the Last Glacial Maximum: evidence from northwestern Australia to constrain ice volumes for oxygen isotope stage 2. Palaeogeography, Palaeoclimatology, Palaeoecology 165, 281–297.
| Sea-level at the Last Glacial Maximum: evidence from northwestern Australia to constrain ice volumes for oxygen isotope stage 2.Crossref | GoogleScholarGoogle Scholar |